 Open Access Article
Fused pyrazole-phenanthridine based dyads: synthesis, photo-physical and theoretical studies, and live cell pH imaging†
Venkatesan Muthukumara,
Sathishkumar Munusamyb,
Krishnan Thirumoorthy a,
Sathish Sawminathana and
Sathiyanarayanan KulathuIyer
 *a
*a
aChemistry Department, School of Advanced Sciences, Vellore Institute of Technology University, Vellore-632014, Tamil Nadu, India. E-mail: venket.chem88@gmail.com
bInstitute of Physical Sciences, National Autonomous University of Mexico, Mexico
First published on 26th November 2019
Abstract
The arrangement of small sized molecules with a scaffold structure plays an active role in the fields of sensors and health care. An efficient molecular design strategy for four pyrazole-phenanthridine based D–π–A luminophores, denoted as 2a, 2b, 2c and 2d was developed to investigate the effect of acid on the photo-physical properties of these dyes. Photo-physical studies of the synthesized probes showed distinct absorption and emission under various pH conditions. Theoretical calculations using density functional methods were carried out for understanding the mechanistic aspects of the proton induced fluorescence. The experimentally observed photo-physical properties correlated well with theoretical results. Moreover, probes 2 and 2a can be used to monitor the fluorescence changes in E. coli cells under different pH conditions.
Introduction
Functional organic compounds, especially, stimuli-responsive organic emissive materials, have gained considerable attention in materials science,1–8 medicine,9–12 biology13–16 and environmental analytics.17–21 Among them, the acidochromic materials, whose emission response depends on the pH of the medium, have received considerable attention because they find applications in various fields of scientific research such as environment, ecology, agriculture, and biological processes. Facile and accurate measurement of pH is essential to study many chemical and physiological processes including the regulation mechanisms of cells. Among the various analytical methods, fluorescence pH sensors have many advantages such as high sensitivity and selectivity, rapid response, and low cost.22,23 Most of the fluorescence probes for pH sensing, can sense in the “on–off (or off–on)”mode24–28 and are less advantageous than “off–on–off” sensors. Unfortunately, the development of “off–on–off” sensors demands complex molecular design to meet the structural and electronic properties. Fluorescence probes to sense pH, based on various fluorophores such as xanthenes, BODIPY, cyanine, rhodamine, and phthalimide29–34 have been developed. However, these sensors lack the key qualities such as photostability of the probe and reversibility.Our ongoing research program is on the development of fluorescent probes for multifield applications.35–37 Among the various probes that we developed, phenanthridine based materials are significant because of their tunable fluorescence nature. Recently, we have developed functionalized phenanthridine based probe for the selective detection Ru(III).38 In the current work, we report the facile synthesis, characterization and studies on pH sensing ability of fused pyrazole-phenanthridine derivatives. The characterization of the synthesized molecules was carried out by different spectroscopic techniques and X-ray crystallography to confirm the structure of the probes. In the synthesized probe, both pyridine and pyrazole act as donor moiety, which results in weak fluorescence. The synthesized probe undergoes protonation over the addition of H+ which results in the formation of pyridinium ion. The formation of pyridinium ion yielded D–π–A type dyes with intramolecular charge transfer (ICT) emission (Fig. 1) in which pyrazole acts as a donor and pyridinium ion acts as an acceptor. The induced color change is visible even to the naked eye. In addition, the greenish yellow fluorescence induced by trifluoroacetic acid can be reversed to its original fluorescence over the addition of triethylamine. More importantly, the synthesized probes have excellent selectivity towards H+ over other metal ion and another competitive moiety. The synthesized probes have excellent cell permeability, and are applied successfully to monitor pH fluctuations in living cells. Computational studies are gaining great interest from the experimentalist view point to speculate various aspects in interpreting the experimental results. The use of Density Functional Theory (DFT) and Time-Dependent DFT (TDDFT) methods have been prominent in recent times for predicting the photo-physical properties and they are widely found in the literature.39–41 In particular, the photo-physical studies of different compounds to understand the unexpected solvent effect and acidochromic fluorescence were reported elsewhere. In view of that, theoretical calculations were carried out for the molecules of our interest, such as probe 2a and 2b with implicit solvation model first. Further, one TFA molecule is explicitly considered to observe the intermolecular interaction with 2a and 2b separately, and is named as 2a-TFA and 2b-TFA, which would eventually shed light on the experimentally observed photo-physical properties.
Experimental section
Chemicals and apparatus
Starting material used for synthesis and solvents for the analytical use were bought from commercial sources and were used as such without any further purification. The molecular weight of the compound was obtained using JEOL GCMATE mass spectrometer.1H and 13C NMR was obtained using Bruker Ascend III 400 MHz spectrometer using CDCl3, UV spectra were recorded using Shimadzu 3600 spectrometer with a quartz cell (path length = 1 cm) at room temperature. Emission spectra were recorded using Hitachi High Technologies spectrometer. Single crystal X-ray diffraction was carried out with Bruker Kappa APEXII.Procedure for the synthesis of probes and characterization
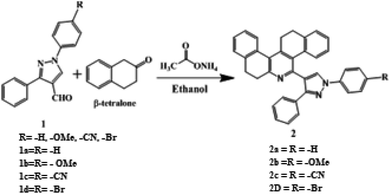
Compound 1 and its derivatives were synthesized according to the procedure stated in literature,49 while compound 2 was prepared according to the following procedure. In an oven dried conical flask, ammonium acetate was (2 mmol) taken and dissolved in ethanol solvent. To this, compound 1 was added (2 mmol) and warmed. To this reaction mixture, two equivalents of 2-tetralone were added and the reaction mixture was stirred overnight. The completion of the reaction was monitored by TLC. Column chromatography was carried out for the reaction mixture over silica gel. Compound 2 was separated in 2% ethyl acetate in hexane. Yield: 65%. 1H NMR and 13C were recorded by dissolving compounds in CDCl3 solvent. Chemical shifts (δ) are given in ppm relative to TMS internal standard.Computational calculation methods
Computational chemistry calculations were carried out to understand the experimentally observed photo-physical properties in TFA solvent polarity. The reported molecules in the present work such as 2a, 2b, 2a-TFA and 2b-TFA were first optimized in gas phase and later in solution phase by considering the dielectric medium of the TFA solvent. The structural optimization of 2a, 2b, 2a-TFA and 2b-TFA molecules was carried out using DFT methods. In DFT, the well-known exchange–correlation functional (XC) function, Becke 3-parameter (B3) combined with Lee–Yang–Parr (LYP)42,43 correlation functional, popularly called as B3LYP was utilized in the present work. The B3LYP functional with 6-31+G* split valence basis set was used for all the computational calculations. The integral equation formalism (IEF) version of the polarizable continuum model (PCM)44 was employed to incorporate the solvent effects in the computational calculations. The ground state optimized geometries obtained in gas phase and also in TFA solvent phase were used separately to find the singlet excited state structure of 2a, 2b, 2a-TFA and 2b-TFA molecules with TDDFT45,46 method. All TD-DFT calculations were carried out using single point calculation from optimized geometries of 2a, 2b, 2a-TFA and 2b-TFA at B3LYP/6-31+G* level of theory. The positive frequencies obtained from the normal mode analysis for all ground state geometries ascertained that all the optimized structures were in their global minimum. All the quantum chemical calculations were performed with Gaussian 09W package.47 The structures and electron density plots were obtained with help of GaussView 5.0 program.48Cell toxicity assay evaluation
The cytotoxicity of compound 2a and 2b against E. coli bacteria was estimated using liquid Luria–Bertani medium (LB). From this 400 μL of freshly prepared E. coli culture (10 h) was centrifuged at 3000 rpm for 20 min at 4 °C. Supernatant liquid Luria–Bertani medium (LB) was removed, and the pellet containing bacterial cells was washed twice with 800 μL PBS (150 mM NaCl, pH 7.4) followed by centrifugation at 3000 rpm for 20 min at 4 °C. The pellet with bacterial cells alone is used as control. The final pellet containing purified bacterial cells were mixed with 50 μL PBS containing probe 2a (in 1![[thin space (1/6-em)]](https://www.rsc.org/images/entities/char_2009.gif) :
:![[thin space (1/6-em)]](https://www.rsc.org/images/entities/char_2009.gif) 1 v/v THF–water). In this absorbance was monitored by microplate reader. The cell viability was expressed by the difference in absorbance of samples and control. This same procedure was repeated for the compound 2b also. The percentage of cell growth inhibition was calculated by the following formula % cytotoxicity = 100 − % cell viability.
1 v/v THF–water). In this absorbance was monitored by microplate reader. The cell viability was expressed by the difference in absorbance of samples and control. This same procedure was repeated for the compound 2b also. The percentage of cell growth inhibition was calculated by the following formula % cytotoxicity = 100 − % cell viability.
Results and discussion
Design and synthesis
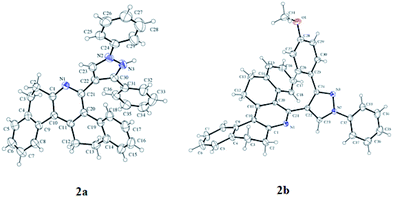
The synthesis of (1,3-diphenyl-1H-pyrazole-4-yl)-7,8,13,14-tetrahydrodibenzo[a,i]phenanthridine is outlined in Scheme 1. Precursor 1a and its derivatives1b–d were prepared by following the literature procedure. Probes 2a–d, the subject material, were facilely synthesized by the reaction of the respective aldehydes 1a–d with β-tetralone and ammonium acetate following a method that was previously reported by our research group. All the synthesized compounds were thoroughly characterized by 1H NMR, 13C NMRand mass spectroscopy. Compound 2 and 2a was recrystallized by a slow evaporation method using ethanol–THF mixture and the crystal structure of the compound was elucidated using the X-ray diffraction technique (Fig. 2).Probes 2a–d was designed to have a phenanthridine fluorophore capable of interacting with H+ and pyrazole, which was an electron donor that weakened the emission of phenanthridine. It was designed in a manner that when the probe interacted with H+, the subsequent formation of pyridinium ion induced D–π–A type of ICT system and the fluorescence of the probe would be switched on. The pyridinium ion state of the probe can be brought back to pyridine state by introducing triethylamine (TEA) and the fluorescence can be turned off.
Influence of H+ on the absorption and emission properties of the probes
The optical property of the acid sensitive molecule can be perturbed by the change in electronic delocalization in a molecule over the addition of protons. Generally, the nitrogen hetero atom containing fluorophores is responsible for acidochromism because of the availability of the lone pair of electrons on the nitrogen to bind with protons. In order to study the acidochromic property of the synthesized molecules, we analysed the proton-sensing ability of the compounds 2a–2d, which arise from the proton binding property of pyridine moiety. The normalized UV-vis absorption of compounds 2a to 2d is shown in Fig. S19† and their related photo-physical parameters are given in Tables 1 and 2. Distinct effects of substituent on their electronic properties, such as, large Stokes shift (1: 151 nm; 2: 130 nm; 3: 176 nm) and high molar absorptions were observed. Compound 2a and 2b exhibited similar absorption spectra with two distinct absorption maxima. The peak at 269 nm was due to the n–π* transition and the peak at 320 is attributed to the π–π* transition. However, in compound 2c and 2d, the absorption peak responsible for n–π* transition had slight bathochromic shift and appeared at 270 nm and 272 nm respectively. Furthermore, the π–π* transition had phenomenal redshift and appeared in the region of 367 nm. This can be explained on the basis of their extended conjugation and development of ICT due to the presence of electron donating (–Br) and withdrawing (–CN) groups.| λabs (2 + TFA) (nm) | λem (2 + TFA) (nm) | SS (2+ TFA) (nm) | Φf (2 + TFA) | |
|---|---|---|---|---|
| 2a | 279, 315 | 463 | 196 | 0.11 |
| 2b | 265, 318 | 457 | 190 | 0.07 |
| 2c | 270, 367 | — | — | — |
| 2d | — | — | — | — |
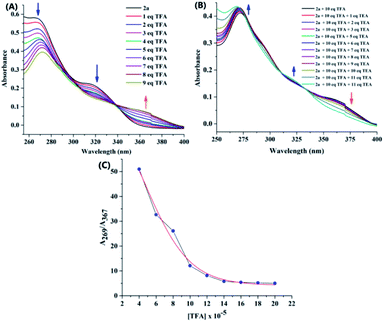
We initially evaluated the changes in the UV-visible spectrum of probes with and without the addition of H+. In this study, trifluoroacetic acid (TFA) was chosen as the acid source. Probe 2a was dissolved in chloroform solvent and the absorption spectra were recorded. To this solution, when TFA was added, the intensity of the peak at 267 nm progressively decreased with bathochromic shift and the peak at 320 nm completely disappeared (Fig. 3). In addition, a new peak originated at the excitation wavelength of 367 nm. This clearly indicated that intramolecular charge transfer was induced over the addition of TFA. Considering the new absorption at ca. 367 nm, TFA-protonated 2a in CHCl3 formed the cation 2a-H+. As shown in Fig. 3C, the ratio of absorption at 267 nm to that at 367 nm, A269/A367 had good linear relationship with the increasing concentration of TFA for up to 10 equivalents. Furthermore, these absorption changes can be significantly reversed on neutralization with bases such as triethylamine (TEA). Almost similar absorption spectral changes were observed for 2b upon the addition of TFA and TEA. Unfortunately, the absorption of the probes 2c and 2d was not affected by the TFA. Hence, further studies were carried out using only probes 2a and 2b.
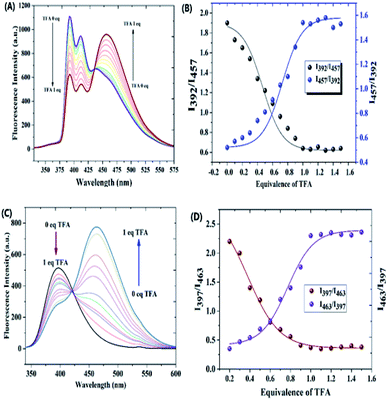
Fig. S21† shows the normalized emission spectra of the probes 2a and 2b at concentration 5 × 10⁻⁵ M in chloroform solvent. When excited at 269 nm, probe 2a exhibited three intense peaks at 392 nm, 414 nm and a shoulder peak at 446 nm, whereas, probe 2b displayed an intense emission at 397 nm. The extended conjugation in the pyrazole ring due to the presence of the methoxy group could be the reason behind the red-shifted emission maxima. The emission spectra of the compound 2a and 2b underwent significant ratiometric changes over the addition of TFA. The corresponding spectra are shown in Fig. 4A and C. In the case of probe 2a, fluorescence intensities at 392 nm and 414 nm decreased progressively but it was accompanied by a remarkable increase in the redshifted fluorescence intensity at 457 nm (Fig. 4B). In probe 2b, the intensity of the peak at 397 nm decreased progressively with a concomitant increase in the intensity of the redshifted peak at 463 nm (Fig. 4D). A well-defined iso emissive point in the emission spectra suggested that the only reaction was the binding of ligand with the proton. We think that the emergence of new emission peak at the higher wavelength is due to the formation of ICT which arises due to the protonation of the probes (Fig. 5). Furthermore, the shift of two emission wavelengths are large (ΔF = 65 nm for 2a; ΔF = 66 nm for 2b) which contributes to the accurate measurement of emission intensities. As shown in the Table 1, addition of TFA to the probe 2a increased the stokes shift from 125 nm to 196 nm for probe 2a and from 130 nm to 190 nm for probe 2b. It was noted that the fluorescence quantum yields (Φf) for the probes 2a and 2b decreased significantly for the protonated form (Table 1). The linear ratiometric fluorescence response of the probes towards TFA concentration is of particular importance. The ratio of the emission intensity I392/I457 for 2a and I397/I463 for 2b has linear correlation with the concentration of TFA. The linear equation was found to be y = 0.0000096 + 0.4 for 2a and y = 0.000023 + (−0.33) for 2b (Fig. S22†) indicating that probes 2a & 2b can quantitatively detect H+ concentration. Furthermore, clear fluorescence color change was observed for compound 2a from blue to green while adding TFA as shown in the Fig. 5.
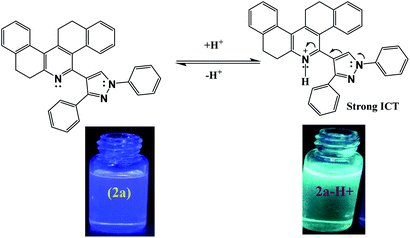 | ||
| Fig. 5 Mechanism of protonation of compound 2a and the fluorescence color change of the probe over acidification. | ||
Reversibility of the receptor
The possible deprotonation of the probe 2a and 2b and its fluorescence spectrum over the addition of TEA was monitored. On addition of TEA, the fluoresce spectrum of protonated species 2a-H+ and 2b-H+ got completely reversed and fluoresce spectrum almost similar to that of free 2a and 2b was obtained (Fig. S23†). The reversible behaviour of the probe 2a and 2b is shown in Fig. 6. The fluorescence of the protonation and deprotonation states for both the probes was reversed for up to six cycles without much variation in the intensity of fluorescence. Hence, this probe can be used multiple times to analyse the proton concentration.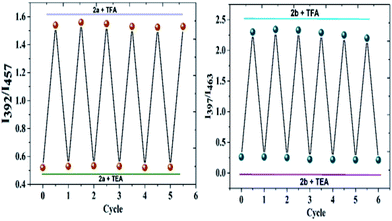 | ||
| Fig. 6 The fluorescence intensity ration of 2a and 2b upon consecutive addition of TFA and TEA for up to six cycles. | ||
Emission properties of the probes towards pH
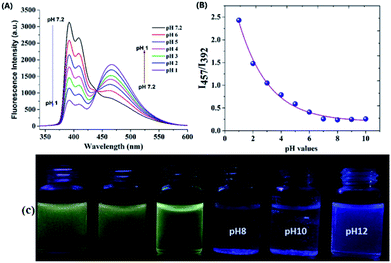
The fluorescence spectroscopic property of the probes was studied in different pH buffers containing 50% ACN. Probe 2a exhibited fluorescence emission at 392 nm, and when pH of the buffer was higher than 7.0 no new emission bands were observed. As shown in the Fig. 7, when the pH of the medium was decreased from 7 to 1, gradual emergence of new emission peak was observed at 457 nm. In addition, the fluorescence emission of the compounds changed from blue to yellowish green under UV light irradiation (Fig. 7C) suggesting the potential of the probe 2a to sense the different pH conditions of the medium. The pKa was calculated at abrupt points by plotting Boltzmann fitting curve as shown in the Fig. 7B. The pKa was found to be 3.12 ± 0.02 indicating the excellent pH sensing ability of probe 2a.Even though probe 2b showed significant fluorescence ratiometric behaviour with TFA in chloroform, its effect on pH was relatively less. This could due to the water intolerance of the probe 2b.
The optical properties in different solvents
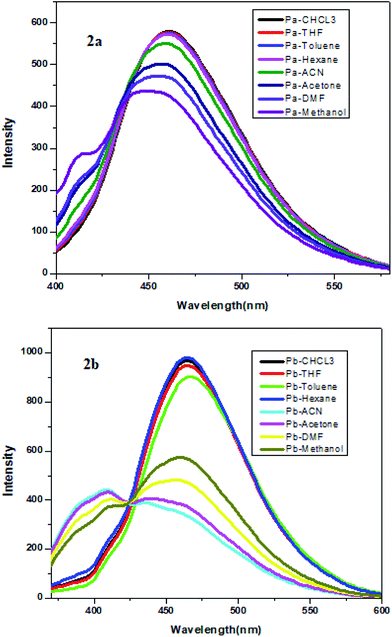
We try to optimize the quantum efficiency of compound 2a and 2b in different types of solvents. This showed that distinct interaction of the molecules in non-polar and polar solvents. While increasing the solvent polarity, the spectrum showed red shift with lower intensity. It may be due to the dipole interaction between lone pair of pyridine nitrogen and H+ ion from polar solvent (Fig. 8) and Table 3.| Pa | Pb | |||
|---|---|---|---|---|
| λem (nm) | Φfa | λem (nm) | Φfa | |
| a Fluorescence quantum yield. | ||||
| Low polar solvent | ||||
| CHCl3 | 461.22 | 0.20 | 464.84 | 0.17 |
| THF | 461.22 | 0.18 | 464.84 | 0.17 |
| Toluene | 460.78 | 0.19 | 467.70 | 0.18 |
| Hexane | 460.71 | 0.18 | 464.84 | 0.18 |
![[thin space (1/6-em)]](https://www.rsc.org/images/entities/char_2009.gif) |
||||
| High polar solvent | ||||
| Acetonitrile | 459.42 | 0.20 | 408, 437 | 0.17 |
| Acetone | 456.26 | 0.18 | 409, 440 | 0.17 |
| Dimethelyformate | 455.82 | 0.19 | 399, 459 | 0.18 |
| Methanol | 413, 449 | 0.18 | 409, 461 | 0.18 |
Selectivity and anti-interference studies
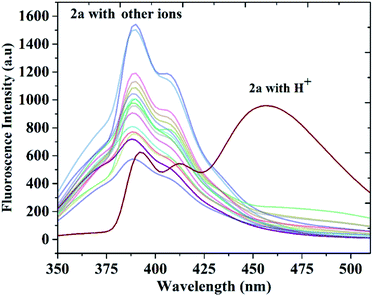
The selectivity and anti-interference of this probe to H+ was examined by measuring the fluorescence spectra of the probes with competing ions, such as, metal ions (Pb2+, Ni2+, Fe2+, Cu+, Zn2+, Cd+, Ag2+, Pd2+, Hg2+, Cu2+, Cr3+, Fe3+, Al3+, Hg2+), anions (F−, Cl−, I−, HCO3−, CH3COO−) and thiol involved biomolecules (cysteine). As shown in Fig. 9, other ions and small molecules induced no obvious change or quenching effect on the fluorescence spectra of the probe 2a. Similar selectivity of H+ was observed for compound 2b also (Fig. S24†). The fluorescence sensing study of the probe towards H+ was also studied in the presence the ions mentioned above. The results demonstrated that the presence of other ion had no influence on the detection H+. These results suggest that the probes have good selectivity and anti-interference ability towards the detection of H+.Theoretical results
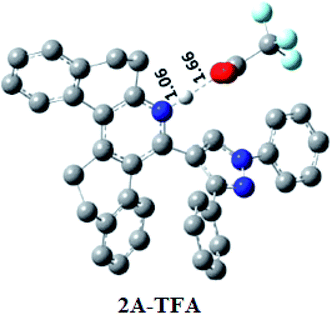
Theoretical calculations were performed using DFT and TDDFT methods in phases, the gas phase and the solution phase, for understanding the structural properties of the investigated systems. The optimized geometry of probe 2a is shown in Fig. 10. The energy minimized structure of probe 2b is shown in Fig. S25.† Table 2 pre-sets the optimized geometrical parameters of probe 2a at B3LYP/6-31+G* level of theory by comparing them with the available crystal structure. The selected structural parameters as shown in Table 4 are in good agreement with crystal geometry. The calculated bond length of N2–N3 was ∼1.356 Å and bond angle N2–C23–C22 was ∼107.6° for probe 2a. Notable deviations in the calculated structural parameter were not observed at B3LYP/6-31+G* level of theory. Further, probes 2a and 2b were explicitly treated with one TFA (considered as 2a-TFA and 2b-TFA respectively) and 2a-TFA and 2b-TFA which were optimized with implicit solvation model. The optimized electronic structures of 2a-TFA and 2b-TFA are shown in Fig. 10 and S26† respectively (Fig. 11).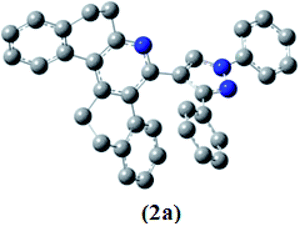 | ||
| Fig. 10 The optimized geometry of 2a at B3LYP/6-31+G* level of theory. The implicit solvation model is used for structure optimization in TFA solvent. All hydrogen atoms are omitted for clarity. | ||
| Structural parameters | 2a | |
|---|---|---|
| B3LYP/6-31+G* | Crystal | |
| Bond length (Å) | ||
| C1–N1 | 1.333 | 1.334 |
| C24–N2 | 1.422 | 1.422 |
| C23–N2 | 1.363 | 1.352 |
| C30–N3 | 1.338 | 1.324 |
| C21–N1 | 1.349 | 1.349 |
| C30–C31 | 1.477 | 1.471 |
| C21–C22 | 1.484 | 1.473 |
| N2–N3 | 1.357 | 1.356 |
| C18–C19 | 1.406 | 1.396 |
| Structural parameters | 2a | |
|---|---|---|
| B3LYP/6-31+G* | Crystal | |
| Bond angle (°) | ||
| N1–C1–C2 | 117.3 | 124.1 |
| C1–C2–C3 | 109.8 | 110.5 |
| N2–C23–C22 | 107.6 | 108 |
| C29–C24–N2 | 119.7 | 119.7 |
| C25–C24–N2 | 120 | 120.6 |
| C36–C31–C30 | 121 | 121.4 |
| N1–C21–C20 | 122 | 122.4 |
The TDDFT calculations were carried out for accounting excitation energy in TFA solvent using B3LYP/6-31+G* level of theory. The calculated UV-vis absorption wavelength of FMO pairs responsible for the excitation energy and its contribution in percentage is provided in Table 5. Compound 2a showed itself as having electron rich pyrazole moiety, exhibiting excitation energy 326.3 nm, whereas 2a+H+, the acceptor pyridinium ion exhibited excitation energy 367.23 nm due to elongated conjugation with HUMO–LUMO transition. Similarly, the observed excitation energy difference between 2b and 2b+H+ was 59.53 nm with same HUMO–LUMO transition.
| Structures | PCM/B3LYP/6-31+G* in TFA solvent | ||
|---|---|---|---|
| Excitation energy (nm) | FMO transition | FMO pair contribution (%) | |
| 2a | 326.13 | HOMO → LUMO | 69 |
| 2b | 336.44 | HOMO → LUMO | 70 |
| 2a-TFA | 367.23 | HOMO → LUMO | 70 |
| 2b-TFA | 395.97 | HOMO → LUMO | 70 |
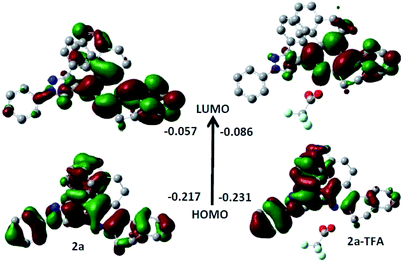
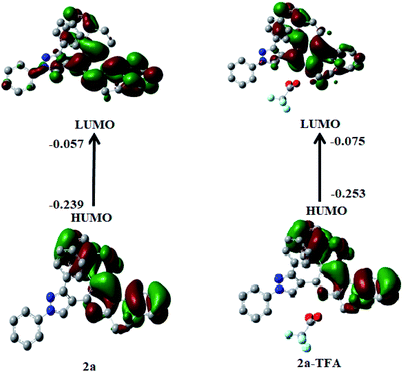
The Frontier Molecular Orbital's (FMO) density plots of probe 2a and 2a-TFA are shown in Fig. 12. Fig. S27† shows the FMO density plots of probe 2b and 2b-TFA. In the highest molecular orbital (HOMO), the electron density was mainly accumulated on pyrazole coordinated pyridine ring but in the lowest unoccupied molecular orbital (LUMO), it was localized on phenanthridine moiety. The calculated UV-vis spectra of 2a, 2b, 2a-TFA and 2b-TFA in TFA medium are shown in Fig. 13.
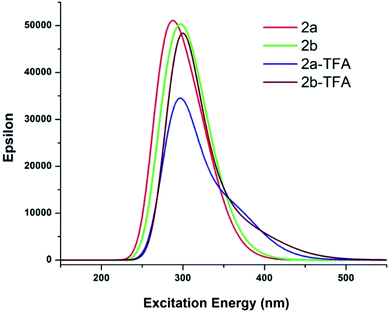 | ||
| Fig. 13 UV-vis spectra of investigated molecules in TFA medium. All single point TDDFT calculations employed in optimized structures in TFA solvent medium at PCM/B3LYP/6-31+G* level of theory. | ||
To understand the photo-physical properties of investigated systems, the absorption bands 2a and 2a + H+were observed in gas phase and also in the acidic medium (TFA). The experimental results of the probe 2a showed two peaks at 267 nm and 320 nm. The absorption intensity got enhanced to 279 nm and 315 nm when it was treated with solvent TFA. The theoretically calculated UV-vis wavelength absorption maximum, λmax (nm) which was obtained by employing the TDDFT method in gas phase and also in TFA medium are provided in Table 6. The MO transition, which was responsible for λmax in 2a and 2a-TFA, is shown in Fig. 14.
| Structures | MO transition | B3LYP/6-31+G* | Exp. | |
|---|---|---|---|---|
| λmax (nm) | λmax (nm) | |||
| Gas phase | TFA | |||
| 2a | HOMO−2 → LUMO | 301 | 285 | 267, 320 |
| 2a-TFA | HOMO → LUMO+1 | 289 | 294 | 279, 315 |
| 2b | HOMO → LUMO+2 | 306 | 305 | 267, 320 |
| 2b-TFA | HOMO → LUMO+2 | 298 | 296 | 265, 318 |
In 2a, MO transition occurred from HOMO−2 to LUMO but in the case of 2a-TFA, the MO transition happened from HOMO−2 to LUMO+1. Fig. S28† shows MO transitions which are responsible for the corresponding λmax values in 2b and 2b-TFA. This happens because of HOMO to LUMO+2 in both cases. The computed results on MO transitions showed the single mode of peak at 285 nm in acidic medium and at 301 nm in gas phase and the MO transition was associated with HOMO−2 to LUMO for the probe 2a. In TFA, with an explicit treatment with probe 2a, the absorption band increased to 294 nm with HOMO−2 to LUMO+1 transition. This indicates that the electron density of pyrazole influenced by internal charge transfer in acidic medium, led to the formation of a rigid structure of donor–π–acceptor conjugation with pyridinium ion. Similarly, the absorption band of probe 2b and 2b + H+ showed a single mode of peak at 306 nm in gas phase and 305 nm in solution phase by dominated HOMO–LUMO+2 transition. The observed absorption band slightly decreased from 298 nm in gas phase to 296 nm in TFA, thus accounting for the rigidity that occurred in the attachment of methoxy segment. As discussed above, theoretically computed photo-physical properties corroborated well with experimental data.
Application in living cell pH imaging
To demonstrate the pH sensing ability of the probes inside the cells, Escherichia coli (E. coli) cells were employed for cell imaging50–52 at different pH values. An ionophore nigericin was used in order to allow the H+ ions to pass through the cells to maintain the required pH in the cell. E. coli cells were treated with probes in PBS buffer (pH = 7.4) for 30 minutes at 37 °C and then washed three times with buffer solution of varying pH levels. The fluorescence microscope images of E. coli cells with probes 2a and 2b are shown in Fig. 15. E. coli cells exhibited bright blue color image when intracellular pH was 7.4, indicating that probes 2a and 2b were permeable to the cell membrane, and they successfully internalized into the cells. As shown in the Fig. 15, the bright blue emission of the cell completely vanished when the pH of the solution was altered from basic to acidic and bright green color was noticed. This cell imaging experiment was in good agreement with the results obtained in the aqueous solution, thus indicating the excellent bioimaging performance of the synthesized probes to detect the change of pH values in living cells.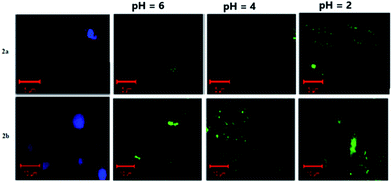 | ||
| Fig. 15 Fluorescence microscopic images of living E. coli cells incubated with probe 2a and 2b for 30 min at 37 °C and then incubated with various pH buffers. | ||
Moreover, the cell viability (after incubation) with the E. coli bacteria at different concentration was estimated. The observed data indicates that cell viability remained above 85% upon incubation. This shows the cytotoxicity was present in negligible amount for compound 2a and 2b. The observed data were showed in Fig. S29.†
Conclusion
We have synthesized new class of fused phenanthridine-pyrazole compounds whose proton sensing ability originates from the induced intra molecular charge transfer mechanism. Probes 2a and 2b showed excellent fluorescent ratiometric behaviour over the addition of TFA. Moreover, the fluorescence property of the protonated probe can be reversed several times. The fluorescence of compound 2a exhibited excellent pH-responsive abilities in the pH range of 7 to 1 with the pKa value at 3.12. Further, probes 2a and 2b showed exceptional selectivity towards H+ ion and the fluorescence was much less perturbed with other competitive ions and molecules. The acid responsive mechanism of the probes 2a and 2b was investigated by DFT and TDDFT methods. The experimentally observed photo-physical properties were well correlated with FMO transitions and their ponding excitation energy. The experiment of living cell imaging of pH showed remarkable bio-imaging performance of probes 2a and 2b.Conflicts of interest
There is no conflict of interest.Acknowledgements
The authors thank VIT Management for funding through seed money (Grand 2018-2019) and DST-FIST and VIT-SIF for FT-NMR facility and authors would like to thank Dr R. Srinivasan, SSL, Vellore Institute of Technology for language editing.Notes and references
- H. Ju, W. Kang, J. Zhang, H. Geng, Z. Liu, G. Zhang, Y. Zhao and D.-Q. Zhang, Chem. Mater., 2017, 29, 3580–3588 CrossRef CAS.
- A. Al Mousawi, F. Dumur, P. Garra, J. Toufaily, T. Hamieh, B. Graff, D. Gigmes, J. P. Fouassier and J. Lalevée, Macromolecules, 2017, 50, 2747–2758 CrossRef CAS.
- A. Al Mousawi, P. Gaara, X. Sallenave, F. Dumur, J. Toufaily, T. Hamieh, B. Graff, D. Grimes, J. P. Fouassier and J. Lalevée, Macromolecules, 2017, 50, 4913–4926 CrossRef CAS.
- H.-Y. Chen, G. Schweicher, M. Planells, S. Ryno, K. Broch, A. White, D. Simatos, M. Little, C. Jellett, S. Cryer, A. Marks, M. Hurhangee, J.-L. Bredas, H. Sirringhaus and I. McCulloch, Chem. Mater., 2018, 30, 7587–7592 CrossRef CAS.
- V. Prakasam, F. Di Giacomo, R. Abbel, D. Tordera, M. Sessolo, G. Gelinck and H. J. Bolink, ACS Appl. Mater. Interfaces, 2018, 10, 41586–41591 CrossRef CAS PubMed.
- Z. Yang, Z. Mao, Z. Xie, Y. Zhang, S. Liu, J. Zhao, J. Xu, Z. Chi and M. P. Aldred, Chem. Soc. Rev., 2017, 46, 915–1016 RSC.
- X. Yang, G. Zhou and W.-Y. Wong, Chem. Soc. Rev., 2015, 44, 8484–8575 RSC.
- J. Tagare and S. Vaidyanathan, J. Mater. Chem. C, 2018, 6, 10138–10173 RSC.
- W. Wu, C. Z. Jiang and V. A. L. Roy, Nanoscale, 2016, 8, 19421–19474 RSC.
- X. He, Z. Zhao, L.-H. Xiong, P. F. Gao, C. Peng, R. S. Li, Y. Xiong, Z. Li, H. H.-Y. Sung, I. D. Williams, R. T. K. Kwok, J. W. Y. Lam, C. Z. Huang, N. Ma and B. Z. Tang, J. Am. Chem. Soc., 2018, 140, 6904–6911 CrossRef CAS PubMed.
- D. Xu, H. Zou and M. Liu, J. Colloid Interface Sci., 2017, 508, 248–253 CrossRef CAS PubMed.
- J. Li, X. Zhen, Y. Lyu, Y. Jiang, J. Huang and K. Pu, ACS Nano, 2018, 12, 8520–8530 CrossRef CAS PubMed.
- J. Qi, C. Sun, D. Li, H. Zhang, W. Yu, A. Zebibula, J. W. Y. Lam, W. Xi, L. Zhu, F. Cai, P. Wei, C. Zhu, R. T. K. Kwok, L. L. Streich, R. Prevedel, J. Qian and B. Z. Tang, ACS Nano, 2018, 12, 7936–7945 CrossRef CAS PubMed.
- V. Aruna, V. Aruna and Y. Gao., ACS Appl. Bio Mater., 2018, 1, 298–309 CrossRef.
- K. Y. Zhang, Q. Yu, H. Wei, S. Liu and Q. Zhao, Chem. Rev., 2018, 118, 1770–1839 CrossRef CAS PubMed.
- S. M. A. Fateminia, Z. Mao, S. Xu, Z. Yang, Z. Chi and B. Liu, Angew. Chem., 2017, 56, 12160–12164 CrossRef CAS PubMed.
- J. F. d. S. Petruci, P. C. Hauser and A. A., Sens. Actuators, B, 2018, 268, 392–397 CrossRef CAS.
- N. Kwon, Y. Hu and J. Yoon, ACS Omega, 2018, 3, 13731–13751 CrossRef CAS PubMed.
- J. F. d. S. Petruci and A. A. Cardoso, Anal. Chem., 2016, 88, 11714–11719 CrossRef CAS PubMed.
- M. Lee, Y.-C. Jang, W. Den and P. Kuo, Synthesis of Fluorogenic Chemosensors for Hg2+ Detection Using Naphthalimide Derivatives, American Chemical Society, 2014, vol. 1184, pp. 49–69 Search PubMed.
- X. Zhou and S. Lee, Chem. Rev., 2015, 15, 7944–8000 CrossRef PubMed.
- Z. Simić, Z. Stanić and M. Antonijevic, J. Braz. Chem. Soc., 2010, 22, 709–717 CrossRef.
- N. Balázs and P. Sipos, Carbohydr. Res., 2007, 342, 124–130 CrossRef PubMed.
- J. Fan, C. Lin, H. Li, P. Zhan, J. Wang, S. Cui, M. Hu, G. Cheng and X. Peng, Dyes Pigm., 2013, 99, 620–626 CrossRef CAS.
- S. Radunz, H. R. Tschiche, D. Moldenhauer and U. Resch-Genger, Sens. Actuators, B, 2017, 251, 490–494 CrossRef CAS.
- K. Aggarwal and J. M. Khurana, J. Photochem. Photobiol., A, 2015, 307–308, 1–18 Search PubMed.
- E. Faggi, J. Serra-Vinardell, M. D. Pandey, J. Casas and G. Fabriàs, Sens. Actuators, B, 2016, 234, 633–640 CrossRef CAS.
- A. Thottiparambil, P. R. A. Kumar and L. Chakkumkumarath, RSC Adv., 2014, 4, 56063–56067 RSC.
- M. Tian, X. Peng, J. Fan, J. Wang and S. Sun, Dyes Pigm., 2012, 95, 112–115 CrossRef CAS.
- D. Aigner, S. M. Borisov, F. J. O. Fernández, J. F. Fernández Sánchez, R. Saf and I. Klimant, Talanta, 2012, 99, 194–201 CrossRef CAS PubMed.
- Y. Chen, C. Zhu, J. Cen, Y. Bai., W. He and Z. Guo, Chem. Sci., 2015, 6, 3187–3194 RSC.
- P. Guo, L. Liu, Q. Shi, C. Yin and X. Shi, J. Mol. Struct., 2017, 1130, 150–155 CrossRef CAS.
- J. Fan, C. Lin, H. Li, P. Zhan, J. Wang, S. Cui, M. Hu, G. Cheng and X. Peng, Dyes Pigm., 2013, 99, 620–626 CrossRef CAS.
- R. Shi, L. Huang, X. Duan, G. Sun, G. Yin, R. Wang and J. Zhu, Anal. Chim. Acta, 2017, 988, 66–73 CrossRef CAS PubMed.
- S. Munusamy and S. Kulathu Iyer, Tetrahedron: Asymmetry, 2016, 27, 492–497 CrossRef CAS.
- S. Munusamy, V. P. Muralidharan and S. K. Iyer, Sens. Actuators, B, 2017, 250, 244–249 CrossRef CAS.
- S. K. Munusamy, K. Thirumoorthy, V. Panyam Muralidharan, U. Balijapalli and S. Kulathu Iyer, Sens. Actuators, B, 2017, 244, 175–181 CrossRef CAS.
- M. Venkatesan and S. Kulathu Iyer, Sens. Actuators, B, 2018, 267, 373–380 CrossRef CAS.
- M. Venkatesan and K. I. Sathiyanarayanan, Sens. Actuators, B, 2018, 267, 373–380 CrossRef CAS.
- V. P. Gupta, in Principles and Applications of Quantum Chemistry, ed. V. P. Gupta, Academic Press, Boston, 2016, pp. 155–194 Search PubMed.
- A. Charaf-Eddin, A. Planchat, B. Mennucci, C. Adamo and D. Jacquemin, J. Chem. Theory Comput., 2013, 9(6), 2749–2760 CrossRef CAS PubMed.
- A. D. Becke, Phys. Rev. A: At., Mol., Opt. Phys., 1988, 38, 3098–3100 CrossRef CAS PubMed.
- C. Lee, W. Yang and R. G. Parr, Phys. Rev. B: Condens. Matter Mater. Phys., 1988, 37, 785–789 CrossRef CAS PubMed.
- J. Tomasi, B. Mennucci and R. Cammi, Chem. Rev., 2005, 105, 2999–3093 CrossRef CAS PubMed.
- R. E. Stratmann, G. E. Scuseria and M. J. Frisch, J. Chem. Phys., 1998, 109, 8218–8224 CrossRef CAS.
- M. E. Casida, C. Jamorski, K. C. Casida and D. R. Salahub, J. Chem. Phys., 1998, 108, 4439–4449 CrossRef CAS.
- M. J. Frisch. G. W. Trucks. H. B. Schlegel. G. E. Scuseria. M. A. Robb, J. R. Cheeseman, et al., Gaussian 09, Gaussian, Inc., Wallingford, CT, USA, 2009 Search PubMed.
- T. Keith and J. Millam, GaussView, version 5.0.9, Semichem Inc., Shawnee Mission, KS, USA, 2009 Search PubMed.
- K. S. Pawan, C. Navneet, K. Pawan, S. Chetan and R. A. Kamal, Eur. J. Med. Chem., 2011, 46, 1425 CrossRef PubMed.
- S. Xia and H. Liu, Bioconjugate Chem., 2018, 29, 1406–1418 CrossRef PubMed.
- H. Liu, R. L. Luck, H.-M. Lee and J. Wang, J. Mater. Chem. B, 2019, 7, 198–209 RSC.
- X. Song and X. Liu, Anal. Chem., 2017, 89, 7038–7045 CrossRef PubMed.
Footnote |
| † Electronic supplementary information (ESI) available. CCDC 1561810 and 1561812. For ESI and crystallographic data in CIF or other electronic format see DOI: 10.1039/c9ra07860f |
| This journal is © The Royal Society of Chemistry 2019 |


