 Open Access Article
Application of Enteromorpha polysaccharides as a new coagulant aid to remove silver nanoparticles: role of dosage sequence and solution pH†
Shuang Zhao *a,
Feng Wangb,
Wenlin Jiaa,
Qianshu Sun
 a and
Zhangjian Zoua
aSchool of Chemistry and Materials Science, Jiangsu Normal University, Xuzhou, 221116, China. E-mail: zhaoshuang@jsnu.edu.cn
bCenter for Energy, Environment and Ecology Research, UR-BNU, Beijing Normal University, Beijing, 100875, China
First published on 5th December 2019
Abstract
Silver nanoparticles (AgNPs) in surface water cause a serious threat to the health of humans and aquatic organisms. However, it is difficult to remove AgNPs completely since they could adsorb onto the surface of humic acid (HA) and meanwhile release Ag+ into water. In this paper, Enteromorpha polysaccharides (Ep) were applied as a coagulant aid with polyaluminum chloride (PAC) to solve this problem. The influences of Ep dosage, dosing sequence and solution pH on the coagulation efficiency, kinetics and removal mechanism of AgNPs were discussed systematically. Results showed that when Ep was applied, AgNPs could be removed effectively due to charge neutralization of PAC hydrolysate and the bridging-sweeping role of Ep gel network. When Ep was added 30 s after PAC dosing, the coagulation efficiency was about 10–20% higher than that of the reverse order. Under this condition, flocs sizes achieved 450 μm when the solution pH was 6.0, which is much larger than that using Ep–PAC. Additionally, Ep showed an ability to promote the re-aggregation of broken flocs, and AgNP–HA flocs exhibited larger sizes, better shear resistance, higher recovery ability and denser structure at pH 6.0. Factorial analysis results indicated that PAC dosage had the greatest impact on HA and AgNP removal, while Ag+ removal is more sensitive to Ep dosage.
1. Introduction
Silver nanoparticles (AgNPs) have been applied widely in antibacterial medicine, and medical equipment production processes in recent years, which has inevitably resulted in their release into surface water.1–3 It has been reported that AgNPs could penetrate into the cells of humans and aquatic organisms, disrupting cell physiological activity.4,5 In addition, due to the large specific surface area of nano-scale Ag particles, AgNPs are easily adsorbed onto the surface of humic acid (HA) in surface water, which generates AgNPs–HA composite contaminants by electrostatic attractive, steric and van der Waals interactions. These interactions enhance the stability of the suspension system and make it more complicated to remove both AgNPs and HA from water.6,7 More seriously, the adsorbed HA will enhance Ag+ release from nanoparticles, which further aggravates the biological toxicity of AgNPs.8 Therefore, it is necessary to explore effective techniques for AgNP removal.Due to the large specific surface area and Ag+ release, the pollution of AgNPs mainly include two aspects: (1) stable colloidal dispersion system due to HA existence;9 (2) an ionic contaminant system due to Ag+ release. Generally, enhanced coagulation technology is considered for colloidal particles removing due to high efficiency and low cost. However, the use of traditional coagulants such as aluminum and iron salts could not remove AgNPs completely from water bodies, which usually resulted in 20% remaining in effluent water.10 The released Ag+ could be removed by traditional coagulant, but it requires a pH and dosage optimisation that is normally not considered.11 Therefore, it is of great significance to explore a new water treatment agent, which could destroy the stability of AgNPs to form large and dense flocs, and meanwhile adsorb Ag+ to avoid its accumulation.
To obtain large and dense flocs, applying coagulant aid combination with coagulant has been considered as an effective and low-cost way. If the coagulant aid could absorb Ag+ simultaneously, the harm of AgNPs will be completely eliminated. For the removal of heavy metal ions, algae polysaccharide has become a research hotspot due to its wide source. Studies showed that Chlorophyta, Cyanophyta and Phaeophyta are all exhibited excellent heavy metal adsorption properties.12,13 Algae are abundant around the world and some species are even inundated. One of them is Enteromorpha, which always brought serious ecological deterioration problems due to its large-scale blooms. The main components of Enteromorpha are polysaccharides (Ep, accounting for more than 50% of dry weight),14,15 which mainly composed of rhamnose, xylose, mannose, galactose and arabinose. When Ep was applied as coagulant aid with coagulant, its long carbon chains could form a chelate network structure, which could exert electric neutralization effect of coagulant, and meanwhile enhance net trapping action of cross-network structure to form lager flocs. In addition, Ep exhibits a high surface electronegativity and potential efficiency of Ag+ adsorption since amounts of carboxylic acid groups and sulfonic acid group were found.14 It was reported that the adsorption of Ni2+ by Ep could reach 3600 mg g−1, and the adsorption process accorded with quasi-secondary kinetic model.16 Therefore, applying Ep as a new coagulant aid is accordance with requirements of eliminating AgNPs and Ag+ simultaneously in theory, but the related research is quite lacking.
References only indicate that Ep could adsorb heavy metal ions, and also could capture colloidal particles. However, for the simultaneous presence of organic matter, heavy metal ions and nanoparticles, the coagulation efficiency when Ep cooperated with coagulant is still unreported. In addition, AgNPs aggregation morphologies, hydrolyzed species of coagulant and interactions between coagulant and AgNPs are directly influenced by coagulant dosage and solution pH, which result in various floc properties and unstable coagulation efficiency.17 Furthermore, the dosing sequence of coagulant and coagulant aid also has significant impact on polymerization degree of hydrolysates. Therefore, the adjustment of pH and dose sequence is an important and effective way to obtain higher AgNPs, HA and Ag+ removal rate. However, there are few reports about the corresponding research.
To solve these problems, Ep was prepared and used as coagulant aid with polyaluminum chloride (PAC) for AgNPs removal. The removal mechanism of AgNPs, HA and Ag+ was analyzed, and the effect of solution pH and Ep dosing sequence on coagulation performance and kinetics were studied systematically. Additionally, factorial analysis was also conducted to confirmed the main factor and interaction effects, which provides theoretical support for the control of AgNPs.
2. Materials and methods
2.1 Synthetic AgNPs–HA solution
AgNPs powder was purchased from Nanjing XFNANO Materials Tech. Co., Ltd, and its size, purity, tap-density and specific surface area was 60–80 nm, 99.9%, 2.5 g cm−3 and 3 m2 g−1, respectively. A Uniform distributed morphology could be found in SEM image of AgNPs powder (Fig. S1†). The dispersion of AgNPs (50 mg L−1) was prepared by dissolving 50 mg of AgNPs in 1 L ultrapure water, and then ultrasonic treatment was conducted twice for a cycle of 1 h. The preparation of HA stock solution (1g L−1) can be found in previous study.7HA stock solution (100 mL) was added into AgNPs dispersion (1 L), and then mixed with a magnetic stirrer for 30 min, followed by ultrasonic treatment for another 15 min. Finally, the solution was diluted to 10 L to prepare synthetic AgNPs–HA test water. This water sample contained 10 mg HA and 5 mg AgNPs per liter.
2.2 Coagulant and coagulant aid
The preparation method of PAC (10.0 g L−1) could be available in previous study.7 Ep was extracted from fresh Enteromorpha, which could be obtained from coastal cities. According to optimization results of pre-experiments, the preparation details of Ep were shown as follows: (1) dried Enteromorpha was crushed and then mixed with deionized water at a mass ratio of 1![[thin space (1/6-em)]](https://www.rsc.org/images/entities/char_2009.gif) :
:![[thin space (1/6-em)]](https://www.rsc.org/images/entities/char_2009.gif) 70; (2) the mixture was extracted by ultrasonic for 30 min and then heated in a water bath for 4 h at 90 °C; (3) supernatant was enriched to 20% of its original volume to obtain Ep crude extract solution; (4) excess alcohol was added followed by precipitation for 2 h; (5) the precipitates were dried by a lyophilizer, which was donated as Ep. When used as coagulant aid, 0.1 g of Ep powder was dissolved in 100 mL ultrapure water, and then stirred for 3–4 h until it dissolved completely. The concentration, viscosity, zeta potential and molecular weight distribution of Ep solution was 1g L−1, 1.09–1.15 × 10⁻³ Pa s, −35 ± 3 mV and 30–400 kDa respectively.
70; (2) the mixture was extracted by ultrasonic for 30 min and then heated in a water bath for 4 h at 90 °C; (3) supernatant was enriched to 20% of its original volume to obtain Ep crude extract solution; (4) excess alcohol was added followed by precipitation for 2 h; (5) the precipitates were dried by a lyophilizer, which was donated as Ep. When used as coagulant aid, 0.1 g of Ep powder was dissolved in 100 mL ultrapure water, and then stirred for 3–4 h until it dissolved completely. The concentration, viscosity, zeta potential and molecular weight distribution of Ep solution was 1g L−1, 1.09–1.15 × 10⁻³ Pa s, −35 ± 3 mV and 30–400 kDa respectively.
2.3 Coagulation process
Coagulation experiment was conducted by a jar-test apparatus. PAC was dosed firstly under the condition of rapid stirring, and then Ep was dosed 30 s later, which was defined as PAC–Ep composite coagulant. Inversely, PAC dosed 30 s after Ep dosing (defined as Ep–PAC) was also conducted to study the influence of dose sequence on coagulation efficiency. After coagulant addition, synthetic AgNPs–HA water of 1 L was subjected to rapid mixing (200 rpm) for 1 min, followed by slow mixing (40 rpm) for 15 min. Then solution was sedimented for 30 min to allow flocs settle down. Finally, supernatant was collected for the measurement of effluent indexes, which including residual turbidity, UV254 (HA removal), zeta potential, residual Ag+ and UV410 (AgNPs removal). A linear correlation between AgNPs concentration and its absorbance at the maximum absorption wavelength has been proved. Therefore, UV410 removal was selected to represent AgNPs removal efficiency according to Fig. S2.†2.4 Coagulation kinetics
Coagulation kinetics process, including flocs growth, breakage and regrowth, was studied by a coagulation generating device and a laser diffraction instrument (Fig. 1). Dual-coagulant was dosed to water sample with rapid mixing (200 rpm) for 60 s, followed by slow mixing (40 rpm) for 15 min. Then agitation speed was increased to 200 rpm for 5 min, and finally 40 rpm was reintroduced for a further 15 min. Floc characteristics, including floc size (d50), growth rate (Gr), strength factor (Sf), and recovery factor (Rf) could be calculated according to the data of Mastersizer 2000. Larger Sf and Rf values indicate that flocs could withstand higher shear force and exhibit better re-growth abilities. Their computing methods were displayed in previous study.7 Fractal dimension (Df) values of flocs could be calculated by the method of small angle laser light scattering. The light intensity “I” was measured as a function of scatter vector “Q”. Vector was defined as the difference between incident and scattered wave of radiation beam, which could be given by formula “I ∝ Q−Df”. This relationship is valid when the length scale of analysis is much larger than the size of primary particles and much smaller than the size of floc aggregates. Therefore, Df could be calculated by the slope of log![[thin space (1/6-em)]](https://www.rsc.org/images/entities/char_2009.gif) I versus log
I versus log![[thin space (1/6-em)]](https://www.rsc.org/images/entities/char_2009.gif) Q by fitting a straight line.
Q by fitting a straight line.
2.5 Factorial analysis
Multi-level factorial analysis (MFA) was conducted to investigate the response of coagulation process under a single factor by software minitab, and then the main effects factor could be confirmed.18 In addition, interaction analysis between the factors (PAC dosage, Ep dosage, dose sequence and solution pH) was also studied in this paper.3. Results and discussion
3.1 Effect of PAC and Ep dose sequence on coagulation efficiency
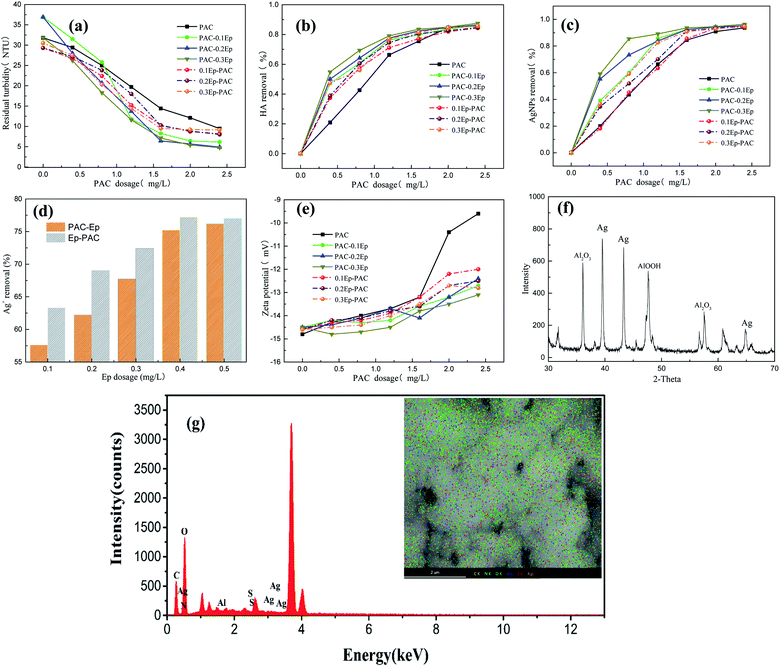
Pre-experiment optimized the dosage range of PAC (0.4–2.4 mg L−1) and Ep (0.1–0.3 mg L−1), and the effect of dose sequence on coagulation efficiency were presented in Fig. 2. As can be seen, distinctive camber curves of HA and AgNPs removal were obtained, which was mainly consist of effective coagulation region (HA, AgNPs and Ag+ removal dramatically improved) and re-stabilization region (coagulation efficiency reached a platform). The removal of HA and AgNPs could be obviously enhanced when Ep was added: AgNPs and HA removal efficiency could be over 80% when 0.3 mg L−1 Ep dosed after 1.2 mg L−1 PAC, which were about 20% higher than that of PAC used alone. Fig. 2 indicated that turbidity, HA and AgNPs removal efficiency of PAC–Ep was better than that of Ep–PAC. When PAC was dosed firstly, the negative charged AgNPs and HA could be neutralized by various polynuclear hydrolysis products of PAC, which weakened repulsive forces between AgNPs and HA colloids to form micro aggregates.19,20 Then Ep was added to connect the micro aggregates by bridging and absorption role due to its long carbon chains structure, which was in favor of gel network generation. The egg-box structure could enhance the precipitates aggregation and meanwhile swept unabsorbed AgNPs and HA,21 so larger flocs and better coagulation efficiency were obtained. If Ep was dosed firstly, it was difficult to form micro aggregates with HA due to its negative charges, and meanwhile the electrostatic repulsion made the coagulation system became more stable. As a kind of natural organic matter, Ep added the burden of PAC charge neutralization role.22 Fig. 2(e) also showed that zeta potential of Ep–PAC was higher than that of PAC–Ep, which also indicated that part of Ep may act as organic matter to be removed by PAC. However, the residual Ep could also play adsorption and bridge role after PAC adding, manifested as slightly improving of coagulation performance. To confirm above inference of coagulation mechanism, flocs were freeze-dried to conduct X-ray diffraction (XRD) and energy dispersive spectroscopy (EDS) measurement. Diffraction peak at 38.0b, 44.2b and 64.4b was observed, which represented the face-centered cubic crystals (111), (200), and (220) crystal faces belonging to silver, respectively (Fig. 2(f)).23 Simultaneously, homogeneous distribution of silver element was found in EDS mapping (Fig. S3†). This indication that AgNPs could be removed by adsorption effect. In addition, sulfur element, which come from sulfonic group of Ep (Fig. S4†) was found in EDS mapping, and Al2O3 and AlOOH were also exhibited in XRD image. This indicated the formation of gel network of PAC hydrolysates, HA and Ep molecules.In this study, about 7.5% AgNPs released Ag+ (0.377 mg L−1) to water sample, however the removal rate of Ag+ was only 39.0% when PAC used alone and the variation was little with PAC dosage increasing. Fig. 2(d) showed that Ag+ removal could be improved apparently by Ep addition regardless of dose sequence, but the removal rate of Ep–PAC was higher than that of PAC–Ep at lower PAC dosage. This should be attributed to the carboxylic acid group and the hydroxyl group of Ep (shown in Fig. S5†), which could promote the adsorb reaction with Ag+, therefore the removal exhibited better when Ep was added firstly.
3.2 Coagulation behavior in different pH conditions
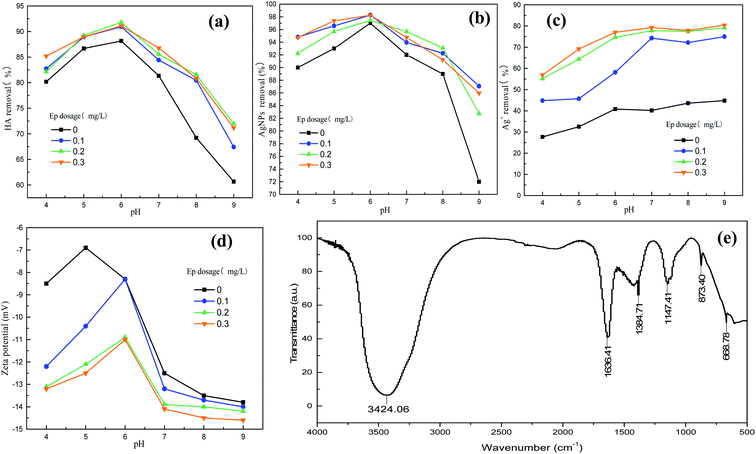
Ep (0.3 mg L−1) dosed after PAC (2.0 mg L−1) was selected as dual-coagulant, and coagulation in different solution pH conditions were carried out. Fig. 3 showed that the variation of HA and AgNPs removal exhibited a parabola shape and both achieved their maximum at pH 6.0 (97.4% and 91.8%). Coagulation efficiency of PAC–Ep showed a similar trend with that of PAC, but the addition of Ep contributed to the improvement of HA and AgNPs removal, which indicated that PAC played a leading role at pH range of 4.0–9.0. In strong acidic condition (pH 4.0), major hydrolysate of PAC was monomer aluminum, and high density of positive charges resulted in coagulation system re-stabilization. The hydrolyzed product could not aggregate easily, which lead to inferior HA and AgNPs removal. In weakly acidic conditions, Al(OH)k(3−k)+ were considered as major hydrolysate,24 which have strong adsorption bridging and sweeping action. They could adsorb the negatively charged HA and AgNPs, and then coprecipitate role occurred to form larger flocs with the help of Ep. During sedimentation process, the gel network could capture suspended AgNPs and Ag+, which further improved effluent quality. Therefore, the coagulation efficiency achieved best at pH 6.0. Fig. 3 also indicated that zeta potential achieved highest under weakly acidic conditions. In addition, compared with AgNPs suspensions, zeta potentials became less negative in the presence of coagulants, indicating that AgNPs and Ag+ removal was partly attributed to the charge neutralization role.25 IR spectra of AgNPs–HA flocs generated at pH 6.0 was shown in Fig. 3(f). The broad band at 3424 cm−1 was assigned to the stretching vibration of –O–H absorbed by flocs. Asymmetric C![[double bond, length as m-dash]](https://www.rsc.org/images/entities/char_e001.gif) O group of flocs stretched in the band of 1636 cm−1, while symmetric C
O group of flocs stretched in the band of 1636 cm−1, while symmetric C![[double bond, length as m-dash]](https://www.rsc.org/images/entities/char_e001.gif) O group stretched in the band of 1384 cm−1 due to the adsorption of AgNPs.26 The band at 1149 cm−1 was attributed to C–O stretching, indicating the presence of polysaccharide-like substances.27 In addition, signal at 848 cm−1 was assigned to the stretching vibration of C–O–S of sulfuric acid group in Ep, which further proved the reaction process among Ep and HA–AgNPs.
O group stretched in the band of 1384 cm−1 due to the adsorption of AgNPs.26 The band at 1149 cm−1 was attributed to C–O stretching, indicating the presence of polysaccharide-like substances.27 In addition, signal at 848 cm−1 was assigned to the stretching vibration of C–O–S of sulfuric acid group in Ep, which further proved the reaction process among Ep and HA–AgNPs.
When solution pH larger than 8, the primary form of Al was Al(OH)3 and Al(OH)4−.23 The weakened adsorption capacity to AgNPs resulted in deteriorated removal effect. However, Ag+ removal was not altered in alkaline condition. This should attribute to the initial concertation of Ag+, which was much lower than that in acidic condition. Based on the above analysis, pH 6.0 is preferred as the optimum coagulation pH for HA–AgNPs simulated water sample treated with PAC–Ep.
3.3 Factorial analysis
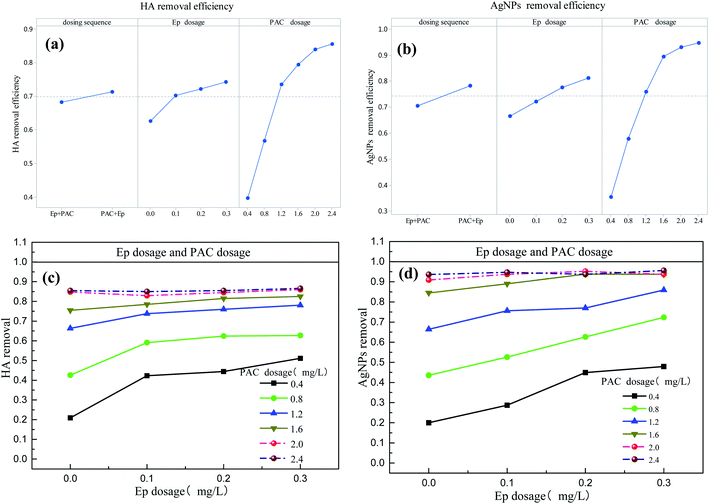
The main effects and interactions of four factors (dose sequence, PAC dosage, Ep dosage and solution pH) were studied by multi-level factorial analysis. Quantitative study in this section could identify the factors and their combinations with significant effects. Main effects of factors on coagulation effects were shown in Fig. 4 and S6.† As can be seen, PAC and Ep dosage increasing exhibited a positive effect on removal rate of HA and AgNPs. Compared with other factors, the slope of PAC dosage was the largest, indicating that PAC dosage had the greatest impact on coagulation efficiency. Table 1 showed that the contribution of Ep dosage to residual turbidity, HA removal and AgNPs removal was 4.80%, 6.21% and 5.62%, respectively, suggesting that coagulation efficiency could be improved due to macromolecular structure of Ep. However, dose sequence exhibited little effects on coagulation efficiency, and HA and AgNPs removal were slightly higher when PAC dosed before Ep.| Residual turbidity | HA removal | AgNPs removal | |
|---|---|---|---|
| Dosing sequence | 0.81% | 0.77% | 2.70% |
| Ep dosage | 4.80% | 6.21% | 5.62% |
| PAC dosage | 90.86% | 86.34% | 84.11% |
| Dosing sequence × Ep dosage | 0.68% | 0.26% | 0.91% |
| Dosing sequence × PAC dosage | 0.69% | 0.39% | 1.96% |
| Ep dosage × PAC dosage | 1.54% | 5.65% | 3.66% |
| Dosing sequence × Ep dosage × PAC dosage dosage | 0.63% | 0.39% | 1.04% |
Fig. 4 also showed the interaction effects of dose sequence, PAC dosage, and Ep dosage on coagulation efficiency. The different color lines of Fig. 4(c) showed the response process of Ep dosage to HA removal, and the unparallel lines indicated that the effect of Ep dose on HA removal was influenced by PAC dosages. In Fig. 4(c), all the six lines of PAC dosage went up at different rates when Ep dosage increases across its low, medium, and high levels. Whereas the two dashed lines (representing the high level of PAC dosage) increased slower than the other four, implying an interaction between this pair of factors.28 The interaction is significant when PAC dosage increases from 0.8 to 1.2 mg L−1 and the Ep dosage increases from 0 to 0.1 mg L−1, as the lines go up at different rates significantly. Table 1 also showed that the interaction between Ep dosage and PAC dosage was significant, since HA could be neutralized by PAC hydrolysis to form micro aggregates, and Ep addition could connect them by bridging role. Similarly, the main and interaction effect of Ep dosage and solution pH were analyzed in this section. Table 2 indicated that solution pH had a great influence on residual turbidity, HA and AgNPs removal. A notable phenomenon is that Ag+ removal efficiency is more sensitive to Ep dosage (69.13%). Compared with other indicators, the response of Ag+ removal to solution pH is different, which should attribute to its removal mechanism of Ep adsorption. The interaction of Ep dosage and solution pH varied with different response indicators, indicating that solution pH had a certain effect on the aid role of Ep.
| Residual turbidity | HA removal | AgNPs removal | Ag+ removal | |
|---|---|---|---|---|
| Ep dosage | 7.52% | 9.73% | 12.51% | 69.13% |
| Solution pH | 84.02% | 85.76% | 76.56% | 27.12% |
| Ep dosage × solution pH | 8.46% | 4.51% | 10.93% | 3.75% |
3.4 Effect of Ep dose method on coagulation kinetics
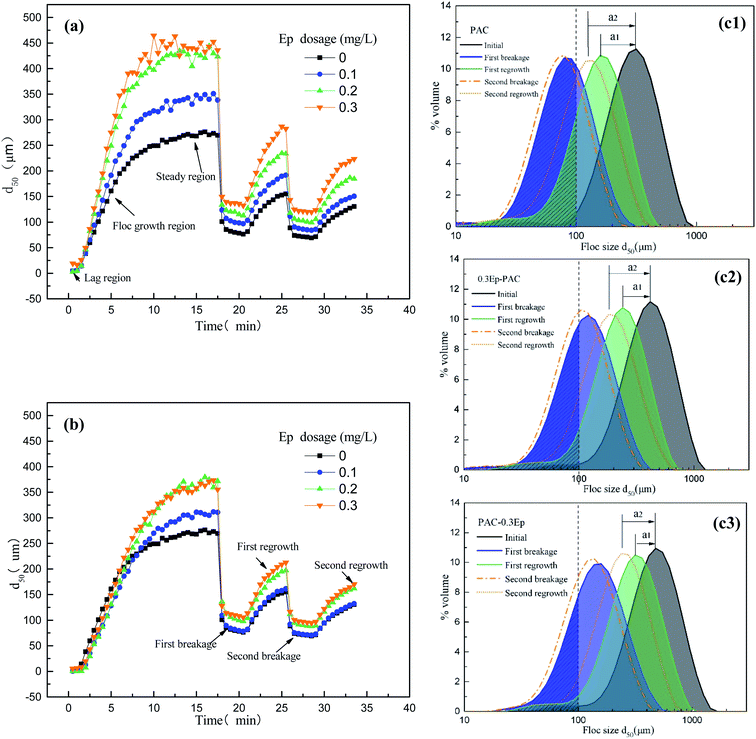
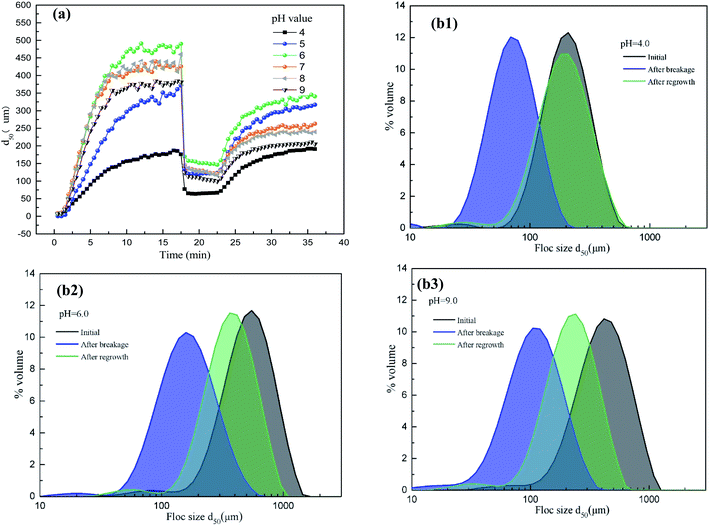
Coagulation kinetics were studied in terms of flocs size, Gr, Sf and Rf when PAC–Ep and Ep–PAC was used. PAC dosage was constant at 2.0 mg L−1, and the variation curves of flocs growth, breakage and regrowth were presented in Fig. 5. As can be seen, flocs grew rapidly once coagulant was dosed and then enter into stable phase.29 Afterwards, shear force was introduced for 5 min, which resulted in sharp reducing of flocs sizes. However, flocs began to regrow as shear force disappeared, but could not recover to previous sizes. When Ep was used, flocs sizes was much larger than that of PAC used alone, especially when Ep was dosed firstly. Particle size distribution of flocs showed that the volume of flocs with sizes smaller than 100 μm decreased significantly (Fig. 5). This is a great advantage since smaller particles always settle down more slowly and result in inferior flocculation efficiency. In addition, flocs sizes were enlarged with Ep dosage increasing, but excessive Ep could not enlarge flocs sizes in further. Floc formation process was consisted of lag region, growth region and steady state region. Table 3 showed that lag time of PAC–Ep was the shortest, followed by PAC and Ep–PAC, which indicated that charge neutralization effect of PAC will be weakened if Ep was dosed before PAC. For growth region, the time required for equilibrium became shorter when Ep was added and the largest growth rate was found when PAC–0.3Ep was applied. Therefore, the polymer bridging effect may function better when Ep was added before PAC than the revers dose sequence.Sf and Rf were discussed in this section since breakage was unavoidable in practical water treatment process. Table 3 showed that Sf and Rf of AgNPs–HA flocs formed by PAC–Ep and Ep–PAC were both increased with Ep dosage increasing. The adsorption and bridging effect of Ep could assist micro-flocs aggregation, which lead to larger flocs and strength factor.30 Table 3 indicated that strength and regrowth ability of flocs were significantly affected by dosing sequence of PAC and Ep, especially for Rf values. This indicated that Ep showed an ability of promoting broken flocs to re-aggregation when dosed after PAC. The reason for this phenomenon was mainly included two aspects: (1) the structure attraction and van der Waals on newly exposed flocs surface could bond floc fragments together by Ep addition; (2) unsaturated functional group in Ep could enhance the charged particle's adsorption effect. Fig. 5 also showed that the peak after regrowth showed an apparent shift to initial peak when PAC–Ep was used, indicating better recovery ability of flocs. However, the distance of “a” was much longer when PAC and Ep–PAC was used (Fig. 5), which is in accordance with the calculation conclusion in Table 3.
| Coagulant | PAC | PAC–Ep | Ep–PAC | ||||
|---|---|---|---|---|---|---|---|
| Dosage (mg L) | 2 | 0.1 | 0.2 | 0.3 | 0.1 | 0.2 | 0.3 |
| Lag time (s) | 90 | 90 | 60 | 60 | 90 | 120 | 120 |
| Growth time (min) | 13.5 | 11.5 | 10.5 | 10 | 13.5 | 14 | 14 |
| Floc size (μm) | 268 | 349 | 435 | 452 | 310 | 363 | 379 |
| Growth rate (μm s−1) | 19.8 | 30.3 | 41.4 | 45.2 | 23.0 | 25.9 | 27.1 |
| First Sf (%) | 27.7 | 29.0 | 28.4 | 31.1 | 25.5 | 28.2 | 28.9 |
| Second Rf (%) | 24.1 | 25.4 | 25.8 | 27.4 | 23.3 | 24.9 | 25.8 |
| First Rf (%) | 37.4 | 38.9 | 39.5 | 50.4 | 35.3 | 37.5 | 39.5 |
| Second Rf (%) | 23.2 | 23.7 | 24.3 | 29.2 | 22.8 | 23.9 | 24.0 |
3.5 Coagulation kinetics in different pH conditions
The sizes variations of flocs formed in different pH conditions were shown in Fig. 6, and corresponding parameters were calculated and listed in Table 4. The equilibrium sizes of AgNPs–HA flocs increased initially and then decreased gradually as pH increasing, and achieved the largest at pH 6.0. In general, charge neutralization occurs at low pH values while adsorption effect appeared at high pH values with hydroxide precipitation.28 Therefore, AgNPs–HA could aggregate faster as pH increasing due to the enhanced hydrolysis of Al(III) species. However, zeta potential of AgNPs–HA coagulation system became relatively low when pH value larger than 8, and the repulsive potential between flocs was enhanced, which prevented microflocs aggregation. Therefore, flocs with larger equilibrium sizes was difficult to form in alkaline conditions.| pH | 4 | 5 | 6 | 7 | 8 | 9 |
|---|---|---|---|---|---|---|
| Floc size (μm) | 173 | 320 | 488 | 432 | 428 | 380 |
| Growth time (min) | 8 | 12 | 8 | 8 | 8 | 9 |
| Growth rate (μm min−1) | 21.6 | 26.7 | 61.0 | 54.0 | 53.5 | 42.2 |
| Sf (%) | 36.9 | 35.4 | 30.2 | 28.5 | 27.3 | 26.5 |
| Rf (%) | 99.2 | 86.3 | 57.6 | 46.8 | 39.8 | 38.5 |
Sf and Rf of AgNPs–HA flocs decreased gradually with pH increasing, which indicated that the shear resistance and recovery ability of flocs were better in acidic conditions. This should be attributed to the complexation of HA molecules with hydrolysates of PAC coagulants.31 In alkaline conditions, larger flocs always generated by the adsorption bridge and net trapping role of PAC, which resulted in loose and branch structure with lower anti-shear ability. For recovery performance of AgNPs–HA flocs, higher Rf value was obtained in acidic conditions. The exposed surface also carries some positive charges after flocs broken, so the flocs could be recovered quickly. “a1” and “a2” in Fig. 6 represented the ability of flocs anti-shearing and regrowth. Generally, longer a1 and a2 distance indicated inferior floc strength and recoverability. Fig. 6 showed that a2 was the shortest when solution pH was 6.0, which indicated best recovery ability of flocs. However, the distance was much longer when pH was 9.0.
Floc structure in different pH conditions was described by Df in this section. Generally, flocs with open structure have low Df value, while high Df data indicate more compact structure.30 Fig. 7 showed that Df value of AgNPs–HA flocs achieved 2.50 at pH 6.0, while only 2.06 was obtained when solution pH was 9.0. This indicated that flocs with loose structure generated in alkaline conditions, since flocs mainly formed by bridging and sweeping mechanism. In addition, there is a certain of electrostatic repulsion since negative charges could not be neutralized effectively. Therefore, porous and fluffy flocs with lower Df value was obtained in alkaline conditions. SEM images of flocs generated by PAC–Ep at pH 6.0 and 9.0 were measured to confirms this point. As can be seen, AgNPs–HA flocs generated at pH 9.0 exhibit higher porosity and loose surface morphology than that formed at pH 6.0, which was in accordance with Df values.
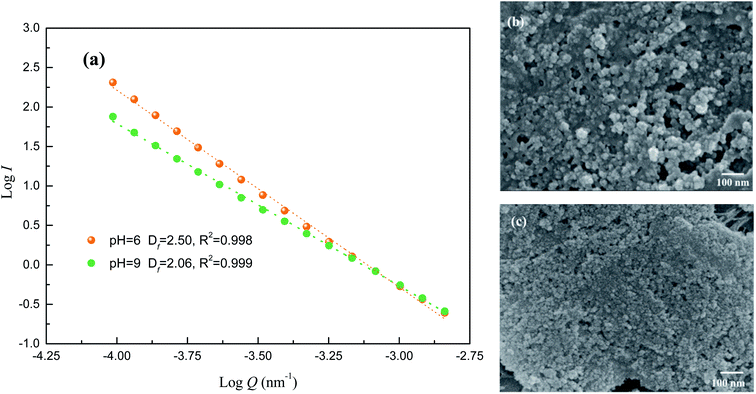 | ||
| Fig. 7 Structure analysis of floc generated in acidic and alkaline conditions: (a) Df of flocs; (b) SEM image of flocs at pH 9.0; (c) SEM image of flocs at pH 6.0. | ||
4. Conclusion
(1) AgNPs could be removed effectively with Ep addition. Coagulation efficiency exhibited higher when Ep was applied 30 s after PAC dosing, and achieved maximum at solution pH 6.0.(2) Flocs sizes and growth rate achieved the highest when PAC–Ep was used, followed by Ep–PAC and PAC alone.
(3) Flocs with larger sizes, denser structure, higher strength and better recovery ability were obtained in acid conditions.
(4) Interaction effects of PAC–Ep dose sequence, dosage and solution pH were significant. PAC dosage had the greatest impact on HA and AgNPs removal, while Ag+ removal was more sensitive to Ep dose.
Conflicts of interest
There are no conflicts to declare.Acknowledgements
This work was supported by National Natural Science Foundation of China (No. 51908256), Natural Science Foundation Youth Program of Jiangsu (BK20170238) and Natural Science Research Project of Jiangsu Universities (17KJD610004). The kind suggestions from the anonymous reviewers are highly appreciated.References
- T. M. Tolaymat, A. M. El Badawy, A. Genaidy, K. G. Scheckel, T. P. Luxton and M. Suidan, Sci. Total Environ., 2010, 408, 999–1006 CrossRef CAS PubMed.
- Q. Zheng, M. Zhou, W. Deng and X. Chris Le, J. Environ. Sci., 2015, 34, 259–262 CrossRef CAS PubMed.
- Y. Liu, M. Tourbin, S. Lachaize and P. Guiraud, Powder Technol., 2014, 255, 149–156 CrossRef CAS.
- G. Maiorano, S. Sabella, B. Sorce, V. Brunetti, M. A. Malvindi, R. Cingolani and P. P. Pompa, ACS Nano, 2010, 4, 7481–7491 CrossRef CAS PubMed.
- O. Choi and Z. Hu, Environ. Sci. Technol., 2008, 42, 4583–4588 CrossRef CAS PubMed.
- J. K. Schluesener and H. J. Schluesener, Arch. Toxicol., 2013, 87, 569–576 CrossRef CAS PubMed.
- Y. Wang, N. Xue, Y. Chu, Y. Sun, H. Yan and Q. Han, Desalination, 2015, 367, 265–271 CrossRef CAS.
- Z. Wang, J. Li, J. Zhao and B. Xing, Environ. Sci. Technol., 2011, 45, 6032–6040 CrossRef CAS PubMed.
- E. H. Jones and C. Su, Water Res., 2012, 46, 2445–2456 CrossRef CAS PubMed.
- Q. Sun, Y. Li, T. Tang, Z. Yuan and C.-P. Yu, J. Hazard. Mater., 2013, 261, 414–420 CrossRef CAS PubMed.
- K. Folens, S. Huysman, S. V. Hulle and G. D. Laing, Sep. Purif. Technol., 2017, 179, 145–151 CrossRef CAS.
- S. Raungsomboon, A. Chidthaisong, B. Bunnag, D. Inthorn and N. W. Harvey, Water Res., 2006, 40, 3759–3766 CrossRef CAS PubMed.
- X. Liu, M. Wazne, Y. Han, C. Christodoulatos and K. L. Jasinkiewicz, J. Colloid Interface Sci., 2010, 348, 101–107 CrossRef CAS PubMed.
- Y. Yu, Y. Li, C. Du, H. Mou and P. Wang, Carbohydr. Polym., 2017, 165, 221–228 CrossRef CAS PubMed.
- J. Xu, L.-L. Xu, Q.-W. Zhou, S.-X. Hao, T. Zhou and H.-J. Xie, Int. J. Biol. Macromol., 2015, 81, 1026–1030 CrossRef CAS PubMed.
- Y. Li, W. Li, G. Zhang, X. Lü, H. Hwang, W. G. Aker, H. Guan and P. Wang, Int. J. Biol. Macromol., 2016, 86, 96–104 CrossRef CAS PubMed.
- M. M. Storelli, A. Storelli and G. O. Marcotrigiano, Environ. Int., 2001, 26, 505–509 CrossRef CAS PubMed.
- F. Piccapietra, L. Sigg and R. Behra, Environ. Sci. Technol., 2012, 46, 818–825 CrossRef CAS PubMed.
- E. B. Simsek, B. Aytas, D. Duranoglu, U. Beker and A. W. Trochimczuk, Desalin. Water Treat., 2017, 57, 9940–9956 CrossRef.
- J. Liu and R. H. Hurt, Environ. Sci. Technol., 2010, 44, 2169–2175 CrossRef CAS PubMed.
- W. Yu, J. Gregory and L. C. Campos, Water Res., 2010, 44, 3959–3965 CrossRef CAS PubMed.
- C. Wu, Y. Wang, B. Gao, Y. Zhao and Q. Yue, Sep. Purif. Technol., 2012, 95, 180–187 CrossRef CAS.
- D. Rajesh and C. S. Sunandana, Appl. Surf. Sci., 2012, 259, 276–282 CrossRef CAS.
- X. Bo, B. Gao, N. Peng, Y. Wang, Q. Yue and Y. Zhao, Chem. Eng. J., 2011, 173, 400–406 CrossRef CAS.
- W. Xu, B. Gao, Q. Yue and Y. Wang, Water Res., 2010, 44, 1893–1899 CrossRef CAS PubMed.
- X. Huang, B. Gao, Y. Sun, Q. Yue, Y. Wang, Q. Li and X. Xu, Sep. Purif. Technol., 2017, 173, 209–217 CrossRef CAS.
- M. B. Hay and S. C. B. Myneni, Geochim. Cosmochim. Acta, 2007, 71, 3518–3532 CrossRef CAS.
- S. Wang and G. H. Huang, Eur. J. Oper. Res., 2015, 240, 572–581 CrossRef.
- J. Zhang, J. Dai, R. Wang, F. Li and W. Wang, Colloids Surf., A, 2009, 335, 194–201 CrossRef CAS.
- R. Mao, Y. Wang, B. Zhang, W. Xu, M. Dong and B. Gao, Desalination, 2013, 314, 161–168 CrossRef CAS.
- T. Li, Z. Zhu, D. Wang, C. Yao and H. Tang, Powder Technol., 2006, 168, 104–110 CrossRef CAS.
Footnote |
| † Electronic supplementary information (ESI) available. See DOI: 10.1039/c9ra08206a |
| This journal is © The Royal Society of Chemistry 2019 |


