 Open Access Article
Syntheses, characterization and properties of three coordination polymers with interpenetrating structures comprising 4,4′-(1H-1,2,4-triazol-1-yl)methylene-bis(benzonic acid)†
Lun Zhao *,
Lingshu Meng,
Xin Liu,
Guanlin Guo,
Congcong Xiao and
Haibing Liu
College of Chemistry, Changchun Normal University, Changchun, 130032, Jilin, P. R. China. E-mail: zhaolun7511@126.com; Tel: +86-431-86168903
First published on 4th December 2019
Abstract
Three new coordination polymers (CPs), {[Pb(tmdb)](H2O)}n (1), {[Zn(tmdb)(bimb)0.5]}n (2) and {[Zn3(tmdb)3(bpmb)1.5](H2O)6}n (3) (H2tmdb = 4,4′-(1H-1,2,4-triazol-1-yl)methylene-bis(benzonic acid), where bpmb = 1,4-bis(pyridin-4-ylmethoxy)benzene and bimb = 1,4-bis(imidazoly-1-yl)benzene), have been solvothermally or hydrothermally synthesized. Compound 1 is a 2D network with the point symbol (4·6·8)(4·62) and compound 2 is a 4-fold interpenetrating 3D network with spiral chains. The topological type of 2 is dmc (topos&RCSR.ttd) with the point symbol (4·82)(4·85). Compound 3 is a 3-fold interpenetrating 3D network with the point symbol (63)2(8·65)2(10·62)(8·10·64). The electrochemiluminescence (ECL) behaviors of 2 and 3 were studied. The applications of CP 2 and 3 in detecting ions were explored, and the results show that they can be used as fluorescent probes to selectively detect and identify Fe3+ ions in water. In addition, the applications of CP 2 and 3 in the adsorption and separation of dyes were researched. Furthermore, the gas adsorption of 3 was studied.
Introduction
In recent years, metal–organic coordination polymers have been rapidly developed due to their potential applications in gas separation and storage, catalysis, photoluminescence, magnetism, and drug release, but in their self-assembly process, they are subject to organic linkers, reaction temperatures and times, and solvents. They are influenced by the system, pH value, metal ions, and so on.1 Due to their molecular size, symmetry, coordination mode and functional groups, organic ligands, which are directly related to the structure and application of CPs, play a very important role in the construction process. At present, the most common combinations are as follows: (a) single ligand, carboxylic acid or nitrogen-containing, or thiazole; (b) homogeneous mixture, carboxylic acid and carboxylic acid, imidazole and imidazole; (c) two types of mixing, a carboxylic acid and a nitrogen-containing ligand. In particular, the third type has become the focus of current researchers and has achieved great success.However, scientists are not satisfied with the status quo and are focusing on bifunctional mixed-tooth ligands with abundant coordination patterns and potential active sites. For example, Bharadwaj and colleagues selected a ligand 4-(1H-imidazole-1-yl)benzoic acid (HIBA) with an imidazole/benzimidazole and a carboxylate donor at the end to explore the transition metal (Cd, Cu, Zn) structure of the compound.2 Yu and his group used the ligand [3,5-di(4H-1,2,4-triazol-4-yl)benzoato] to explore the formation of nitrate, chloride and sulfate with metallic cobalt.3 Mao and colleagues used five pre-designed synthetic bifunctional mixed ligands, 4-{bis(4-benzoic)amino}-4H-1,2,4-triazole, to form five new CPs, and the luminescence or magnetic properties of the compounds were studied accordingly.4 Among the compounds constructed from the above bifunctional mixed-tooth ligands, only the bifunctional mixed-tooth ligands and the solvent molecules participate in the coordination, and they do not contain the second organic ligand. However, Zheng and his group utilized the N-center polydentate pyridine-carboxylate bifunctional ligand 4,4′-((4-(pyridin-4-yl)phenyl)azanediyl)dibenzoic acid, with different contents. Nitrogen ligands construct a compound of metallic Co and Zn, which can be used for the gas separation of CO2 and CH4.5
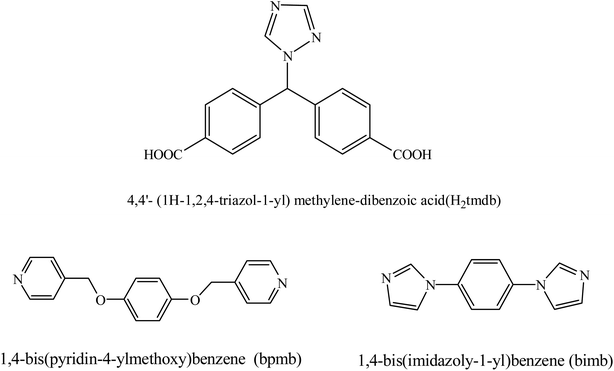
In addition, mixed-ligand CPs have become an important type of CP because they can incorporate more types of organic ligands into a single unique framework, which may deliver some new functions derived from organic ligands.6,7 The combination of nitrogen donor ligands and aromatic carboxylate has been proven to be an effective and useful strategy for constructing diverse mixed-ligand CPs.8 However, the incorporation of an N-containing carboxylate and carboxylate into a unique framework has been relatively less explored. To the best of our knowledge, multifunctional ligands have been extensively investigated owing to their versatile coordination modes and potential as hydrogen bond donors and acceptors.9 Here, the 4,4′-(1H-1,2,4-triazol-1-yl)methylene-bis(benzonic acid) (H2tmdb) ligand (Scheme 1) was chosen as the linker, for the following reasons: a flexible carboxyphenyl and a rigid triazolyl group can provide multidentate metal-binding sites and diverse coordination modes; the variable coordination modes of the ligands;10,11 ligands with difunctional groups. Moreover, the design and selection of organic ligands is of crucial concern in the construction of MOFs, because their molecular size, symmetry, coordination mode and functional groups are directly correlated with the architectures and applications of the MOFs.
In this article, we chose a bifunctional semi-rigid triple-ligand H2tmdb containing two flexible carboxyphenyl groups and a rigid triazolyl group as the main building block, and several metal–organic framework materials were prepared with transition metals and secondary nitrogen-containing ligands in hydrothermal/solvothermal conditions (Scheme 1). Their structures were determined by X-ray single crystal diffraction, and their properties were characterized by thermogravimetry, powder X-ray diffraction (PXRD) and fluorescence, etc.
Experimental section
Materials and methods
All solvents and reagents for synthesis were of reagent grade quality, bought from commercial sources and used as received. PXRD patterns were collected on a D2 PHASER A26-X1 XRD diffractometer. The IR spectra (4000–400 cm−1) were obtained from KBr pellets with an FTIR Nexus spectrophotometer. Elemental analyses were performed on a PerkinElmer 240 C analyzer. Thermogravimetric analysis (TGA) curves were measured under air atmosphere at a heating rate of 10 °C min−1 on a PerkinElmer TG-7 thermal analyzer. The fluorescence spectra were recorded on a HITACHI F-7000 Spectrometer.12 ECL signals were monitored and recorded by an MPI-B ECL analyzer (Xi'an Remax Electronic Science and Technology Co. Ltd, Xi'an, China, with the voltage of the photomultiplier tube set at 600 V and the potential scan from −0.8 to 0.8 V at a scanning rate of 0.1 V s−1. UV-vis adsorption spectra were collected on a Cary 300 spectrophotometer. CO2 and CH4 adsorption measurements (up to 1 bar) were carried out on an Autosorb-3.0 (Quantachrome) volumetric analyzer.13Synthesis of {[Pb(tmdb)](H2O)}n (1)
A mixture of Pb(NO3)2·6H2O (33.1 mg, 0.1 mmol) and H2tmdb (32.3 mg, 0.1 mmol), was dissolved in 10 mL of H2O solvent. After stirring, the mixture was sealed in a 25 mL Parr Teflon-lined stainless steel autoclave under autogenous pressure and heated at 160 °C for 72 h. Then after slow cooling to room temperature at 20 °C h−1, large quantities of colorless bulk crystals were obtained and the crystals were filtered off, washed with absolute ethyl alcohol, and dried under ambient conditions. The yield of the reaction was 56% based on H2tmdb. Elemental analysis calcd for C17H11N3O5Pb (%): C, 38.01; H, 2.11; N, 7.65. Found: C, 37.50; H, 2.04; N, 7.72. FT-IR (4000–400 cm−1): 3231(s), 2926(s), 1654(m), 1540(m), 1391(w), 1273(m), 1133(m), 1007(s), 963(s), 835(s), 777(m), 644(s), 531(s), 496(s).Synthesis of {[Zn(tmdb)(bimb)0.5]}n (2)
A mixture of Zn(NO3)2·6H2O (29.7 mg, 0.1 mmol), H2tmdb (32.3 mg, 0.1 mmol), and bimb (21.1 mg, 0.1 mmol), was dissolved in 10 mL of H2O solvent. After stirring, the mixture was sealed in a 25 mL Parr Teflon-lined stainless steel autoclave under autogenous pressure and heated at 160 °C for 72 h. Then after slow cooling to room temperature at 20 °C h−1, large quantities of colorless bulk crystals were obtained and the crystals were filtered off, washed with absolute ethyl alcohol, and dried under ambient conditions. The yield of the reaction was 62% based on H2tmdb. Elemental analysis calcd for C23H15N5O4Zn (%): C, 56.19; H, 3.12; N, 14.21. Found: C, 56.28; H, 3.08; N, 14.27. FT-IR (4000–400 cm−1): 3438(s), 3102(s), 1608(w), 1527(m), 1374(w), 1135(m), 1074(m), 994(s), 964(s), 837(m), 774(w), 650(m), 542(s).Synthesis of {[Zn3(tmdb)3(bpmb)1.5](H2O)6}n (3)
A mixture of Zn(NO3)2·6H2O (29.7 mg, 0.1 mmol), H2tmdb (32.3 mg, 0.1 mmol), and bpmb (29.6 mg, 0.1 mmol), was dissolved in 10 mL of DMF–H2O (with a volume ratio of 8![[thin space (1/6-em)]](https://www.rsc.org/images/entities/char_2009.gif) :
:![[thin space (1/6-em)]](https://www.rsc.org/images/entities/char_2009.gif) 2) mixed solvent. After stirring, the mixture was sealed in a 25 mL Parr Teflon-lined stainless steel autoclave under autogenous pressure and heated at 80 °C for 72 h. Then after slow cooling to room temperature at 20 °C h−1, large quantities of colorless bulk crystals were obtained and the crystals were filtered off, washed with absolute ethyl alcohol, and dried under ambient conditions. The yield of the reaction was 60% based on H2tmdb. Elemental analysis calcd for C78H57Zn3N12O15 (%): C, 58.53; H, 3.65; N, 10.54. Found: C, 58.60; H, 3.59; N, 10.51. FT-IR (4000–400 cm−1): 3425(s), 3120(s), 1609(w), 1506(m), 1378(w), 1228(m), 1134(m), 1018(s), 997(s), 826(m), 773(m), 650(s), 574(s), 491(s).
2) mixed solvent. After stirring, the mixture was sealed in a 25 mL Parr Teflon-lined stainless steel autoclave under autogenous pressure and heated at 80 °C for 72 h. Then after slow cooling to room temperature at 20 °C h−1, large quantities of colorless bulk crystals were obtained and the crystals were filtered off, washed with absolute ethyl alcohol, and dried under ambient conditions. The yield of the reaction was 60% based on H2tmdb. Elemental analysis calcd for C78H57Zn3N12O15 (%): C, 58.53; H, 3.65; N, 10.54. Found: C, 58.60; H, 3.59; N, 10.51. FT-IR (4000–400 cm−1): 3425(s), 3120(s), 1609(w), 1506(m), 1378(w), 1228(m), 1134(m), 1018(s), 997(s), 826(m), 773(m), 650(s), 574(s), 491(s).
Crystallographic data collection and refinement
Single crystals of suitable size were placed on a Bruker SMART APEXIICCD diffractometer, and the incident light source was provided by Mo Kα rays (λ = 0.71073 Å) monochromated by a graphite monochromator, and the diffraction point was collected at 296 K in ω scan mode. Absorption correction was performed using the SAINT and SADABS procedures, and all the crystal structures were solved by the direct method using SHELXS-97.14 All non-H atoms were anisotropically processed. The measured crystallographic data are shown in Table S1.† Selected bond lengths and angles are listed in Table S2 (in the ESI†).Results and discussion
Crystal structure of (1)
Compound 1 crystallized in a monoclinic space group C2/c, and it contains one independent Pb(II) cation, one tmdb2− ligand and one free H2O molecule (Fig. 1a). In asymmetrical structural units, the Pb(II) ion is four-connected by three oxygen atoms of the tmdb2− ligands and one N atom of the tmdb2− ligands, showing a plane tetrahedral geometry.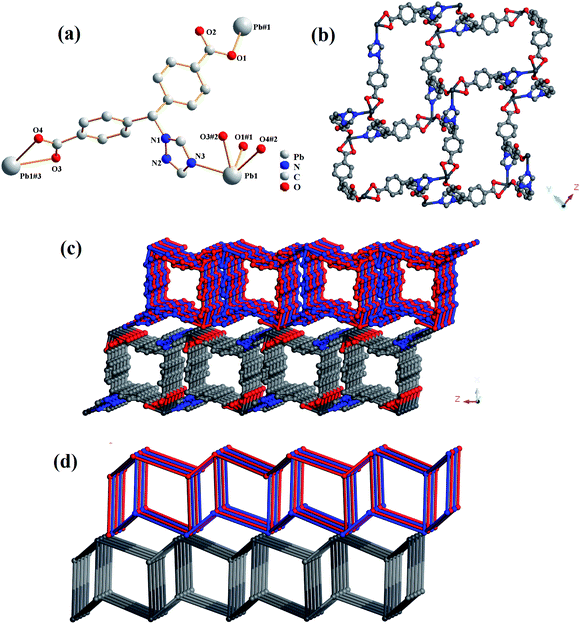 | ||
| Fig. 1 (a) The coordination environment for Pb(II) in 1. (b) 2D layered structure of 1. (c) Double layered structure of 1. (d) 3D network topology representation of 1. | ||
Two carboxyl groups of the tmdb2− are bridged to the Pb(II) ion by monodentate and bidentate coordination, respectively. The distances between the Pb–O and the Pb–N bonds range from 2.355(2) to 2.553(2) Å and 2.568(3) Å, respectively. As shown in Fig. 1c, the Pb ion is bonded to the carboxylic acid ligand tmdb2−, and a 2D skeleton structure with double interspersion is formed. The tmdb2− ligand is regarded as a 3-connected node, the metal center is regarded as a 3-connected node, and the topological structure with the point symbol (4·6·8)(4·62) of compound 1 is as shown in Fig. 1d.
Crystal structure of (2)
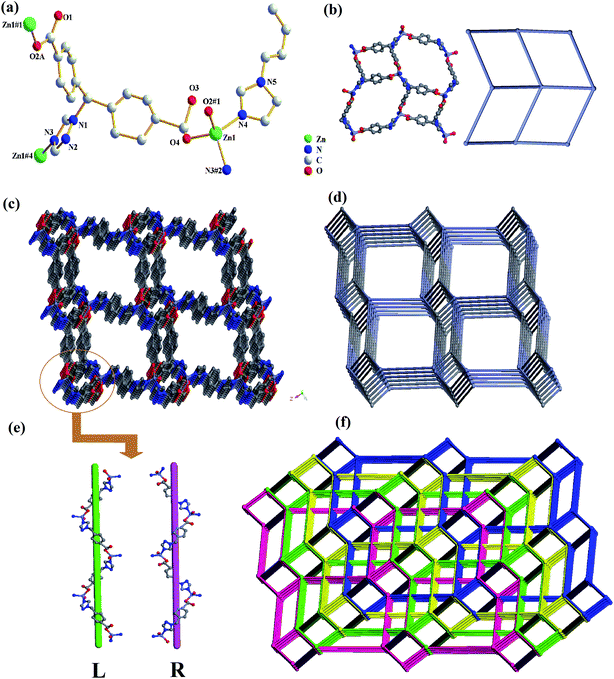
Compound 2 crystallized in a monoclinic space group P21/c, and contains one independent Zn(II) cation, one tmdb2− ligand and half a bimb ligand (Fig. 2a). In asymmetrical structural units, the Zn(II) ion is four-connected by two oxygen atoms of the tmdb2− ligands and two N atoms of the tmdb2− ligands and bimb ligands, showing a plane tetrahedral geometry. Only one carboxyl group of the tmdb2− is bridged with an Zn(II) ion by monodentate coordination. The distances between the Zn–O and Zn–N bonds range from 1.948(7) to 1.984(9) Å and from 2.005(6) to 2.029(7) Å, respectively.As shown in Fig. 2b, the carboxyl group and imidazole of the carboxylic acid tmdb2− are respectively bonded to adjacent Zn(II) ions to form a 2D layer. Then the structure is joined by a nitrogen-containing ligand bimb to form a 3D supramolecular network structure (Fig. 2c). The tmdb2− ligand is regarded as a 3-connected node, and the metal center is regarded as a 4-connected node (Fig. 2d). The topological type of 2 is dmc (topos&RCSR.ttd) with the point symbol (4·82)(4·85). Due to the singularity of the spatial network structure, the four identical 3D network structures are interspersed with each other to form a quadruple-penetrating mesh structure (Fig. 2f). Furthermore, there are two interlaced left or right handed double helical chains (labeled L and R) in this frame, and two 1D chains are formed by [–Zn tmdb–] (Fig. 2e).
Crystal structure of (3)
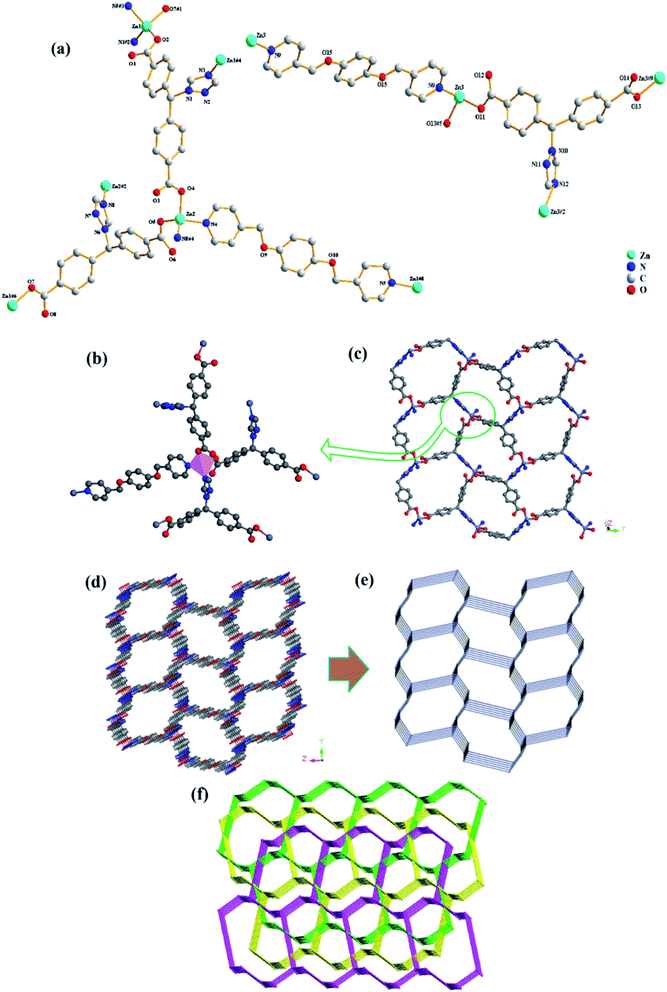
Compound 3 crystallized in a monoclinic space group P21/c, and it contains three independent Zn(II) cations, three tmdb2− ligands, one and a half bpmb ligands and six free H2O molecules (Fig. 3a). In asymmetrical structural units, three Zn(II) ions are four-connected by two oxygen atoms of the tmdb2− ligands and two N atoms of the tmdb2− ligands and bimb ligands, showing a plane tetrahedral geometry (Fig. 3b).Only one carboxyl group of the tmdb2− is bridged with Zn(II) ion by monodentate coordination. The distances between Zn–O bonds and Zn–N bonds range from 1.903(10) to 1.970(10) Å and from 1.977(12) to 2.027(14) Å, respectively. The carboxyl group and imidazole of the carboxylic acid tmdb2− are respectively bonded to adjacent Zn(II) ions to form a 2D layer by inverting the connection (Fig. 3c). Then the structure is joined by a nitrogen-containing ligand bimb to form a 3D supramolecular network structure (Fig. 3d). The tmdb2− ligand is regarded as a 3-connected node, the metal center is regarded as a 4-connected node, and the topological structure with the point symbol (63)(8·65)(63)(8·65)(10·62)(8·10·64) of compound 3 is as shown in Fig. 3e. According to the analysis, the two identical 3D network structures are interspersed with each other to form a double interspersed network structure, then another inverted 3D network structure interspersed with each other to form a triple-penetrating mesh structure (Fig. 3f).
PXRD and thermogravimetric analysis (TGA)
The PXRD patterns of the experimental data 1–3 were in good agreement with the corresponding simulated ones, illustrating the purity of compounds 1–3 (ESI, Fig. S1–S3†).TGA experiments were performed from 20 to 800 °C with a heating rate of 10 °C min−1 under air atmosphere to evaluate the thermal stabilities of the three compounds (ESI, Fig. S4†). For 1, the weight loss of the first stage was attributed to the release of free H2O molecules in the range of 25–150 °C (obsd 2.76%, calcd 3.30%). Then it continuously lost weight due to the collapse of the frameworks. The final residue was PbO (obsd 40.96%, calcd 38.12%). For 2, between 25 and 360 °C there was a slow weight loss. Then it continuously lost weight after 360 °C, probably due to the thermal decomposition of the ligand bimb and the collapse of the frameworks. The framework was stable up to ca. 530 °C. The remaining weight corresponds to the formation of ZnO (obsd 17.27%, calcd 16.58%). For 3, at 280 °C there was a slow weight loss, then a drastic fall, probably due to the thermal decomposition of the ligand bimb and the collapse of the frameworks. The final residue was ZnO (obsd 13.62%, calcd 15.27%).
Photoluminescence properties of 2 and 3
The luminescence properties of compounds 2, 3, H2tmdb and bimb were measured at room temperature, and the resulting spectra are shown in Fig. 4. Compound 2 had an emission peak at 420 nm (λex = 317 nm), 3 had a maximum emission peak at 451 nm (λex = 367 nm), and that of ligand bimb was at 400 nm (λex = 335 nm), and that of ligand H2tmdb was at 432 nm (λex = 338 nm). The central metals of 2 and 3 were Zn2+ ions, and the outermost electron arrangement was a stable d10 configuration, which was not easily oxidized and reduced in the framework.15 Their excitation wavelength and emission wavelength are similar to those of ligand H2tmdb, indicating that their luminescence comes mainly from the ligand H2tmdb, and belongs to the electronic transition emission of π* → π between ligands. Compared with the emission of the ligand H2tmdb, significant blue shifts were observed for 2, which might be assigned to ligands coordinated with Zn(II).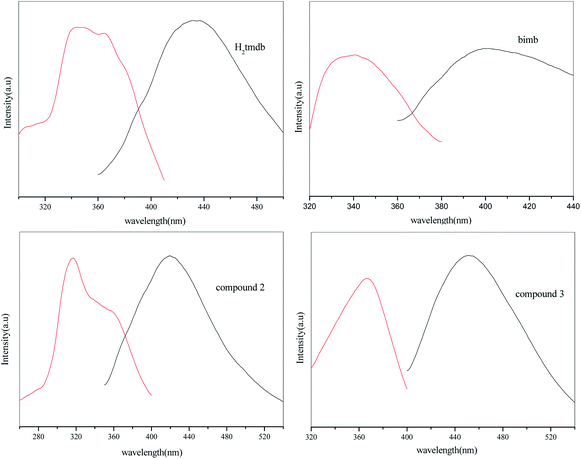 | ||
| Fig. 4 Excited (red) and emission (black) spectra of compounds 2, 3, H2tmdb and bimb at room temperature. | ||
ECL behaviors of 2 and 3
Luminol is a luminescent reagent that produces an ECL signal in alkaline solution. 5 mg of 2, 3 and carboxylic acid ligand H2tmdb were dispersed in 10 mL of water. After ultrasonic dispersion, 7 μL of the mixed solution was added dropwise to the surface of the glassy carbon electrode, and then dried naturally. ECL scanning was performed in 5 mL of PBS (0.1 M, pH = 11) and 20 μL of luminol solution (25 mmol L−1). As shown in Fig. 5, due to the poor conductivity of the carboxylic acid ligand H2tmdb, it had an inhibitory effect on the ECL signal of luminol compared with GCE. However, 2 and 3 had a significant sensitizing effect on the ECL signal, in which the signal values of 3 were twice those of the bare electrode, and those of 2 could be up to 3 times as high.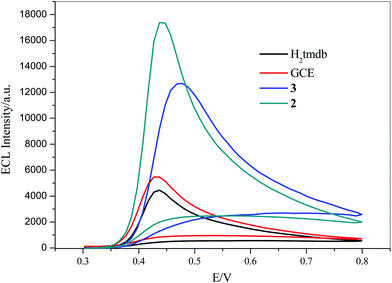 | ||
| Fig. 5 ECL of 2, 3, GCE and H2tmdb in 0.1 M PBS buffer (pH = 11) and 25 mM luminol solution, scan range: −0.8 V to 0.8 V, scan rate: 0.1 V s−1, respectively. | ||
When the compound-modified electrode was placed in a mixed solution of luminol and an alkaline PBS buffer solution, some of the luminol solution entered the surface of the compound-modified electrode to interact with the compound by molecular diffusion. Luminol underwent an oxidation reaction in the alkaline solution, and an electron was generated to produce a luminol anion. Similarly, the compound-modified electrode lost an electron at the excitation voltage, producing a corresponding cation. The luminol anion was coupled to the compound cation to produce a complex in an excited state. When the complex in the excited state returned to the ground state, photons were released and energy was generated, thereby generating ECL, which sensitized the ECL of the luminol system. Taking 2 as an example, its possible luminescence mechanism was as follows:
| LH− − e− → LH* → Lg− + H+ |
| 2 − e− → 2g+ |
| Lg− + 2g+ → 2* + L |
| 2* → 2 + hv |
Therefore, these compound-modified electrodes could be used as sensitizers for luminol in electrochemical detection.
Selective sensing of cations
Next, the fluorescence properties of compounds 2 and 3 were analyzed. Dispersions of 5 mg of dry compounds 2 and 3 powder were added to 5 mL of metal nitrate aqueous solution (such as Ag+, Ca2+, Na+, Cu2+, Fe3+, Cd2+, K+, Zn2+, Pb2+, Ni2+, Al3+, Cr3+ and Co2+) with the concentration of ions being 1.0 × 10⁻² mol L−1 (M) by ultrasonication for about 30 min, respectively, forming 2 and 3 @ Mn+ stable suspensions.The suspension of Fe3+ ions and Cr3+ ions in compounds 2 and 3 showed a significant quenching effect under ultraviolet irradiation at 365 nm, but when we tested the fluorescence spectrum of the mixture, it had no effect. For 2, the fluorescence intensities of the suspensions which added Ca2+, Na+, Cu2+, Cd2+, Zn2+, Pb2+, Al3+ and Co2+ cations were increased slightly, but the addition of Ag+, Fe3+, K+, Ni2+ and Cr3+ cations weakened the intensities compared with the blank suspension (Fig. 6B). Similarly, for 3, in addition to Fe3+ ions and Cr3+ ions, the fluorescence intensity of other cationic suspensions was increased relative to the blank (Fig. 6D). It is not difficult to see from the figures that when Fe3+ ions are added, the strength of fluorescence of the above two compounds could be almost completely quenched. It follows that these two compounds showed selective recognition of Fe3+ ions in aqueous solution.
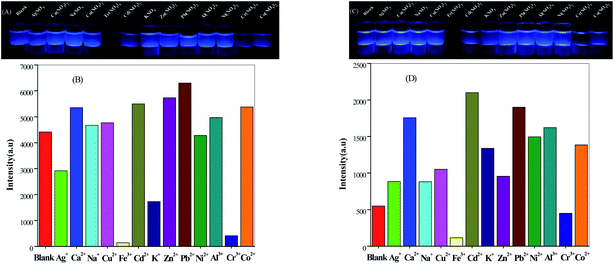 | ||
| Fig. 6 Glow diagram under UV light irradiation (λ = 365 nm) and luminescence response of compound 2 (A and B) and compound 3 (C and D) immersed in the presence of metal ion solutions. | ||
Selective detection of Fe3+ ions
Through previous reported literature, we had the fluorescence sensing experiment of Fe3+ with a good effect on quenching. Firstly, 2 mL of aqueous solvent suspensions containing crystal samples of 2 (2 mg) were treated ultrasonically for half an hour. Next, Fe(NO3)3 at 0.5 mmol L−1 (mM) was gradually added to it and its luminescence intensity was tested (the experimental steps for 3 are the same as those for 2; in addition, the concentration of Fe(NO3)3 in 3 was 1 mM).16 As depicted in Fig. 7A and C, the fluorescence intensities of 2 @ Fe3+ and 3 @ Fe3+ stable suspensions were quenched, gradually decreasing with an increase in the concentration of Fe3+; moreover, the quenching efficiency was 82.67% when the Fe3+ concentration rose to 0.1500 mM for 2 and the quenching efficiency was 69.74% for 3 when the Fe3+ concentration rose to 0.3243 mM. The consequent quenching could be quantitatively rationalized by the Stern–Volmer equation, I0/I = Ksv[M] + 1 (I0 and I are the luminescence intensities of 2 and 3 without and with the addition of the analyte, respectively). Ksv is the quenching constant, [M] is the molar concentration of Fe3+).17 KSV was calculated to be 3.06 × 10⁵ M−1 from the Stern–Volmer plots for 2 (Fig. 7B), and it showed a good linear relationship when the concentration was low (0–0.0150 mM). Similarly, KSV was calculated to be 1.07 × 10⁵ M−1 for 3 at 0–0.0521 mM (Fig. 7D). The mechanism of Fe3+ cation fluorescence quenching was that with the continuous addition of Fe3+, an interaction between the metal ion and the complex caused the metal ion to transfer charge, causing the ligand absorption of the excitation energy to dissipate in a non-radiative form, eventually leading to a decline in the fluorescence intensities or even quenching.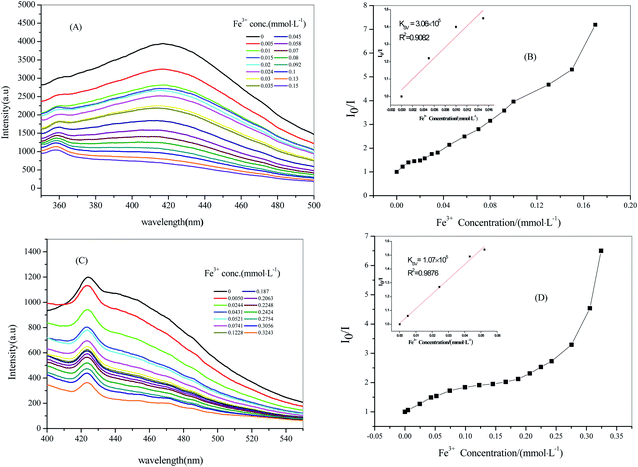 | ||
| Fig. 7 Stern–Volmer plot of compound 2 with 0.5 mM Fe3+ solution (A) and (B), compound 3 with 1 mM Fe3+ solution (C) and (D). | ||
Catalytic degradation of dyes under illumination
Considering the high pore volume of compounds 2 and 3, potential applications in the catalytic degradation of unused dye molecules under illumination were investigated. To check the adsorption ability of 2 towards different dyes, 10 mg of compound 2 was added into various solutions of negatively charged Methyl Orange (MO), positively charged Methylene Blue (MB), and Rhodamine B (RhB) in water (10 mg L−1, 100 mL), respectively, then magnetically stirred in the dark to achieve adsorption–dissociation equilibrium. The UV-vis spectra were recorded at different time intervals under the illumination of a xenon lamp. The research method for 3 was the same as that for 2. For 2, The UV-vis spectroscopic analyses and photographs before and after adsorption suggested that 2 could be used as a catalyst to degrade dye MB (Fig. 8), but there was no obvious effect for MO or RhB (ESI, Fig. S5†). The results showed that 2 had good degradability for MB, mainly due to the interaction between the organic dyes and the composite framework. In addition, the degradation rate of MB solution was 88.70% after 60 min (65.64% at 10 min). For 3, it could be seen that it showed adsorption for MO (ESI, Fig. S6†). The degradation rate of MO solution was 30.61% after 180 min. By comparison, it was easy to see that 2 showed good degradation for MB and could selectively degrade MB in a short time; 3 had a degradation effect on MO.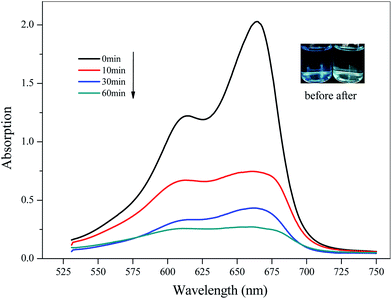 | ||
| Fig. 8 Time-dependent UV-vis spectra of MB in water solution in the presence of 2 (the inserted photographs show the color change before and after dye degradation). | ||
Gas adsorption of 3
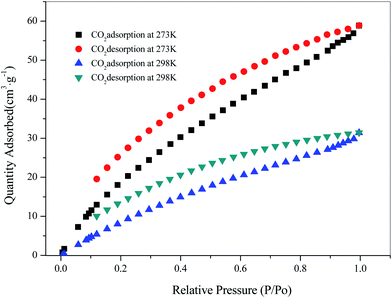
Since the structure of compound 3 had a large hole, the adsorption of CO2 and CH4 was carried out for 3 at temperatures of 273 K and 298 K, respectively. Firstly, 80 mg of the sample was vacuum dried at 353 K for 10 hours, and then subjected to a gas adsorption test at constant temperature. As shown in Fig. 9, the adsorption performance of 3 for CO2 was better at 273 K, reaching 58.85 cm3 g−1, and the adsorption amount was 19.95 cm3 g−1 at 298 K. In addition, the amount of adsorption of CH4 was 15.12 cm3 g−1 at 273 K (ESI, Fig. S7†). The Langmuir surface obtained by fitting its adsorption isotherms was 230.11 m2 g−1. The results showed that compound 3 had good adsorption capacity for CO2.Conclusions
In summary, the synthesis and characterization of three compounds with H2tmdb ligands were reported. The polymer was analyzed using PXRD, IR, TGA and fluorescence. Among these, in compound 1, two 2D layers were interlaced and interspersed, and then stacked to form a 3D structure. Compound 2 was a 4-fold interpenetrating structure with spiral chains, and compound 3 was a 3-fold interpenetrating structure. Compounds 2 and 3 had a significant sensitizing effect on the ECL signal: in particular, 2 could reach three times as high. Furthermore, 2 and 3 could be used as potential fluorescence materials for sensing Fe3+ ion with high selectivity and sensitivity. Simultaneously, experimental results for the catalytic degradation of dyes under illumination indicated that 2 could efficiently degrade MB and 3 could efficiently degrade MO. Moreover, 3 had good adsorption capacity for CO2.Conflicts of interest
There are no conflicts to declare.Acknowledgements
The authors gratefully acknowledge the financial support by the Science and Technology Development Planning of Jilin Province, China (No. 20170101098JC) and The 13th Five Science and Technology Research of Jilin Province Department of Education (No. JJKH20181174KJ).References
- (a) G. Ferey, Chem. Soc. Rev., 2008, 37, 191 RSC; (b) Y. Zhang and K. Chen, Inorg. Chem. Commun., 2013, 35, 1 CrossRef; (c) C. J. Zhang, M. S. Wang and G. C. Guo, Inorg. Chem. Commun., 2013, 35, 76 CrossRef CAS; (d) B. Li, S. Q. Zhang, C. Ji, H. W. Hou and T. C. Mark, Cryst. Growth Des., 2012, 12, 5529 CrossRef; (e) K. Liu, X. Li, D. X. Ma, Y. Han, B. Y. Li, Z. Shi, Z. J. Li and L. Wang, Mater. Chem. Front., 2017, 1, 1982 RSC.
- (a) A. Aijaz, E. Barea and P. K. Bharadwaj, Cryst. Growth Des., 2009, 9, 4480 CrossRef CAS; (b) A. Aijaz, P. Lama, E. C. Sanudo, R. Mishra and P. K. Bharadwaj, New J. Chem., 2010, 34, 2502 RSC.
- W. H. Jiang, H. Z. Zhang, G. F. Hou, D. S. Ma, B. Liu and Y. H. Yu, RSC Adv., 2017, 7, 45641 RSC.
- N. N. Mao, P. Hu, F. Yu, X. Chen, G. L. Zhuang, T. L. Zhang and B. Li, CrystEngComm, 2017, 19, 4586 RSC.
- X. J. Gao, M. X. Zheng, L. Qin, K. Shen and H. G. Zheng, Cryst. Growth Des., 2016, 16, 4711 CrossRef CAS.
- (a) Y. L. Liu, K. F. Yue and B. H. Shan, Inorg. Chem. Commun., 2012, 17, 30 CrossRef CAS; (b) X. Zhao, J. Dou and D. Sun, Dalton Trans., 2012, 41, 1928 RSC; (c) R. L. Chen, X. Y. Chen and S. R. Zheng, Cryst. Growth Des., 2013, 13, 4428 CrossRef CAS; (d) K. Liu, Y. Y. Sun, L. M. Deng, F. Cao, J. S. Han and L. Wang, J. Solid State Chem., 2018, 258, 24 CrossRef.
- (a) D. K. Maity, K. Otake and S. Ghosh, Inorg. Chem., 2017, 56, 1581 CrossRef CAS PubMed; (b) H. Q. Huang, X. Y. Cheng and T. Zhang, Inorg. Chem. Commun., 2016, 68, 21 CrossRef CAS; (c) A. Husain, R. Parveen and P. Dastidar, Cryst. Growth Des., 2015, 15, 5075 CrossRef CAS.
- (a) B. Wisser, Y. Lu and C. Z. Janiak, Z. Anorg. Allg. Chem., 2007, 633, 1189 CrossRef CAS; (b) R. Kieltyka, P. Englebienne and J. Fakhoury, J. Am. Chem. Soc., 2008, 130, 10040 CrossRef CAS PubMed; (c) X. Zhang, L. Hou and B. Liu, Cryst. Growth Des., 2013, 13, 3177 CrossRef CAS.
- (a) J. H. Cui, Y. Z. Li, Z. J. Guo and H. G. Zheng, Cryst. Growth Des., 2012, 12, 3610 CrossRef CAS; (b) L. M. Fan, W. L. Fan, B. Li, X. Z. Liu, X. Zhao and X. T. Zhang, Dalton Trans., 2015, 44, 2380 RSC.
- (a) Y. Fan, C. D. Si, C. Hou, X. Q. Yao, D. C. Hu, Y. X. Yang and J. C. Liu, Polyhedron, 2015, 98, 64 CrossRef CAS; (b) H. H. Li, W. Shi, K. N. Zhao, Z. Niu, H. M. Li and P. Cheng, Chem.–Eur. J., 2013, 19, 3358 CrossRef CAS PubMed; (c) T. P. Hu, B. H. Zheng, X. Q. Wang and X. N. Hao, CrystEngComm, 2015, 17, 9348 RSC.
- (a) J. F. Song, S. Z. Li, R. D. Zhou, J. Shao, X. M. Qiu, Y. Y. Jia, J. Wang and X. Zhang, Dalton Trans., 2016, 45, 11883 RSC; (b) Z. Li, CrystEngComm, 2011, 13, 1984 RSC.
- L. S. Meng, L. Zhao, C. J. Zhao and X. Lin, J. Mol. Struct., 2019, 1179, 425 CrossRef CAS.
- F. F. Wu, Y. Zhou, H. Zhang, R. Yuan and Y. Q. Chai, Anal. Chem., 2018, 90, 2263 CrossRef CAS PubMed.
- G. M. Sheldrick, Acta Crystallogr., Sect. A: Found. Crystallogr., 2008, 64, 112 CrossRef CAS PubMed.
- (a) F. P. Huang, Z. M. Yang, P. F. Yao, Q. Yu, J. L. Tian, H. D. Bian, S. P. Yan, D. Z. Liao and P. Cheng, CrystEngComm, 2013, 15, 2657 RSC; (b) Y. Su, S. Zhang, Y. Li, A. Z. Zhu and Q. Meng, Cryst. Growth Des., 2007, 7, 1277 CrossRef CAS.
- (a) L. M. Deng, Y. W. Zhang, D. Zhang, S. S. Jiao, J. X. Xu, K. Liu and L. Wang, CrystEngComm, 2019, 21, 6056 RSC; (b) X. Liu, L. Zhao, C. J. Zhao, L. S. Meng and C. Liu, J. Mol. Struct., 2019, 1188, 238 CrossRef CAS.
- S. W. Thomas, G. D. Joly and T. M. Swager, Chem. Rev., 2007, 107, 1339 CrossRef CAS PubMed.
Footnote |
| † Electronic supplementary information (ESI) available: Selected bond lengths and angles, simulated and experimental X-ray powder diffraction patterns, TGA curves, UV-vis absorption spectra and X-ray crystallographic files in cif format. CCDC 1947245, 1947250 and 1947261 contain the supplementary crystallographic data for compounds 1–3 respectively. For ESI and crystallographic data in CIF or other electronic format see DOI: 10.1039/c9ra08559a |
| This journal is © The Royal Society of Chemistry 2019 |

