 Open Access Article
Understanding the adsorption performance of two glycine derivatives as novel and environmentally safe anti-corrosion agents for copper in chloride solutions: experimental, DFT, and MC studies
Amr. Elgendy *a,
H. Nady*bc,
M. M. El-Rabieib and
Ahmed. A. Elhenawy
 d
d
aEgyptian Petroleum Research Institute (EPRI), Nasr City, 11727, Cairo, Egypt. E-mail: amr.elgendy40@yahoo.com; Tel: +201001360595
bChemistry Department, Faculty of Science, Fayoum University, Fayoum, Egypt. E-mail: hashem_nady@yahoo.com; nhmahmod@ju.edu.sa; Tel: +966535589807 Tel: +201069878104
cChemistry Department, College of Science and Arts in Qurayate, Jouf University, 2014, Saudi Arabia
dChemistry Department, Faculty of Science, Al-Azhar University (Boys Branch), Nasr City, Cairo, Egypt
First published on 18th December 2019
Abstract
The inhibition impacts of two non-toxic glycine derivatives, namely, bicine (N,N-bis(2-hydroxyethyl)glycine) and tricine (N-(tri(hydroxymethyl)methyl) glycine) on copper corrosion were investigated in 3.5% NaCl solutions. Surprisingly, there is no report on using bicine and/or tricine as corrosion inhibitors for Cu and its alloys in a seawater-like environment. The effects of bicine and tricine on the corrosion behavior of Cu in 3.5% NaCl were examined using the open circuit potential, Tafel polarization, and AC spectroscopy (EIS) techniques. The corrosion rate decreased as a function of the inhibitor dose. The Tafel and EIS parameters showed that the inhibitors decreased both the anodic and cathodic corrosion currents and inhibited the charge transfer process by adsorption on the Cu surface. The inhibition property was attributed to the adsorption of inhibitor molecules with the Langmuir model. Tricine showed a superior inhibition performance of more than 98% at a concentration of ∼5 mmol L−1. The free energy of adsorption data revealed physical adsorption. The outcomes of Monte Carlo simulations and theoretical studies well supported the experimental data.
1. Introduction
Copper is an important metal not only for its corrosion resistance, but also for its wide industrial applications, in which the metal itself or its alloys are involved. The corrosion resistance of copper has been attributed to the accumulation of corrosion products on its surface, forming a protecting layer. This layer undergoes periodic degradation in the presence of chlorides, sulfates, sulfides, nitrates, or ammonia pollutants. Such pollutants can pierce the protecting layers through weak spots like pores or cracks, thus increasing the corrosion rate.1 The protective film formation is always enhanced in acidic solutions, particularly at low temperatures. In the presence of Cl− ions, Cu(I) complexes are formed, where the kinetics of anodic metal dissolution is not affected by the solution pH. The mechanism of Cu dissolution is similar in both acidic and neutral solutions.2 Recently, the electrochemical dissolution of Cu in chloride-containing solutions was critically reviewed.3 Among the proposed mechanisms, there is agreement that Cu dissolution involves the oxidation of Cu to form CuCl species, followed by the formation of CuCl2−.4–10 The polarization behavior shows an apparent Tafel area corresponding to the formation of CuCl, followed by the control of the mass transport and the appearance of a mixed-kinetic region, where the current increases due to the bivalent Cu species.5–8 The use of different inhibitors of Cu corrosion, especially organic molecules, in different media has been extensively studied.10–18 The extent of inhibitor adsorption, which in turn dictates the inhibition activity, relies on some factors such as the constituents of the metal or the alloys, the chemical composition of electrolytes, electronic characteristics and concentration of the inhibitor molecules as well as the solution temperature of the corrosive environment. Organic compounds containing N, S, or O are among the most used anti-corrosion materials.19 Although, the interaction mechanism between the inhibitor molecules and the Cu surface is still not totally clear, there have been extensive efforts to clarify how the organic molecules reduce Cu corrosion, particularly by correlating experimental results with the coefficients of the frontier molecular orbitals (HOMO and LUMO) obtained from quantum chemical studies.15,18 Heterocyclic compounds are known to be effective Cu corrosion inhibitors in aqueous solutions,18,20,21 but most of these compounds are toxic or carcinogenic and very harmful to the environment. It is thus very important to orient research to develop biodegradable corrosion inhibitors that possess good corrosion inhibition efficiency and are not toxic. In the last decade, some published papers suggested eco-friendly corrosion inhibitors for different metallic materials.22–26Intense research efforts are directed to find new environmentally friendly inhibitor compounds for Cu corrosion in seawater media. In this paper, we used bicine and tricine as novel inhibitors to control the corrosion of Cu in aerated 3.5 mass% NaCl solutions. To the best of our knowledge, no report on bicine and/or tricine as a Cu corrosion inhibitor in Cl−-containing media has been published till date. Both materials are water-soluble and have minimal tendency to bind to soil or sediments. They are not expected to be biodegradable but are non-toxic and unlikely to persist in the environment. The corrosion rate and % of inhibition efficiency were determined using OCP, AC and DC electrochemical measurements.
2. Experimental
2.1. Materials and sample preparation
Bicine and tricine were bought from Sigma-Aldrich with the chemical structures presented in Fig. 1. A commercial Cu sample was obtained from a company involved in NaCl and Na2SO4 production from saltwater in Egypt with the chemical composition (0.001 Al, 0.02 Ni, 0.003 Mn, 0.007 Zn, 0.033 Sn, 0.002 Fe, 0.004 Si, with Cu as the remainder in mass%). The Cu working electrode was cut into a cylindrical rod and fixed into an appropriate glass tube by epoxy resin leaving a 0.2 cm2 external circular cross-section. For the AC and DC electrochemical studies, a three-electrode glass cell was utilized comprising a Cu working electrode (WE), a platinum coil counter electrode (PE), and a saturated calomel electrode (SCE) reference electrode (RE) (SCE; Eo = 0.245 V vs. the standard hydrogen electrode, SHE). The WE was treated by abrading with abrasive emery papers down to 2000 grit, followed by washing with bi-distilled water before rapidly immersing it into the cell. Different ranges of the inhibitor (1 to 20 mM L−1 at pH 7, 298 K) in 3.5% NaCl solutions were studied.2.2. Electrochemical experiments
The electrochemical techniques were implemented using a Volta lab 10 PGZ “All-in-one” potentiostat/galvanostat workstation. The steady-state potential (Ess) was obtained by immersing the electrode in the electrolyte under an unstirred condition, where the potential change did not exceed 0.1 mV min−1. The potentiodynamic experiments were conducted at a scan rate of 10 mV s−1. The values of the corrosion potential, Ecorr, and corrosion current density, icorr, were obtained from the Tafel curves. For the EIS measurements, a 10 mV peak-to-peak sine wave was applied as the excitation signal in the frequency range from 100 kHz to 10 mHz. The AC measurements were conducted at Ess to be sure that the surface morphology did not change. The % of inhibition efficiency, η, was calculated for each dose from both electrochemical techniques. Different adsorption models were examined. The experimental results were carried out at least three times with good reproducibility.2.3. Quantum chemical model
All the investigated quantum chemical indices (QCIs) for the researched compounds, namely bicine, tricine, and glycine (basic structure), were done using the density functional theory (DFT) with unrestricted spin using the DMol3 module in Materials Studio software (Accelrys Inc.). In the DFT study, the generalized gradient approximation (GGA) of the BOP function was used through the double-numeric basis set (DNP 3.5). Some of the outputs of the computational calculation from the geometry optimized compounds were used to estimate some derived parameters, as shown in Table 4, namely, the energy gap between the frontier molecular orbitals; S (softness, which has an indirect relationship with the chemical reactivity, S = 1/η); η, hardness (reciprocal of softness, η = 1/2[∂2E/∂2N2]υ(r)); dipole moment and ionization potential (I); and electron affinity (A) as well as ΔNmax = χ/2η (the maximum number of electrons transferred between the inhibitor and metal surface).27,28 All the previous parameters were obtained in gas, solution, and protonated phases. For the solvent effect, certain COSMO control was used, as described previously.29The adsorption phenomena of the investigated compounds over the Cu surface were simulated by Monte Carlo (MC) simulations through adsorption Locator modules developed in Materials studio. The most stable surface of the Cu plane was selected as an adsorbent to simulate the adsorption process; Cu (111) represented the most thermodynamically stable form. For the MC simulation, the Cu (111) surface was split with 3 Å thickness and the cleavage plan was expanded to a 15 × 15 supercell; then, a vacuum slab with 25 Å thickness was built above the Cu (111) crystal to remove the periodic boundary effect. COMPASS force field was used to obtain the minimum energy for the Cu (111) surface and the simulation method was atom-based. Throughout the simulation annealing study, the adsorbed molecule was in a free state, while the Cu surface was kept frozen. Here, 10 conformations were obtained from the MC simulation. For each conformation, several energy parameters were gained. The most stable one was taken into consideration.
3. Results and discussion
3.1. Steady-state potential (Ess) measurements
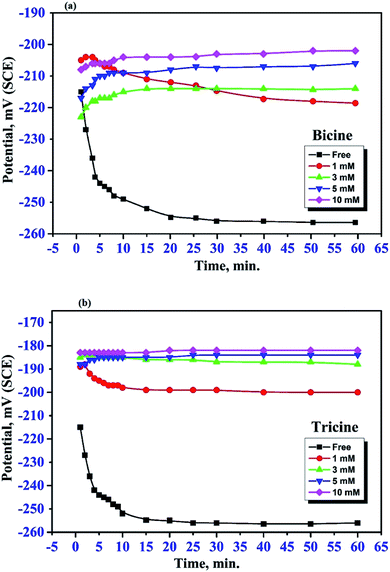
The effect of bicine or tricine on the potential-time behavior of Cu was traced in stagnant 3.5 mass% NaCl solutions over 1 h. Fig. 2(a and b) show the variation of the open circuit potential, OCP, of WE in the solutions free from and containing different concentrations of the tested inhibitors, respectively. Ess was reached within less than 20 min from immersing WE in the test solution. Obviously, the presence of the inhibitor shifted Ess to more positive potentials. This anodic shift may indicate the adsorption of the investigated molecules on the active corrosion centers, leading to the shift in the potential to the anodic direction. In the absence of the inhibitor molecules, the OCP of the Cu electrode became more negative within the first 20 min and then reached the steady-state value, which is a characteristic of corroding surfaces. Also, at the same concentration of both inhibitors, the positive shift in Ess in the presence of tricine was more than that recorded with bicine. For comparison, Fig. 3 presents the change in the OCP of the Cu electrodes in Cl− solutions free of inhibitors and containing 5 mM of the inhibitors. It is clear that tricine is relatively more effective as an inhibitor of Cu corrosion in the chloride solutions.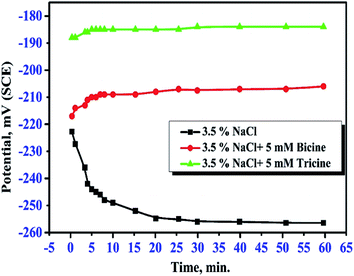 | ||
| Fig. 3 Variation of the open circuit potential of a copper electrode in stagnant naturally aerated 3.5 mass% NaCl solutions in the absence and presence of 5 mM bicine and tricine. | ||
3.2. Polarization measurements
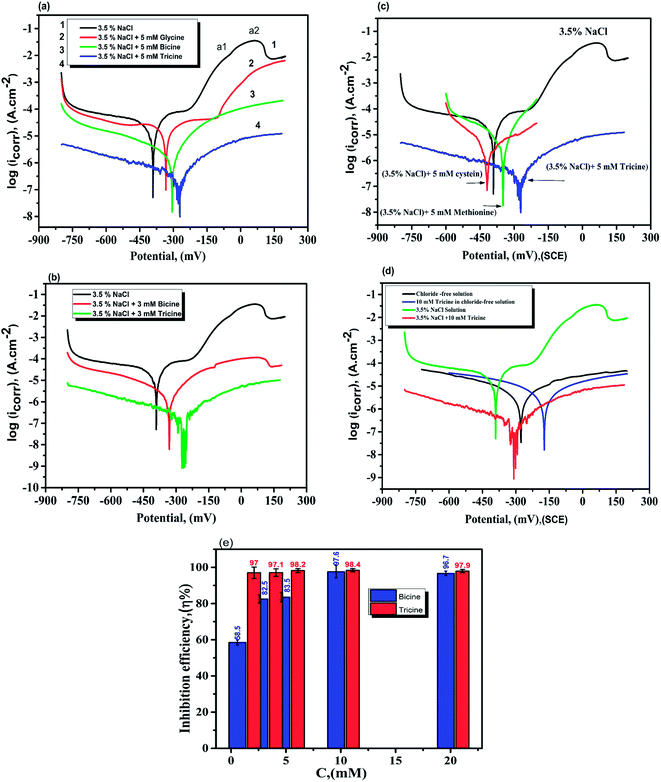
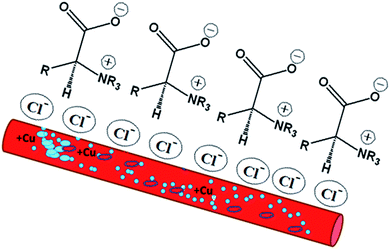
The potentiodynamic polarization curves for the Cu electrode immersed in 3.5% NaCl solutions in the absence and presence of the investigated inhibitors are shown in Fig. 4. As shown in Fig. 4a, the polarization curve of the Cu electrode in the chloride-containing solutions exhibits two anodic peaks that can be ascribed to Cu oxidation. The kinetics and mechanism of the anodic dissolution of bare Cu in chloride-containing environments have been studied extensively.30–32 The electrochemical dissolution mechanism of Cu in chloride solutions is as follows:33 the current density increases till the anodic peak a1 is attained, which is ascribed to the anodic dissolution of Cu to a cuprous ion, Cu+, according to the equation Cu → Cu+ + e−. Then, an insoluble adsorbed species of cuprous chloride, CuCl, is formed in the presence of Cl− ions (Cu+ + Cl− = CuCl) and a decrease in the current density is recorded. The increase in the Cl− ion concentration leads to attack on the insoluble CuCl film, which transforms into a soluble CuCl2− complex (CuCl + Cl− = CuCl2−).34 CuCl2− is believed to control the kinetics of the anodic dissolution of Cu in the inhibitor-free solutions, whereas at Cl− ion concentrations higher than 1 M, CuCl32− and CuCl43− complexes may be formed.33 At Cl− ion concentrations lower than 1 M, the dissolution of Cu takes place through the formation of CuCl, which is not protective enough and is converted to soluble CuCl− by reacting with excess Cl−30. In an aerated chloride solution, the cathodic counter-reaction is actually oxygen reduction: O2 + 2H2O + 4e− → 4OH−. The insoluble corrosion products formed on the electrode surface may suppress the rate of both anodic dissolution and oxygen reduction. Therefore, the corrosion of Cu is controlled by O2, Cl−, Cu+, and CuCl− mass transfer to and from the electrode surface.30,35 The potentiodynamic polarization behavior of the Cu electrode was recorded in the absence and presence of different concentrations of bicine and tricine. Obviously, the presence of the glycine derivatives shifted the polarization curves towards lower current densities. Also, the same behavior was observed with an increase in the inhibitor concentration. The recorded polarization curves were parallel, which indicated that the mechanism of the corrosion process was not affected by adding the inhibitor and was controlled just by suppressing the rates of the anodic and/or cathodic reactions.36,37 The blank anodic Tafel side showed an anodic peak at positive potentials, which disappeared after the injection of the inhibitor molecules. This may be due to the adsorption of the inhibitor molecules on the WE surface. The adsorption process leads to the suppression of the oxidation rate, which happens at the start of corrosion.36–38 Fig. 4(a and b) represent the Tafel curves of WE measured after reaching Ess in stagnant 3.5 wt% NaCl solutions free from and containing 3 and 5 mM bicine or tricine. For comparison, glycine and some effective inhibitors such as cysteine and methionine were also used and the results are shown in Fig. 4(a and c). In an inhibitor-free solution, a current peak was recorded, which refers to the formation of CuCl on WE.37 Also, glycine did not give effective corrosion inhibition, as seen from the anodic branch. Moreover, the addition of cysteine and methionine showed lower inhibition efficiency than that for the inhibitors under investigation. The figure shows clearly that tricine is more effective as an inhibitor and establishes its inhibition performance via the adsorption of its molecules over the corrosion active sites by a large number of heteroatom centers. The adsorption process is influenced by the molecular structure as well as the nature and the type of charge on the substrate.39–41 Thus, the corroding Cu surface to be protected is usually free from oxides, and this allows the inhibitors to exert their action either by retarding the cathodic and/or the anodic processes. The excellent corrosion inhibition characteristics of these molecules can be associated with the lone pair of electrons on the N atom and the presence of side chains also containing lone pairs of electrons. Being amino acid molecules, they will be present in the form of zwitter ions in neutral solutions.42 Both molecules form zwitter ions containing a negatively charged carboxyl group and a protonated amino group. Thus, it is very difficult for inhibitor molecules with a positive charge to get adsorbed on a positively charged substrate because of the repulsion force. In such a condition, Cl− ions should be first adsorbed on the substrate surface by electrostatic adsorption, which creates excess negative charge at the metal-solution interface.21,41,42 Consequently, the positively charged inhibitor can form a protective layer by adsorption and this was confirmed by Fig. 4d, which shows the polarization of WE in the chloride-free and chloride-containing solutions without and with adding 10 mM of tricine. From Fig. 4d, we can see the synergetic effect of Cl− ions and the inhibitor molecules, where tricine molecules have a small effect on the Cu corrosion in the chloride-free solution, and this is due to the mechanism mentioned above. The following Scheme 1 shows how the zwitter ions formed will be attracted to the active sites, where the Cl− ions are already present.The presence of Cl− ions with either bicine or tricine molecules stabilized their adsorption on the active sites and hence decreased the corrosion rate.21,42 The % of inhibition increased as the concentration of the inhibitor increased due to the increased surface coverage. The corrosion percentage, η%, can be calculated from the recorded current density according to η% = [ icorr − icorr(inh)]/icorr × 100, where icorr and icorr(inh) represent the corrosion current densities for Cu WE in chloride solutions free from and containing an inhibitor, respectively. The Tafel parameters, i.e., icorr, Ecorr, βa and βc, and η% are presented in Table 1. The Tafel slopes were calculated from the linear branches of the Tafel lines. The icorr and Ecorr values were extrapolated from the intersection of the Tafel branches, and icorr was used for the calculation of the corrosion rate (CR). The surface coverage, θ, was calculated and presented in the same Table 1. The anodic and cathodic Tafel slopes have their general values for Cu or Cu alloy corrosion.21,43,44 The most effective inhibition performance of more than 98% was obtained in the presence of 5.0 mM tricine. The calculated value of the surface coverage corresponding to this high efficiency was 0.2 cm2. These values indicated that the whole metal surface was involved in the corrosion process and a small amount of the inhibitor was capable of inhibiting the corrosion process up to ∼98%.
| Concentration (mM L−1) | icorr (μA cm−2) | Ecorr (mV/SCE) | βc (mV dec−1) | βa (mV dec−1) | η% SD(±) | θ | Surface area (cm2) | Surface conc. (mol L−1 cm−2) |
|---|---|---|---|---|---|---|---|---|
| Blank | 7.64 | −389 | −78.8 | 56.6 | — | — | ||
![[thin space (1/6-em)]](https://www.rsc.org/images/entities/char_2009.gif) |
||||||||
| Bicine | ||||||||
| 1 | 3.17 | −638.1 | −89.8 | 131.2 | 58.5(±1.4) | 0.59 | 0.12 | 14.4 × 10⁻⁴ |
| 3 | 1.34 | −329.3 | −146.8 | 94.8 | 82.5(±2.2) | 0.83 | 0.17 | 20.4 × 10⁻⁴ |
| 5 | 1.26 | −306.4 | −162.2 | 86.9 | 83.5(±2.6) | 0.84 | 0.17 | 20.6 × 10⁻⁴ |
| 10 | 0.18 | −245.2 | −83.9 | 44.5 | 97.6(±3.4) | 0.98 | 0.20 | 24.1 × 10⁻⁴ |
![[thin space (1/6-em)]](https://www.rsc.org/images/entities/char_2009.gif) |
||||||||
| Tricine | ||||||||
| 1 | 0.23 | −200.5 | −77.1 | 89.1 | 97.0(±0.40) | 0.97 | 0.19 | 17.6 × 10⁻⁴ |
| 3 | 0.22 | −262.5 | −92.8 | 33.3 | 97.1(±0.71) | 0.97 | 0.19 | 17.6 × 10⁻⁴ |
| 5 | 0.13 | −273.0 | −69.5 | 63.9 | 98.2(±0.14) | 0.98 | 0.20 | 17.8 × 10⁻⁴ |
| 10 | 0.13 | −305.6 | −70.4 | 45.1 | 98.4(±0.21) | 0.98 | 0.20 | 17.9 × 10⁻⁴ |
The polarization curves in Fig. 4 reveal that either bicine or tricine inhibits the two corrosion (i.e., the anodic and cathodic) reactions of Cu corrosion under the chloride environment. This means that bicine or tricine acted as a mixed-type corrosion inhibitor. Surprisingly, both molecules adsorbed on Cu (WE) and formed a barrier layer that blocked the corrosion centers, thus leading to higher inhibition efficiency than those obtained by hazardous organic molecules.45 It is quite clear that the η% value of tricine at each concentration was relatively high (cf. Fig. 4a and b), and a maximum value of 98.4% was obtained at a concentration of 10 mM (for bicine, it was 97.6%) (cf. Table 1 and Fig. 4e). This value suggests the use of these molecules as effective inhibitors for Cu corrosion under a chloride environment.
3.3. EIS measurements
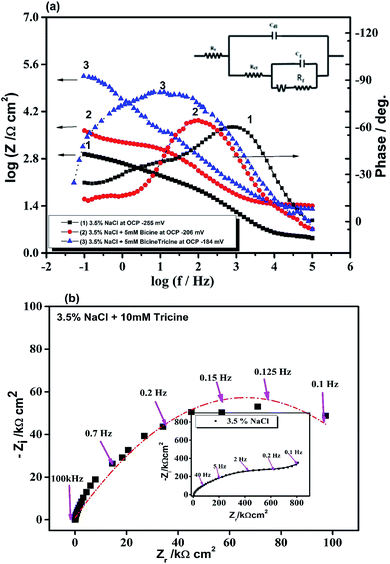
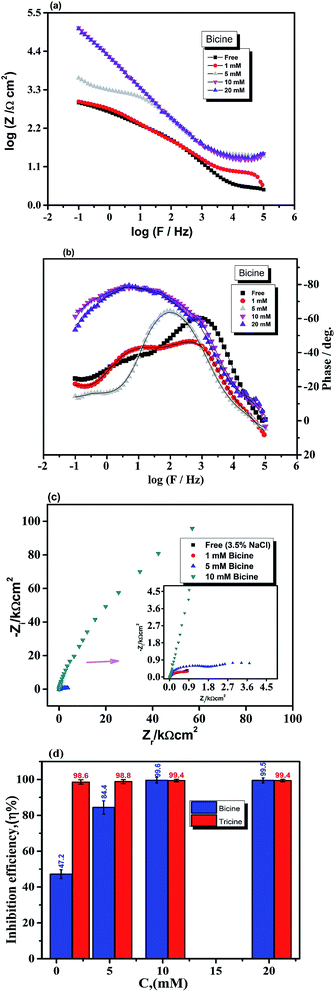
EIS investigations of Cu WE were implemented in stagnant, naturally aerated neutral 3.5 mass% NaCl solutions to gain further insights into the inhibition process. The experimental EIS results were recorded after 1 h of electrode immersion in the blank and in the solution containing the inhibitor, where a steady state was achieved. The obtained data were fitted with a pure equivalent circuit (EC) to calculate a numerical that depicts the physical and/or chemical properties of the investigated system.41,46 The Bode plots of the Cu electrode in the blank solution and in solutions containing 5 mM bicine or tricine are presented in Fig. 5. Obviously, the Bode plots show resistive and capacitive regions at high and intermediate frequencies, respectively; however, at low frequencies, they do not exhibit a clear resistive area (phase angle ≈ 0°) (cf. Fig. 5). Moreover, there were two overlaps at high and intermediate frequencies. Clearly, by adding an inhibitor, the phase angle acquired lower values at the intermediate frequencies, which is referred to as the passivation phenomenon.19 The impedance data were fitted using appropriate EC values, as shown in Fig. 5a (inset), where an empirical factor α (0 ≤ α ≤ 1) was used to consider the deviation behavior arising from surface inhomogeneity, surface roughness, and adsorption effects, as shown by Z = Rs + (Rct/(1 + (2πfRctCdl)α).46,47 In the proposed EC model, RΩ and Rct represent the solution and the charge transfer (corrosion) resistances, respectively. Both resistances are in parallel to a capacitor that characterizes the double-layer capacity, Cdl. Also, an additional resistor, Rf, and capacitor, Cf, were introduced to consider the formed surface film. The EC calculated parameters are presented in Table 2. It can be noted that the RΩ values increase as the inhibitor concentration increases. This can be explained by the decrease in solution conductivity due to the presence of organic molecules. Also, the Rf values in the solutions containing the inhibitors, especially tricine, increased to around 10-fold that of the solutions without the inhibitor. Tricine showed the highest corrosion resistance at a concentration of 5 mM (the Rf values of bicine and tricine are 5.1 and 123.8 kΩ cm2, respectively). Fig. 6(a–c) present the Bode and Nyquist plots in the absence and presence of a bicine inhibitor. Tricine showed a similar behavior. The Bode plots demonstrated two-time constants, as stated before. The calculated parameters of the data fitting are presented in Table 3. The inhibition activity can also be obtained from the corresponding EIS data according to where Rct(blank) and Rct(inh) are the corrosion resistances of the metal in the blank solution and in the presence of the investigated inhibitor. The values of η are included in Table 3. The polarization resistance, Rp, is determined by the sum of the inhibitors' film resistance, Rf, and the charge-transfer resistance, Rct, for the electrode covered by the inhibitor molecules:48 Rp = Rct + Rf. The values of Rp are also presented in Table 3. The values of the inhibition efficiencies calculated from Rct and the polarization resistance Rp increased with adding a higher concentration of the inhibitors (cf. Fig. 6c), and the maximum value was >98% at 5.0 mM tricine. The EIS results are consistent with the data obtained by polarization and provide further confirmation of the effectiveness of bicine and tricine as inhibitors of Cu corrosion in chloride solutions. The values of the empirical factor α were very close to unity, which indicated that the system acted like ideal RC.49
| Inhibitors | Rs/Ω | Rct/kΩ cm2 | Cdl/μF cm−2 | Rf/kΩ cm2 | Cf/μF cm−2 | Rp/kΩ cm2 | η% SD(±) |
|---|---|---|---|---|---|---|---|
| Blank | 2.2 | 0.28 | 22.8 | 1.1 | 182.3 | 1.4 | — |
| Bicine | 26.7 | 1.8 | 8.8 | 5.1 | 250.6 | 6.9 | 84.4(±3.70) |
| Tricine | 39.9 | 23.7 | 8.5 | 123.8 | 10.3 | 147.5 | 98.8(±1.14) |
| Concentration (mM L−1) | Rs/Ω | Rct/kΩ cm2 | Cdl/μF cm−2 | Rf/kΩ cm2 | Cf/μF cm−2 | Rp/kΩ cm2 | η% SD(±) |
|---|---|---|---|---|---|---|---|
| Blank | 2.2 | 0.28 | 22.8 | 1.099 | 182.3 | 1.38 | — |
![[thin space (1/6-em)]](https://www.rsc.org/images/entities/char_2009.gif) |
|||||||
| Bicine | |||||||
| 1 | 5.9 | 0.53 | 14.9 | 1.1 | 226.4 | 1.63 | 47.2(±2.44) |
| 5 | 26.7 | 1.8 | 8.8 | 5.1 | 250.6 | 6.9 | 84.4(±3.70) |
| 10 | 34.1 | 71.2 | 0.9 | 50.2 | 5.0 | 121.4 | 99.6(±1.60) |
![[thin space (1/6-em)]](https://www.rsc.org/images/entities/char_2009.gif) |
|||||||
| Tricine | |||||||
| 1 | 19.9 | 20.5 | 3.1 | 96.3 | 2.6 | 116.8 | 98.6(±1.20) |
| 5 | 39.9 | 23.7 | 8.5 | 123.8 | 10.3 | 147.5 | 98.8(±1.10) |
| 10 | 42.4 | 46.6 | 1.4 | 131.1 | 9.7 | 177.7 | 99.4(±0.71) |
3.4. Adsorption isotherm
The adsorption isotherms of bicine and tricine on the Cu surface are very important in determining the electrochemical reaction mechanism. Generally, two types of metal inhibitor interactions can be considered: one where physical adsorption takes place by the electrostatic attraction between the charged Cu surface and the charged inhibitor and the other where chemical adsorption involves either charge transfer or sharing from the scrutinized inhibitor and the Cu surface. The adsorption process can be strengthened with the presence of an inhibitor with heteroatoms that are able to donate an electron to a transition metal, Cu, with vacant d orbitals.50 For adsorption investigations, the degree of surface coverage (θ) at various concentrations obtained from Tafel measurements was used, where θ = [icorr − icorr(inh)]/icorr.Several modes of adsorption isotherms like Langmuir, Temkin, and Frumkin were checked, where the best matching obeyed the Langmuir model  here, K is the adsorption constant related to the free energy of adsorption (ΔGads).
  51 where Csolvent is the water molar concentration (55.5 mol dm−3), R is the universal gas constant, and T is the absolute temperature. A straight line with a slope near unity was shown by plotting C/θ as a function of C. Such a linear relationship was shown for bicine and tricine (cf. Fig. 7). Moreover, the calculated ΔGads° values were −27.9 kJ mol−1 and −32.2 kJ mol−1 for bicine and tricine, respectively. Generally, a value of −40 kJ mol−1 is a threshold value between chemi/physisorption.52 Thus, from the obtained ΔGads° values, the adsorption process was a mixed type between physical and chemical processes.53 Nevertheless, the relatively higher ΔGads° value for tricine indicated stronger adsorption than that for bicine. This explains the recorded higher inhibition efficiency.
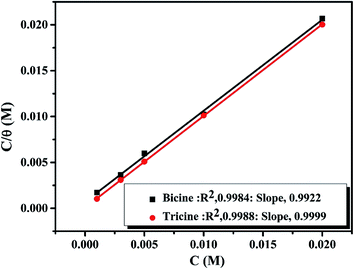 | ||
| Fig. 7 Langmuir isotherms for the adsorption of bicine and tricine on the copper surface in stagnant naturally aerated neutral 3.5 mass% NaCl solutions at 25 °C. | ||
3.5. Theoretical calculations
The electrochemical experiments showed that both bicine and tricine could effectively inhibit Cu from corrosion in a 3.5% NaCl solution. Moreover, tricine exhibited better inhibition capability than bicine. To validate the aforementioned data and deeply analyze the influence of the electronic parameters and geometrical structure on the corrosion inhibition performance of bicine and tricine, theoretical calculations and MC simulations were implemented. To this end, geometry optimization with unrestricted spin was accomplished by the popular DFT theory using both GGA with the DNP 4.4 levels as implemented in Materials Studio software (Accelrys Inc.) applied on the gas, solvated and protonated species.54–56 All calculated energies were computed from the geometry optimized structure (with the energy minima), where the calculated Mulliken charges were computed at the GGA/DNP 4.4 level for the atoms in bicine, tricine, and glycine molecules (Table 4). The distribution charges over the inhibitor atoms showed the presence of donor and acceptor regions, where charge transfer takes place. In general, in both inhibitor molecules, all H atoms have positive charges, while all O and N atoms have negative charges; all C atoms showed positive charges in bicine, while C3 in tricine showed negative charge (C3 = −0.001). Furthermore, the most active centers in both inhibitors were O atoms (O11 = −0.523 and O11 = −0.537) for bicine and tricine, respectively. Based on these values, the protonation affinity takes place on O11 in bicine and tricine. The electron delocalization over carbonyl groups, –C![[double bond, length as m-dash]](https://www.rsc.org/images/entities/char_e001.gif) O, supported the presence of the conjugation system in both inhibitors, which acted as an adsorption center by enhancing the powerful π-electron donation to the Cu surface.
O, supported the presence of the conjugation system in both inhibitors, which acted as an adsorption center by enhancing the powerful π-electron donation to the Cu surface.
| Mulliken charges with non-hydrogen and carbon atoms using GGA/DNP (4.4) | |||||||
|---|---|---|---|---|---|---|---|
| Atom | N 2 | O 4 | O 5 | O 8 | O 10 | O 11 | O 12 |
| Bicine | −0.325 | −0.405 | 0.097 | −0.514 | — | −0.523 | — |
| Tricine | −0.356 | −0.425 | −0.452 | −0.524 | −0.524 | −0.537 | −0.528 |
The adsorption of a molecule on the metallic surface often relies on the donor/acceptor property. The donor/acceptor frontier orbitals (HOMO)/(LUMO) are the vital orbitals for molecule adsorption. These orbitals can decide the interaction route of the inhibitor molecule with a Cu surface. Higher EHOMO and lower ELUMO values lead to an interaction enhancement between the inhibitor and the Cu surface.57 It follows that the greater value of EHOMOs for tricine molecules than that for bicine molecules or glycine as the base material in all the molecular species (gas, solvated, and protonated) (cf. Table 5) points to higher probability to lose valence electrons, increasing the power toward donating e− to Cu atoms and making it more likely to inhibit corrosion57,58 than bicine, as stated in the experimental results. The HOMO region was localized over all the –O– atoms of hydroxyethyl centers, while the LUMO was tagged over the carboxyl sites for the investigated compounds (cf. Fig. 8). EHOMO and ELUMO had negative values, which indicated charge transfer from the investigated inhibitor compounds to the Cu surface. These data demonstrated that the hydroxyethyl centers attack the Cu surface and adsorption may occur. Also, the energy gap (ΔE) value is a great indication of the chemical reactivity and the stability of the metal–inhibitor interactions. Tricine exhibited ΔE values (2.9194, 3.0000, and 0.5920) lower than those of bicine (3.9193, 3.5117, and 1.0343) and glycine (4.6342, 4.1916, and 1.1731) in the gas, solvated, and protonated molecules, respectively. These values demonstrated that tricine was more reactive and had higher inhibition efficiency than bicine or glycine (Table 5). The smaller the ΔE value, the higher the softness properties. On the contrary, hard molecules have high ΔE and can be inefficient corrosion inhibitors.59 The data obtained from Table 5 demonstrate that tricine has a greater softness value than bicine and glycine. Thus, tricine has higher inhibition efficiency than bicine. It is worth noting that the protonated species have higher reactivity than the other species, and this indicates that the protonated species are more likely to bind on the Cu surface than a neutral compound. The ΔN parameter is a measure of the number of e− offered from the investigated compounds to the Cu surface. Also, ΔN describes the direction and intensity of the electron transfer, where ΔN > 0 e− are transferred from the inhibitor molecule to the Cu surface and vice versa.60 From Table 5, it is apparent that electrons are transferred from the inhibitor molecules to the Cu metal due to the positive ΔN values. According to the ΔN values, the order of the scrutinized compounds will be tricine > bicine > glycine, which supports the experimental results indicating higher efficiency for tricine over that for bicine.
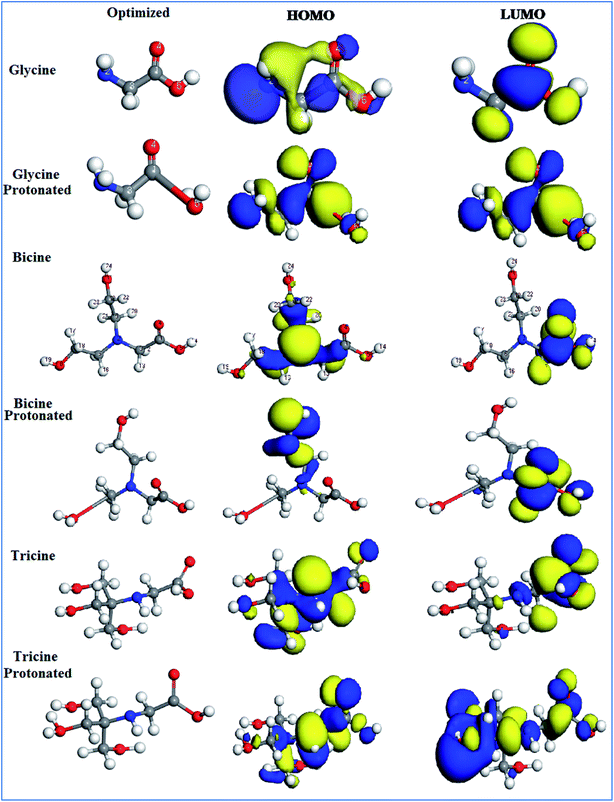 | ||
| Fig. 8 The optimized structures and the frontier molecular orbitals (HOMO and LUMO) for the gas, solvated and protonated species obtained with DFT/GGA/DNP 4.4. | ||
Monte Carlo (MC) simulations were performed to give a better insight into the inhibitor–Cu surface interaction. The optimization geometry for bicine, tricine, and glycine was performed before running the adsorption process. The adsorption locator model was applied to identify the perfect adsorption site for the Cu surface against the inhibitor molecule. To understand the perfect adsorption site, the following lowest calculated energies (kcal mol−1) are listed in Table 6: the total energy (substrate/adsorbate energy), rigid adsorption energy (unrelaxed adsorbate components adsorbed on the substrate), deformation energy (relaxed adsorbate components adsorbed on the substrate), adsorption energy (rigid adsorption energy + deformation energy), and (dEads/dNi) (metal–inhibitor energy, where one of the inhibitor molecules has been removed). The interaction between bicine and tricine with the Cu (111) plane for neutral species is presented in Fig. 9 as a representative. In addition, the adsorption energy against the Cu (111) surface for tricine was more than that for bicine (Table 6). This theoretical vision is in line with the obtained experimental data, where the lone pairs of e− for the N and O atoms of the investigated inhibitors enable a stable coordination interaction with the surface (inhibitor → Cu) through donating these electrons (lone pairs and π-electrons of C![[double bond, length as m-dash]](https://www.rsc.org/images/entities/char_e001.gif) O) to the d-orbitals of the Cu surface. From Fig. 9, we can observe that bicine and tricine are adsorbed on Cu (111) through the carboxyl group of the inhibitors. This will make the Cu surface not interact with the chloride solution. In conclusion, the adsorption process for the inhibitors was a side-by-side mode, which increased the coverage of the surface and thus led to high inhibition efficiency. The different energetic forms for both inhibitors (total adsorption, rigid adsorption, and deformation energies) exhibited negative values. The negative value of the adsorption energy for both inhibitors proved that the adsorption process takes place spontaneously. The order of binding energy (tricine > bicine > glycine) confirmed the order of the laboratory data.
O) to the d-orbitals of the Cu surface. From Fig. 9, we can observe that bicine and tricine are adsorbed on Cu (111) through the carboxyl group of the inhibitors. This will make the Cu surface not interact with the chloride solution. In conclusion, the adsorption process for the inhibitors was a side-by-side mode, which increased the coverage of the surface and thus led to high inhibition efficiency. The different energetic forms for both inhibitors (total adsorption, rigid adsorption, and deformation energies) exhibited negative values. The negative value of the adsorption energy for both inhibitors proved that the adsorption process takes place spontaneously. The order of binding energy (tricine > bicine > glycine) confirmed the order of the laboratory data.
| Inhibitor energy | Glycine | Bicine | Tricine | |||
|---|---|---|---|---|---|---|
| Species | Neutral | Protonated | Neutral | Protonated | Neutral | Protonated |
| Total energy | −3.614515 | −23.65612 | −33.6445 | −16.91 | −38.301 | −13.83 |
| Adsorption energy | −25.3002 | −197.681 | −48.8203 | −2926.69 | −183.711 | −7193.29 |
| Rigid adsorption energy | −23.5797 | −43.1209 | −46.3066 | −46.49 | −41.2363 | −22.85 |
| Deformation energy | −1.72057 | −154.56 | −2.5137 | −2880.19 | −142.476 | −7170.44 |
| dEad/dNi | −25.3002 | −197.681 | −48.8203 | −2926.69 | −183.713 | −7193.29 |
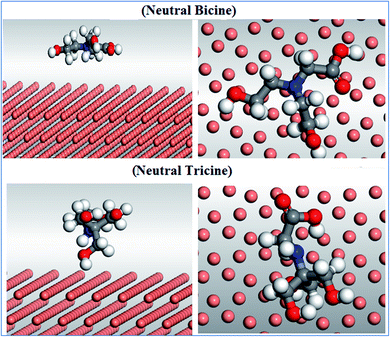 | ||
| Fig. 9 (Left) Side view and (right) top view of the molecular simulations for the most favorable modes of adsorption mode for the tested inhibitors on the Cu (111) surface for the neutral structure. | ||
4. Conclusion
Bicine and tricine were shown to be effective corrosion inhibitors for Cu corrosion compared to glycine in chloride solutions. The molecules acted like mixed-type inhibitors with inhibition efficiency of ∼98% in the presence of 5 mM tricine. The inhibition process was assigned to the adsorption property through the O atoms and/or the N atoms of the molecules on the active centers of the metal surface by the formation of a barrier film. The adsorption model obeyed the Langmuir adsorption isotherm and the calculated values of ΔGads for both inhibitors on Cu were in the range from −28 to −32 kJ mol−1, which indicated physical adsorption. A quantum simulation was performed by DFT calculations using both the GGA/DNP 4.4 levels. This calculation exhibited good agreement between the quantum indices and experimental data. The data extracted from the MC simulations demonstrated that both inhibitors could adsorb on the Cu surface by both the donation of the π-charge for carbonyl groups and the unshared pair of electrons.Conflicts of interest
The authors declare no conflict of interest.Acknowledgements
The author (Amr. Elgendy) wants to express his foremost gratitude to his father (Abd-el-Kader), mother, brothers, and his wife (Safa) for their patience and support.References
- Y. Feng, K.-S. Siow, W.-K. Teo, K.-L. Tan and A.-K. Hsieh, Corrosion, 1997, 53, 389–398 CrossRef CAS.
- M. Braun and K. Nobe, J. Electrochem. Soc., 1979, 126, 1666–1671 CrossRef CAS.
- G. Kear, B. Barker and F. Walsh, Corros. Sci., 2004, 46, 109–135 CrossRef CAS.
- A. Moreau, Electrochim. Acta, 1981, 26, 1609–1616 CrossRef CAS.
- H. Lee and K. Nobe, J. Electrochem. Soc., 1986, 133, 2035–2043 CrossRef CAS.
- H. Lee, K. Nobe and A. J. Pearlstein, J. Electrochem. Soc., 1985, 132, 1031–1037 CrossRef CAS.
- C. Deslouis, B. Tribollet, G. Mengoli and M. M. Musiani, J. Appl. Electrochem., 1988, 18, 374–383 CrossRef CAS.
- E. D'Elia, O. E. Barcia, O. R. Mattos, N. Pébère and B. Tribollet, J. Electrochem. Soc., 1996, 143, 961–967 CrossRef.
- M. Elmorsi and A. Hassanein, Corros. Sci., 1999, 41, 2337–2352 CrossRef CAS.
- W.-J. Lee, Mater. Sci. Eng. A, 2003, 348, 217–226 CrossRef.
- G. Moretti and F. Guidi, Corros. Sci., 2002, 44, 1995–2011 CrossRef CAS.
- J. Bartley, N. Huynh, S. Bottle, H. Flitt, T. Notoya and D. Schweinsberg, Corros. Sci., 2003, 45, 81–96 CrossRef.
- H. Ma, S. Chen, B. Yin, S. Zhao and X. Liu, Corros. Sci., 2003, 45, 867–882 CrossRef CAS.
- R. Vera, F. Bastidas, M. Villarroel, A. Oliva, A. Molinari, D. Ramírez and R. del Río, Corros. Sci., 2008, 50, 729–736 CrossRef CAS.
- M. Antonijevic and M. Petrovic, Int. J. Electrochem. Sci., 2008, 3, 1–28 CAS.
- Z. Zhang, S. Chen, Y. Li, S. Li and L. Wang, Corros. Sci., 2009, 51, 291–300 CrossRef CAS.
- H. O. Curkovic, E. Stupnisek-Lisac and H. Takenouti, Corros. Sci., 2009, 51, 2342–2348 CrossRef.
- M. Finšgar and I. Milošev, Corros. Sci., 2010, 52, 2737–2749 CrossRef.
- A. Al-Sabagh, M. Migahed, S. Sadeek and N. El Basiony, Egypt. J. Pet., 2018, 27, 811–821 CrossRef.
- W. Badawy, F. Al-Kharafi and E. Al-Hassan, Corros. Prev. Control, 1998, 45, 145–155 CAS.
- W. A. Badawy, K. M. Ismail and A. M. Fathi, Electrochim. Acta, 2006, 51, 4182–4189 CrossRef CAS.
- N. Helal, M. El-Rabiee, G. M. A. El-Hafez and W. Badawy, J. Alloys Compd., 2008, 456, 372–378 CrossRef CAS.
- M. El-Rabiee, N. Helal, G. M. A. El-Hafez and W. Badawy, J. Alloys Compd., 2008, 459, 466–471 CrossRef CAS.
- N. Helal and W. Badawy, Electrochim. Acta, 2011, 56, 6581–6587 CrossRef CAS.
- R. M. El-Sherif and W. A. Badawy, Int. J. Electrochem. Sci., 2011, 6, 6469–6482 CAS.
- G. M. A. El-Hafez and W. A. Badawy, Electrochim. Acta, 2013, 108, 860–866 CrossRef.
- N. M. El Basiony, A. Elgendy, A. E. El-Tabey, A. M. Al-Sabagh, G. M. Abd El-Hafez, M. A. El-raouf and M. A. Migahed, J. Mol. Liq., 2019, 111940, DOI:10.1016/j.molliq.2019.111940.
- A. Elgendy, A. Elkholy, N. El Basiony and M. Migahed, J. Mol. Liq., 2019, 285, 408–415 CrossRef CAS.
- N. E. Basiony, A. Elgendy, H. Nady, M. Migahed and E. Zaki, RSC Adv., 2019, 9, 10473–10485 RSC.
- D. S. Chauhan, A. M. Kumar and M. Quraishi, Chem. Eng. Res. Des., 2019, 150, 99–115 CrossRef CAS.
- D. S. Chauhan, M. Quraishi, C. Carrière, A. Seyeux, P. Marcus and A. Singh, J. Mol. Liq., 2019, 111113 CrossRef CAS.
- D.-q. Zhang, L.-x. Gao and G.-d. Zhou, Appl. Surf. Sci., 2004, 225, 287–293 CrossRef CAS.
- M. M. Antonijević, S. M. Milić and M. B. Petrović, Corros. Sci., 2009, 51, 1228–1237 CrossRef.
- H. Huang, Z. Wang, Y. Gong, F. Gao, Z. Luo, S. Zhang and H. Li, Corros. Sci., 2017, 123, 339–350 CrossRef CAS.
- K. El Mouaden, B. El Ibrahimi, R. Oukhrib, L. Bazzi, B. Hammouti, O. Jbara, A. Tara, D. S. Chauhan and M. A. Quraishi, Int. J. Biol. Macromol., 2018, 119, 1311–1323 CrossRef CAS.
- E.-S. M. Sherif, Appl. Surf. Sci., 2006, 252, 8615–8623 CrossRef CAS.
- L. Hu, S. Zhang, W. Li and B. Hou, Corros. Sci., 2010, 52, 2891–2896 CrossRef CAS.
- M. Scendo, Corros. Sci., 2008, 50, 1584–1592 CrossRef CAS.
- N. Hajjaji, I. Rico, A. Srhiri, A. Lattes, M. Soufiaoui and A. Ben Bachir, Corrosion, 1993, 49, 326–334 CrossRef CAS.
- H. M. A. El-Lateef, Corros. Sci., 2015, 92, 104–117 CrossRef.
- W. A. Badawy, K. M. Ismail and A. M. Fathi, J. Appl. Electrochem., 2005, 35, 879–888 CrossRef CAS.
- W. A. Badawy, K. M. Ismail and A. M. Fathi, Electrochim. Acta, 2005, 50, 3603–3608 CrossRef CAS.
- W. Badawy, M. El-Rabiei and H. Nady, Electrochim. Acta, 2014, 120, 39–45 CrossRef CAS.
- E. Sherif and S.-M. Park, Electrochim. Acta, 2006, 51, 6556–6562 CrossRef CAS.
- M. Scendo, Corros. Sci., 2005, 47, 1738–1749 CrossRef CAS.
- K. Hladky, L. Callow and J. Dawson, Br. Corros. J., 1980, 15, 20–25 CrossRef CAS.
- A. Bohe, J. Vilche, K. Jüttner, W. Lorenz and W. Paatsch, Electrochim. Acta, 1989, 34, 1443–1448 CrossRef CAS.
- Impedance Spectroscopy: Emphasizing Solid Materials and Systems, ed. J. R. Macdonald, Wiley-Interscience, John Wiley and Sons, New York, 1987, pp. 1–346 Search PubMed.
- K. M. Ismail, A. M. Fathi and W. A. Badawy, Corros. Sci., 2006, 48, 1912–1925 CrossRef CAS.
- L. Muresan, S. Varvara, E. Stupnišek-Lisac, H. Otmačić, K. Marušić, S. Horvat-Kurbegović, L. Robbiola, K. Rahmouni and H. Takenouti, Electrochim. Acta, 2007, 52, 7770–7779 CrossRef CAS.
- D.-Q. Zhang, Q.-R. Cai, L.-X. Gao and K. Y. Lee, Corros. Sci., 2008, 50, 3615–3621 CrossRef CAS.
- M. Hosseini, S. F. Mertens and M. R. Arshadi, Corros. Sci., 2003, 45, 1473–1489 CrossRef CAS.
- N. M. El Basiony, A. Elgendy, H. Nady, M. A. Migahed and E. G. Zaki, RSC Adv., 2019, 9, 10473–10485 RSC.
- M. A. Migahed, A. elgendy, M. M. El-Rabiei, H. Nady and E. G. Zaki, J. Mol. Struct., 2018, 1159, 10–22 CrossRef CAS.
- M. Migahed, M. El-Rabiei, H. Nady, A. Elgendy, E. Zaki, M. Abdou and E. Noamy, Journal of Bio-and Tribo-Corrosion, 2017, 3, 31 CrossRef.
- J. Barriga, B. Coto and B. Fernandez, Tribol. Int., 2007, 40, 960–966 CrossRef CAS.
- K. Fukui, science, 1982, 218, 747–754 CrossRef CAS.
- S. A. Wildman and G. M. Crippen, J. Chem. Inf. Comput. Sci., 1999, 39, 868–873 CrossRef CAS.
- I. Obot and N. Obi-Egbedi, Corros. Sci., 2010, 52, 198–204 CrossRef CAS.
- H. Ju, Z.-P. Kai and Y. Li, Corros. Sci., 2008, 50, 865–871 CrossRef CAS.
| This journal is © The Royal Society of Chemistry 2019 |


