 Open Access Article
An eco-friendly imprinted polymer based on graphene quantum dots for fluorescent detection of p-nitroaniline
Lei Caia,
Zhaohui Zhang *abc,
Haimei Xiaoa,
Shan Chena and
Jinli Fua
aNational Demonstration Center for Experimental Chemistry Education, College of Chemistry and Chemical Engineering, Jishou University, Jishou 416000, China. E-mail: zhaohuizhang77@163.com; Fax: +86-743-8563911; Tel: +86-743-8563911
bState Key Laboratory of Chemo/Biosensing and Chemometrics, Hunan University, Changsha 410082, China
cKey Laboratory of Mineral Cleaner Production and Exploit of Green Functional Materials in Hunan Province, Jishou University, Jishou 416000, China
First published on 13th December 2019
Abstract
An eco-friendly fluorescent molecularly imprinted polymer anchored on the surface of graphene quantum dots (GQDs@MIP) was developed with an efficient sol–gel polymerization for highly sensitive and selective determination of p-nitroaniline (p-NA). The GQDs@MIP was characterized in detail by Fourier-transform infrared, fluorescence spectrometer, scanning electron microscope, transmission electron microscope and ultraviolet spectrophotometer. The results showed that the imprinted layer was successfully grafted on the surface of the GQDs. The fluorescence of the GQDs@MIP is efficiently quenched when p-NA recombines with the imprinting sites based on the photo-induced electron transfer fluorescence quenching mechanism. A good linear relationship was obtained between the fluorescence quenching efficiency of the GQDs@MIP and the concentration of p-NA in the range of 0–15.0 μM with a correlation coefficient of 0.99. The practicability of the proposed method in real samples was successfully evaluated through monitoring p-NA in water and fish samples with satisfactory recovery. The developed method provides a feasible and eco-friendly strategy to fabricate MIPs anchored on GQDs with good fluorescence properties for sensitive detection of organic pollutants in complex samples.
1. Introduction
p-Nitroaniline (p-NA), an important raw chemical in the manufacture of printing inks, dyes and pharmaceuticals, is an aromatic amine derivative with high toxicity.1 As a toxic and poorly degradable compound, p-NA tends to accumulate in the environment, which carries potential risks to the human cardiovascular and central nervous systems as well as the environment.2 Therefore, developing effective analytical methods for the monitoring of residual p-NA is very important. Several effective analytical techniques, such as chromatography,3,4 electrochemistry,5 and colorimetry,6 have been used for the monitoring of p-NA, but these methods demand complicated sample pre-treatments and are time-consuming. Compared with the above-mentioned techniques, fluorescence analysis has significant advantages, including high sensitivity, time-saving and low analysis cost.7 Currently, luminescent quantum dots (QDs) are often used as traditional fluorescent materials in fluorescence analysis owing to their distinct optical performance involving quantum size effect, narrow and tunable emission spectra, and good photostability.8Molecular imprinting imitates the natural antibody–antigen model for the synthesis of molecularly imprinted polymers (MIPs) with specific identification ability for the template.9,10 Recently, MIPs have aroused extensive attention owing to their physical robustness, desired selectivity and satisfactory practicability. Many QDs–MIP composites have been reported and they incorporate the high selectivity of MIPs and the excellent fluorescent property of QDs. Jia et al. reported a mesoporous fluorescent MIP structure based on QDs for the selective and sensitive detection of 2,4-dichlorophenoxyacetic acid.11 Yu et al. developed MIPs for fluorescent detection of 4-nitrophenol using 2-aminoethyl methacrylate hydrochloride-modified QDs as the core support and fluorescence signal source.12 Wang et al. constructed a ratiometric fluorescent MIPs sensor based on green and red CdTe QDs for the visual detection of bovine hemoglobin.13 However, the traditional QDs contain heavy metals (such as Cd, Hg), which has restricted their application to some extent owing to the potential environmental risk.14
Graphene quantum dots (GQDs), as novel carbon-based quantum dots with graphene sheets of less than 100 nm, were first synthesized by Ponomarenko et al. in 2008.15 Owing to their merits of low toxicity, good biocompatibility, resistance to photobleaching, stable luminescence, high specific surface area, and abundant surface functional groups,16,17 GQDs have been shown to be potential candidates in the fields of photovoltaic devices, nanosensors, and bioimaging.18,19 GQDs have been prepared by various methods, such as microwave,20 electrochemical,21 thermal pyrolysis,22 exfoliation,23 and solvothermal treatment24 However, most of those methods usually involve expensive starting materials, tedious processes, and complex syntheses.25
In this study, we developed an eco-friendly imprinted polymer anchored on GQDs for fluorescent detection of p-NA using a facile method. Firstly, the highly luminescent GQDs were fabricated through a one-pot hydrothermal reaction between citric acid and urea without expensive reagents, strong acids or alkalis, or organic solvents. Then, the GQDs@MIP was synthesized by coating an MIP layer on the surface of the GQDs through sol–gel method. In our design strategy, the GQDs serve as the signal component while the MIP layer act as the recognition element. The eco-friendly GQDs@MIP was endowed with the excellent sensitivity of GQDs and the outstanding selectivity of MIPs. Moreover, the GQDs@MIP was successfully applied to detect p-NA in water and fish samples with satisfactory results, suggesting its potential value for the accurate quantification and specific recognition of p-NA in complex matrices.
2. Experimental section
2.1 Materials and chemicals
Citric acid (CA), urea, and 3-aminopropyl triethoxysilane (APTES) were supplied by Aladdin Agent Co. (Shanghai, China). Ammonium hydroxide (NH3·H2O, 25%), anhydrous ethanol, and tetraethylorthosilicate (TEOS) were purchased from Changsha Chemical Reagent Co. (Changsha, China). p-Nitroaniline (p-NA), o-nitrophenol (2-NP), m-nitrophenol (3-NP), p-aminobenzoic acid (PABA), carboxybenzene, and 3,5-dinitrosalicylic acid were obtained from Tianjin Guangfu Reagent Co. Ltd (Tianjin, China). All reagents were of analytical grade.2.2 Instrumentation
Fourier-transform infrared spectra were measured using an IRAffinity-1 spectrophotometer (Shimadzu, Japan). Fluorescence was recorded on an F-7000 spectrofluorometer (Hitachi, Japan). The morphology of the polymer was characterized by scanning electron microscopy (SEM, Zeiss-Sigma HD, Germany) with an energy dispersive X-ray detector (EDS) and transmission electron microscopy (TEM, FEI Tecnai G2 F20, USA).2.3 Synthesis of GQDs
The GQDs were synthesized according to the previous literature with some modification.26 Briefly, 0.08 g of CA and 0.15 g of urea were dissolved in 100.0 mL of deionized water to form a clear solution. Then the solution was loaded into a Teflon-lined stainless steel autoclave at 180 °C for 90 min. Finally, the GQDs solution was stored in a refrigerator at 4 °C for further use.2.4 Synthesis of GQDs@MIP
The imprinted layer was coated on the GQDs via sol–gel polymerization technique. In brief, 10.0 mg of p-NA and 0.15 mL of APTES were dispersed in 10.0 mL of anhydrous ethanol under stirring for 30 min. After that, 0.20 mL of TEOS, 0.10 mL of NH3·H2O, and 5.0 mL of GQDs solution were added successively under mild stirring at room temperature for 12 h. The obtained GQDs@MIP was centrifuged and washed repeatedly with ethanol until no template was detected in the supernatant. Finally, the product was dried at 40 °C for 2 h in an oven. Moreover, the non-imprinted polymer anchored on GQDs (GQDs@NIP) was synthesized using the same method without the template.2.5 Fluorescence measure
GQDs@MIP and GQDs@NIP solutions (1.0 mg mL−1) were prepared by dispersion in deionized water. Then a p-NA solution with a known concentration was added into the GQDs@MIP and GQDs@NIP solutions. The change in the fluorescence intensity of the mixture solution was measured using an F-7000 spectrofluorometer. All fluorescence measurements were carried out under the same conditions, with an excitation wavelength of 365 nm and an emission wavelength range of 400–650 nm. The excitation and emission slit widths were both 5 nm and the photomultiplier tube voltage was set at 550 V.2.6 Analysis of real samples
Water and fish samples were utilized to examine the practical applicability of the GQDs@MIP for the detection of p-NA. Tap water was acquired from the lab and lake water was collected from Tonghe Lake, which is located in the city of Jishou. All water samples were filtered using a 0.45 μm microfiltration membrane to remove suspended particles before use. Fish samples were extracted according to previous reports.27 Firstly, 1.0 g of skinless muscle tissue homogenate was mixed with 5.0 mL of acetonitrile. After centrifugation (8000 rpm, 5 min), the supernatant was diluted with water to 200.0 mL. The recovery study was implemented with different spiked concentrations of p-NA to validate the accuracy and applicability of the GQDs@MIP.3. Results and discussion
3.1 Preparation of GQDs@MIP
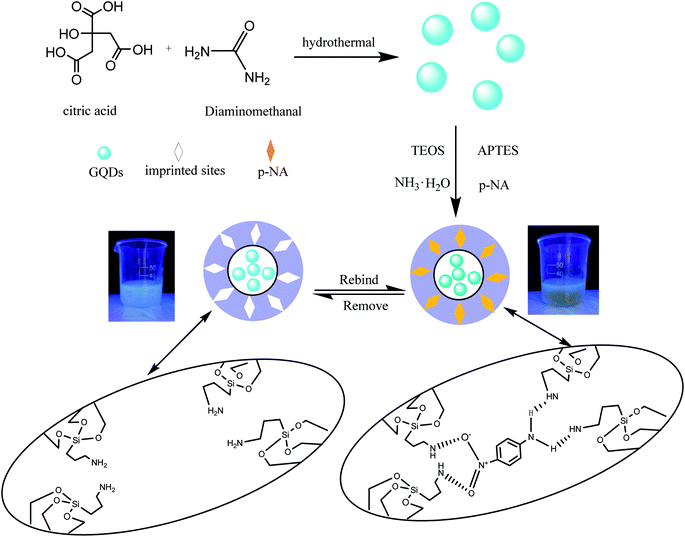
The preparation of GQDs@MIP is illustrated in Fig. 1. The highly luminescent GQDs were firstly formed through a rapid and simple one-pot hydrothermal method with citric acid and urea as the precursors.26 Then an imprinted layer was introduced onto the surface of the GQDs via sol–gel technology using APTES as the functional monomer and TEOS as the cross-linker. Finally, the GQDs@MIP with high recognition capacity for p-NA was obtained after the removal of p-NA. The synthesized GQDs@MIP has a symmetric emission at 443 nm when the excitation wavelength is set to 365 nm.In addition, the effect of the monomer to cross-linker ratio was evaluated to obtain GQDs@MIP with high fluorescence quenching efficiency. As shown in Fig. 2, when the ratio of the monomer to the cross-linker was increased from 1![[thin space (1/6-em)]](https://www.rsc.org/images/entities/char_2009.gif) :
:![[thin space (1/6-em)]](https://www.rsc.org/images/entities/char_2009.gif) 4 to 3
4 to 3![[thin space (1/6-em)]](https://www.rsc.org/images/entities/char_2009.gif) :
:![[thin space (1/6-em)]](https://www.rsc.org/images/entities/char_2009.gif) 4, the fluorescence quenching efficiency of the GQDs@MIP increased. The fluorescence quenching efficiency of the GQDs@MIP then decreased as the ratio of monomer to cross-linker was further increased. With the lower ratio of monomer to cross-linker, excessive cross-linker potentially leads to an increase in the degree of cross-linking of polymers, which hinders the template binding with the monomer. With the higher ratio of monomer to cross-linker, excess monomer will be irregularly distributed around the polymer, leading to increased non-specific adsorption of the polymer, which also results in lower fluorescence quenching efficiency of the GQDs@MIP.28 Thus, a monomer to cross-linker ratio of 3
4, the fluorescence quenching efficiency of the GQDs@MIP increased. The fluorescence quenching efficiency of the GQDs@MIP then decreased as the ratio of monomer to cross-linker was further increased. With the lower ratio of monomer to cross-linker, excessive cross-linker potentially leads to an increase in the degree of cross-linking of polymers, which hinders the template binding with the monomer. With the higher ratio of monomer to cross-linker, excess monomer will be irregularly distributed around the polymer, leading to increased non-specific adsorption of the polymer, which also results in lower fluorescence quenching efficiency of the GQDs@MIP.28 Thus, a monomer to cross-linker ratio of 3![[thin space (1/6-em)]](https://www.rsc.org/images/entities/char_2009.gif) :
:![[thin space (1/6-em)]](https://www.rsc.org/images/entities/char_2009.gif) 4 was selected as optimal.
4 was selected as optimal.
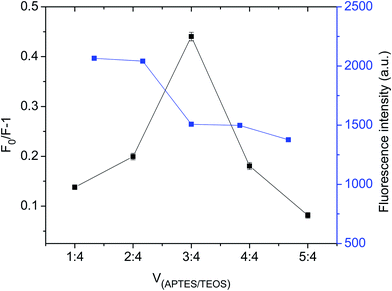 | ||
| Fig. 2 Fluorescence intensity and fluorescence quenching capability of GQDs@MIP with different volume ratios of monomer to cross-linker. | ||
3.2 Characterization
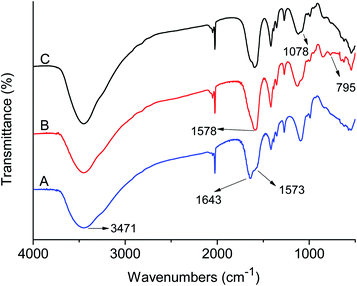
FI-IR spectra of the GQDs, GQDs@MIP and GQDs@NIP are depicted in Fig. 3. The prepared GQDs have characteristic peaks at 3471 cm−1, 1643 cm−1, and 1573 cm−1, which belong to the N–H stretching vibration and vibrational absorption for the C![[double bond, length as m-dash]](https://www.rsc.org/images/entities/char_e001.gif) O in the COOH and CONH, respectively. The data were similar to the previous literature,26 suggesting that the GQDs were synthesized successfully. Compared with the GQDs, the GQDs@MIP exhibited new peaks at 1078 cm−1 and 781 cm−1, which were assigned to Si–O–Si asymmetric stretching and Si–O vibration,29 indicating that the imprinted layer was generated successfully. Moreover, the GQDs@NIP and GQDs@MIP showed similar locations for the major bands owing to the same compositions.30
O in the COOH and CONH, respectively. The data were similar to the previous literature,26 suggesting that the GQDs were synthesized successfully. Compared with the GQDs, the GQDs@MIP exhibited new peaks at 1078 cm−1 and 781 cm−1, which were assigned to Si–O–Si asymmetric stretching and Si–O vibration,29 indicating that the imprinted layer was generated successfully. Moreover, the GQDs@NIP and GQDs@MIP showed similar locations for the major bands owing to the same compositions.30
The morphological structures of the GQDs, GQDs@MIP and GQDs@NIP were investigated in detail by SEM and TEM. As shown in Fig. 4A and B, both the GQDs@MIP and GQDs@NIP exhibited monodispersed microspheres with an average diameter of 60 nm, which was attributed to the same synthesis process. Furthermore, the TEM images of the GQDs and GQDs@MIP shown in Fig. 4C and D demonstrate that the GQDs were well dispersed with an average diameter of 5 nm and the GQDs@MIP has a core–shell structure with average size of 60 nm. Compared with the original GQDs, the GQDs@MIP particle diameter had increased significantly, which indicated that the imprinted layer was synthesized successfully on the surface of the GQDs.
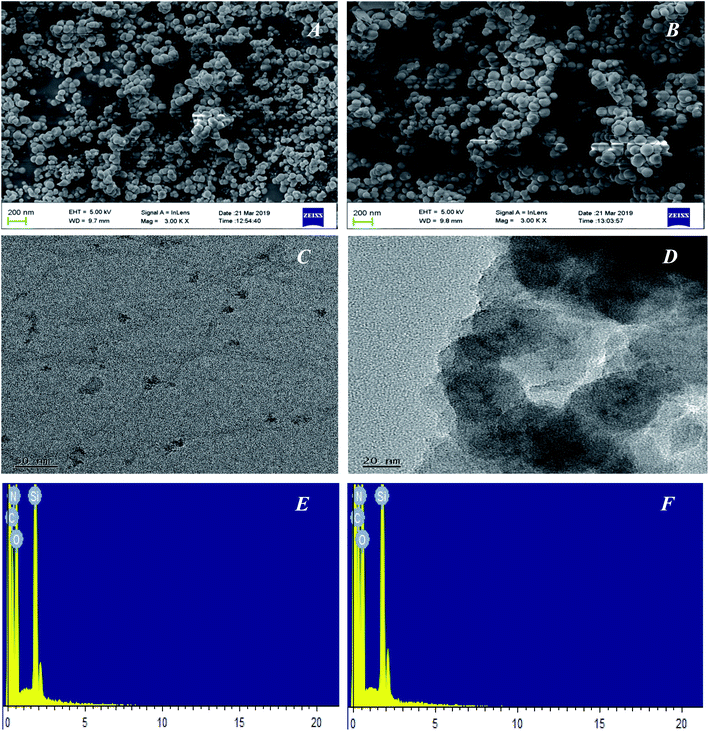 | ||
| Fig. 4 SEM image of the GQDs@MIP (A) and GQDs@MIP (B); TEM images of the GQDs (C) and GQDs@MIP (D); EDS image of the GQDs@MIP (E) and GQDs@NIP (F). | ||
The elemental contents of GQDs@MIP and GQDs@NIP were also investigated through EDS. As shown in Fig. 4E and F, the characteristic bands of C, N, O, and Si were both present in the GQDs@MIP and GQDs@NIP. For the GQDs@MIP, the percentages of C, N, O, and Si were 35.06%, 18.14%, 39.86% and 6.94%, respectively. For GQDs@NIP, the percentages of C, N, O, and Si were 36.51%, 18.92%, 39.40% and 5.18%, respectively. The presence of these elements indicated that the surface of the GQDs has been successfully modified by the imprinted layer.
3.3 Effects of pH
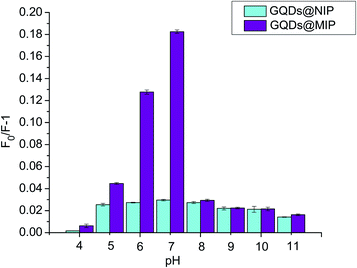
The binding affinity of the GQDs@MIP was investigated in solutions of different pHs since the binding affinity of the GQDs@MIP toward the template is sensitive to the surrounding environment. The pH of the solution was adjusted with 2.0 mM HCl and NaOH. As shown in Fig. 5, the maximum binding affinity of the GQDs@MIP appeared when the pH value was 7.0. The binding affinity decreased under acidic conditions because the structure of the GQDs was destroyed, which will cause a reduction of the signal output. The binding affinity also reduced when the solution pH was greater than 7.0, owing to the silica shell being eroded in the highly alkaline environment, which can destroy the framework of the binding sites.31 Moreover, the binding affinity of the GQDs@NIP was less than that of the GQDs@MIP under the same conditions, which was attributed to the imprinted site on the surface of the GQDs@MIP with memory for p-NA. Therefore, a pH of 7.0 was chosen for the detection.3.4 Response time
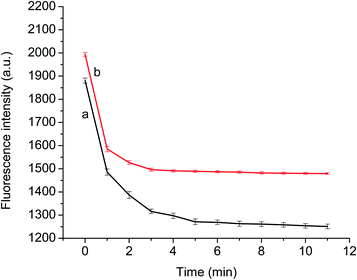
To ensure the completion of binding between p-NA and the recognition site of the GQDs@MIP, the fluorescence variation of the GQDs@MIP was investigated at different time intervals in the presence of p-NA. As shown in Fig. 6, the fluorescence intensity of both the GQDs@MIP and the GQDs@NIP was significantly quenched in the initial 3 min. The decline in fluorescence began to slow down in the remaining time. The fluorescence intensity of the GQDs@NIP became flat at 4 min and the GQDs@MIP reached equilibrium at 5 min. The difference in response time resulted from the presence of holes with multiple active sites on the imprinted surface of GQDs@MIP, which will present specific binding affinity toward p-NA. Therefore, 5 min was selected as the response time in the following experiment.3.5 Fluorescence detection of p-NA by GQDs@MIP
Fig. 7 exhibits the fluorescence spectra of the GQDs@NIP and GQDs@MIP after and before the removal of p-NA. The fluorescence intensity of the GQDs@MIP containing the template was about 18.0% of the fluorescence intensity of the GQDs@NIP, while the fluorescence intensity of the GQDs@MIP increased significantly after removal of the template, reaching 91.0% of the fluorescence intensity of the GQDs@NIP. This indicated that the GQDs@MIP was successfully synthesized. To further study the recognition ability of the GQDs@MIP toward p-NA, the fluorescence spectra of the GQDs@MIP and GQDs@NIP were investigated in different concentrations of p-NA. As displayed in Fig. 8a and b, the fluorescence intensity of both the GQDs@MIP and the GQDs@NIP was quenched in the presence of p-NA. It is interesting that the quenching efficiency of the GQDs@MIP was more than that of the GQDs@NIP because the imprinted sites on the surface of the GQDs@MIP have recognition memory toward p-NA. In addition, the fluorescence quenching of the GQDs@MIP and GQDs@NIP can be described with the Stern–Volmer equation.32–34| F0/F = 1 + KSV[C] |
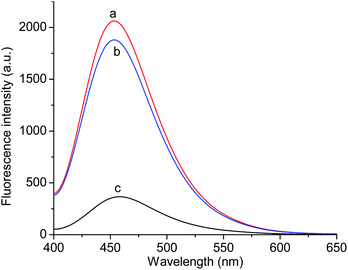 | ||
| Fig. 7 Fluorescence spectra of the GQDs@NIP (a) and the GQDs@MIP after (b) and before (c) removal of the template molecule. | ||
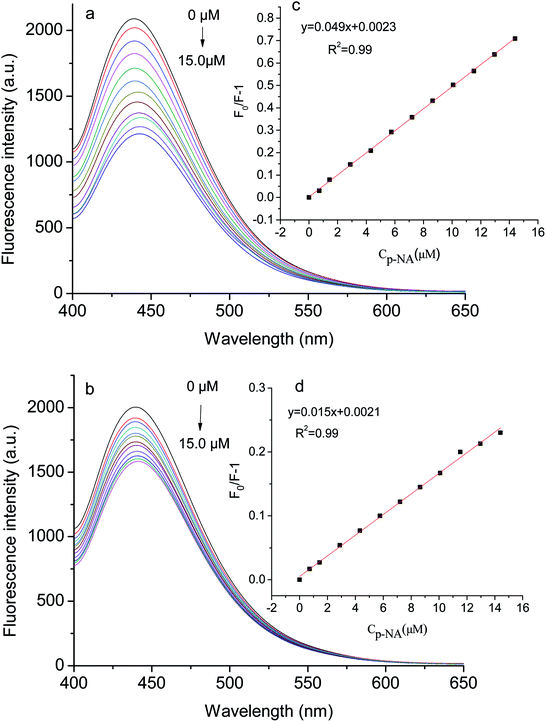 | ||
| Fig. 8 Fluorescence spectra of the GQDs@MIP (a) and GQDs@NIP (b) with different concentrations of p-NA; insets of Stern–Volmer equation for the GQDs@MIP (c) and GQDs@NIP (d) with p-NA. | ||
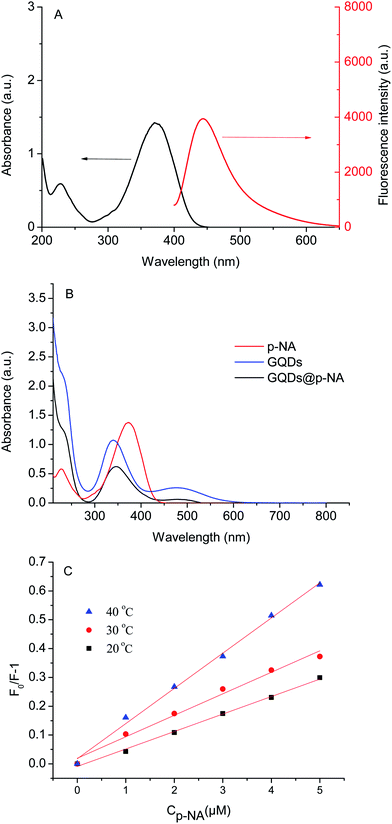
The UV/vis absorption spectrum of p-NA and the fluorescence spectrum of the GQDs are shown in Fig. 9A. There is no overlap of peaks, which suggests that the fluorescence quenching mechanism is probably charge transfer in this experiment.35 In addition, the fluorescence quenching can be divided into static quenching and dynamic quenching. Static quenching occurs when a non-fluorescence complex is formed between the fluorophore and the quenching agent. With the formation of the complex, a chemical change occurs and the UV/vis absorption spectra of the molecules are affected. Dynamic quenching is a phenomenon whereby the random collisions of the quenching agent deactivate the excited state of the fluorophore. During this process, the chemical change does not happen and the UV/vis absorption spectra of the molecules are not affected. As shown in Fig. 9B, the UV/vis absorption spectrum of the GQDs@p-NA was similar to the absorption spectra of the GQDs and p-NA, suggesting that the quenching was dynamic. The mechanism was further validated by a temperature-dependent experiment. As shown in Fig. 9C, the fluorescence quenching ability increased with the increment of temperature, which was owing to the increased probability of random collisions between the p-NA and GQDs at higher temperatures.36
3.6 Selectivity of the GQDs@MIP
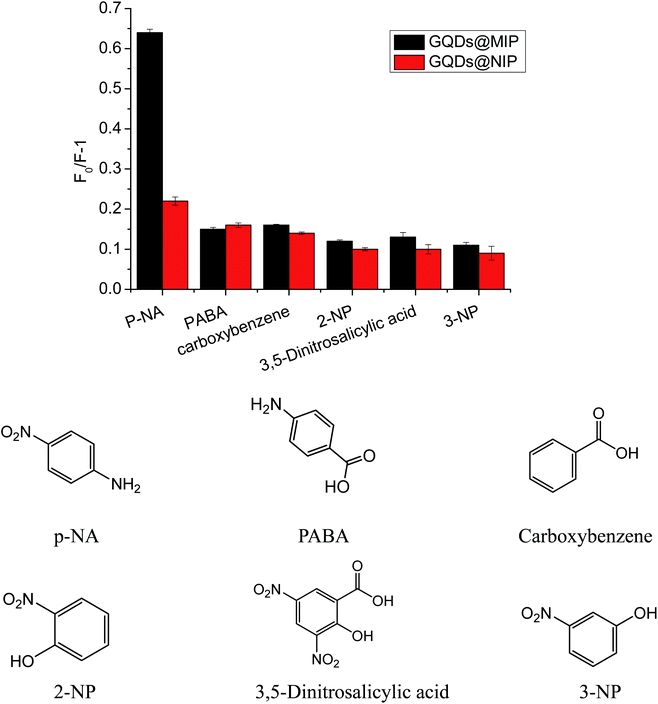
In order to demonstrate the selectivity of our proposed GQDs@MIP, various structural analogs such as 2-NP, 3-NP, PABA, carboxybenzene, and 3,5-dinitrosalicylic acid, were investigated. As shown in Fig. 10, the GQDs@MIP gave the highest fluorescence quenching response toward p-NA compared to other structural analogs owing to the surface of the GQDs@MIP having an imprinted cavity that is only suitable for p-NA. However, the GQDs@NIP showed a similar response to all of the analytes, suggesting that the GQDs@NIP is unable to effectively distinguish p-NA. The data indicated that the GQDs@MIP has high selectivity toward p-NA.3.7 Practical application
To assess the applicability and availability of the proposed GQDs@MIP, a recovery experiment was implemented in water and fish samples by spiking with different concentrations of p-NA. As shown in Table 1, the standard addition recoveries were 96.7–104.0%, demonstrating that the developed GQDs@MIP was practically feasibly for the accurate determination of p-NA in complex samples.| Sample | Added (μM) | Found (μM) | Recovery (%) |
|---|---|---|---|
| Tap water | 0.7 | 0.71 ± 0.02 | 101.4 |
| 1.5 | 1.46 ± 0.01 | 97.3 | |
| 3.0 | 3.10 ± 0.01 | 103.3 | |
| Lake water | 0.7 | 0.68 ± 0.02 | 97.1 |
| 1.5 | 1.50 ± 0.02 | 100.0 | |
| 3.0 | 2.90 ± 0.01 | 96.7 | |
| Carp | 0.7 | 0.69 ± 0.04 | 98.5 |
| 1.5 | 1.56 ± 0.01 | 104.0 | |
| 3.0 | 3.07 ± 0.03 | 102.3 |
Furthermore, the performance of this proposed GQDs@MIP was compared with other reported methods for the detection of p-NA. As shown in Table 2, our developed GQDs@MIP system was endowed with a wider linear range as well as high sensitivity, low cost and a simple synthetic process. The limit of detection (LOD) of our method is 7.0 nM, which is better than those for the other reported methods. In addition, the GQDs@MIP was successfully applied to the determination of p-NA in water and fish samples without complicated sample pretreatment processes, proving that it is a feasible candidate for the selective and sensitive detection of p-NA in complex environments.
| Methods | Linear range | Detection limit | Real sample | Ref. |
|---|---|---|---|---|
| Triphenylamine-functionalized luminescent sensor | 0–122.0 μM | 72.0 nM | — | 37 |
| Glassy carbon electrode | 0.01–7.0 μM | 8.0 nM | Lake water | 38 |
| Fluorescence probe-based nitrogen-doped carbon dots | 0–50.0 mM | 1.0 μM | Lake water, soil | 39 |
| MIPIL microspheres | 10.0 nM to 10.0 M | 9.0 nM | Waste water | 40 |
| GQDs@MIP | 0–15.0 μM | 7.0 nM | Tap water, lake water, fish | This work |
4. Conclusions
In conclusion, an eco-friendly GQD-based fluorescent imprinted polymer was prepared for the sensitive and selective detection of p-NA. The fluorescence intensity of the GQDs@MIP was quenched linearly in the p-NA concentration range of 0–15.0 μM with a detection limit of 7.0 nM. The developed GQDs@MIP presented good recoveries in water and fish sample analyses. This method provides an alternative route for facile, low-cost and sensitive detection of trace pollutants in the environment.Conflicts of interest
All the authors declare no conflict of interest.Acknowledgements
This work is supported by the National Natural Science Foundation of China (No. 21767011 and 21565014), the Innovation Fund Designated for Graduate Students of Jishou University (JDY21), the National Experimental Teaching Demonstration Center of Chemistry of Jishou University (2018ZXCX25) and JSU MnZn V Collaborative Innovation Center Graduate Research Innovation (2018mzvg003).References
- S. Gautam, S. P. Kamble, S. B. Sawant and V. G. Pangarkar, Chem. Eng. J., 2005, 110, 129–137 CrossRef CAS.
- R. Ahmad, N. Tripathy, M. S. Ahn and Y. B. Hahn, J. Colloid Interface Sci., 2017, 494, 300–306 CrossRef CAS PubMed.
- K. Guo and Y. Chen, Anal. Methods, 2010, 2, 1156–1159 RSC.
- H. F. Schröder, J. Chromatogr. A, 1997, 777, 127–139 CrossRef.
- M. H. A. Zavar, S. Heydari, G. H. Rounaghi, H. Eshghi and H. Azizi-Toupkanloo, Anal. Methods, 2012, 4, 953–958 RSC.
- M. Alcalde, T. Bulter and F. H. Arnold, J. Biomol. Screening, 2002, 7, 547 CrossRef CAS PubMed.
- S. Xu, J. Ding and L. Chen, Anal. Bioanal. Chem., 2018, 410, 7103–7112 CrossRef CAS PubMed.
- X. Wang, J. Yu, J. Li, Q. Kang, D. Shen and L. Chen, Sens. Actuators, B, 2018, 255, 268–274 CrossRef CAS.
- L. Chen, X. Wang, W. Lu, X. Wu and J. Li, Chem. Soc. Rev., 2016, 45, 2137–2211 RSC.
- Q. Yang, J. Li, X. Wang, H. Peng, H. Xiong and L. Chen, Biosens. Bioelectron., 2018, 112, 54–71 CrossRef CAS PubMed.
- M. Jia, Z. Zhang, J. Li, H. Shao, L. Chen and X. Yang, Sens. Actuators, B, 2017, 252, 934–943 CrossRef CAS.
- J. Yu, X. Wang, Q. Kang, J. Li, D. Shen and L. Chen, Environ. Sci.: Nano, 2017, 4, 493–502 RSC.
- X. Wang, S. Yu, W. Liu, L. Fu, Y. Wang, J. Li and L. Chen, ACS Sens., 2018, 3, 378–385 CrossRef CAS PubMed.
- S. Liu, F. Shi, X. Zhao, L. Chen and X. Su, Biosens. Bioelectron., 2013, 47, 379–384 CrossRef CAS PubMed.
- L. A. Ponomarenko, F. Schedin, M. I. Katsnelson, R. Yang, E. W. Hill, K. S. Novoselov and A. K. Geim, Science, 2008, 320, 356–358 CrossRef CAS PubMed.
- L. Tang, R. Ji, X. Cao, J. Lin, H. Jiang, X. Li and S. P. Lau, ACS Nano, 2012, 6, 5102–5110 CrossRef CAS PubMed.
- N. R. Nirala, S. Abraham, V. Kumar, A. Bansal, A. Srivastava and P. S. Saxena, Sens. Actuators, B, 2015, 218, 42–50 CrossRef CAS.
- B. Wang, S. Zhuo, L. Chen and Y. Zhang, Spectrochim. Acta, Part A, 2014, 131, 384–387 CrossRef CAS PubMed.
- L. Chen, C. Wu, P. Du, X. Feng, P. Wu and C. Cai, Talanta, 2017, 164, 100–109 CrossRef CAS PubMed.
- Z. Luo, D. Yang, G. Qi, J. Shang, H. Yang, Y. Wang and L. Wang, J. Mater. Chem. A, 2014, 2, 20605–20611 RSC.
- X. Tan, Y. Li, X. Li, S. Zhou, L. Fan and S. Yang, Chem. Commun., 2015, 51, 2544–2546 RSC.
- M. Zheng, Y. Li, S. Liu, W. Wang, Z. Xie and X. Jing, ACS Appl. Mater. Interfaces, 2016, 8, 23533–23541 CrossRef CAS PubMed.
- R. Liu, D. Wu, X. Feng and K. Müllen, J. Am. Chem. Soc., 2011, 133, 15221–15223 CrossRef CAS PubMed.
- R. Tian, S. Zhong, J. Wu, W. Jiang, Y. Shen and T. Wang, Opt. Mater., 2016, 60, 204–208 CrossRef CAS.
- D. Qu, M. Zheng, P. Du, Y. Zhou, L. Zhang, D. Li and Z. Sun, Nanoscale, 2013, 5, 12272–12277 RSC.
- T. Ogi, H. Iwasaki, K. Aishima, F. Iskandar, W. N. Wang, K. Takimiya and K. Okuyama, RSC Adv., 2014, 4, 55709–55715 RSC.
- J. Yang, Z. Z. Lin, H. P. Zhong, X. M. Chen and Z. Y. Huang, Sens. Actuators, B, 2017, 252, 561–567 CrossRef CAS.
- P. Raksawong, P. Nurerk, K. Chullasat, P. Kanatharana and O. Bunkoed, Microchim. Acta, 2019, 186, 338 CrossRef PubMed.
- L. Ming, H. Liu and X. Ren, Biosens. Bioelectron., 2016, 89, 899–905 Search PubMed.
- A. Sun, J. Chai, T. Xiao, X. Shi, X. Li and Q. Zhao, Sens. Actuators, B, 2018, 258, 408–414 CrossRef CAS.
- S. Sadeghi, M. Jahani and F. Belador, Spectrochim. Acta, Part A, 2016, 159, 83–89 CrossRef CAS PubMed.
- X. Wang, J. Yu, X. Wu, J. Fu, Q. Kang, D. Shen and L. Chen, Biosens. Bioelectron., 2016, 81, 438–444 CrossRef CAS PubMed.
- S. Huang, M. Guo, J. Tan, Y. Geng, J. Wu, Y. Tang and Y. Liang, ACS Appl. Mater. Interfaces, 2018, 10, 339056–339063 Search PubMed.
- X. Chen, Y. Luan, N. Wang, Z. Zhou, X. Ni, Y. Cao and W. Yang, J. Sep. Sci., 2018, 41, 4394–4401 CrossRef CAS PubMed.
- L. Zhang and L. Chen, ACS Appl. Mater. Interfaces, 2016, 8, 16248–16256 CrossRef CAS PubMed.
- X. Feng, J. Ashley, T. Zhou and Y. Sun, Microchim. Acta, 2018, 185, 500 CrossRef PubMed.
- N. N. Ji, Z. Q. Shi, H. L. Hu and H. G. Zheng, Dalton Trans., 2018, 47, 7222–7228 RSC.
- F. Zhao, L. Liu, F. Xiao, J. Li, R. Yan, S. Fan and B. Zeng, Electroanalysis, 2007, 19, 1387–1393 CrossRef CAS.
- H. Yuan, D. Li, Y. Liu, X. Xu and C. Xiong, Analyst, 2015, 140, 1428–1431 RSC.
- X. Lu, Y. Yang, Y. Zeng, L. Li and X. Wu, Biosens. Bioelectron., 2018, 99, 47–55 CrossRef CAS PubMed.
| This journal is © The Royal Society of Chemistry 2019 |

