 Open Access Article
Hydrothermal preparation of a platinum-loaded sulphated nanozirconia catalyst for the effective conversion of waste low density polyethylene into gasoline-range hydrocarbons†
Maisari Utami ab,
Wega Trisunaryantib,
Kenji Shidac,
Masayuki Tsushidac,
Hidetaka Kawakitad,
Keisuke Ohto
 d,
Karna Wijaya*b and
Masato Tominaga*d
aDepartment of Chemistry, Universitas Islam Indonesia, Yogyakarta 55584, Indonesia
bDepartment of Chemistry, Universitas Gadjah Mada, Yogyakarta 55281, Indonesia. E-mail: karnawijaya@ugm.ac.id
cFaculty of Engineering, Kumamoto University, Kumamoto 860-8555, Japan
dDepartment of Chemistry and Applied Chemistry, Saga University, Saga 840-8502, Japan. E-mail: masato@cc.saga-u.ac.jp
First published on 13th December 2019
Abstract
A platinum-loaded sulphated nanozirconia (Pt/nano ZrO2–SO4) bifunctional metal–acid catalyst was synthesized using a hydrothermal process. The nano ZrO2–SO4 was initially prepared by dispersing the nano ZrO2 in H2SO4, followed by wet impregnation via heating in an aqueous PtCl4 solution. This material was subsequently calcined and reduced under hydrogen gas to produce the catalyst. The Pt/nano ZrO2–SO4 was found to be a highly active, selective and stable solid acid catalyst for the conversion of waste low density polyethylene (LDPE) to high value hydrocarbons. The catalytic activity and stability of this material were evaluated during the hydrocracking of waste LDPE while optimizing the reaction temperature, time and catalyst-to-feed ratio. The activity of catalyst prepared by hydrothermal was attributed to highly dispersion of Pt species interacting with the support and inhibition of the agglomeration process. The impregnation method of hydrothermal generated highly active and selective catalyst with Pt loads of 1 wt%. The hydrocracking of waste LDPE over Pt/nanoZrO2–SO4 at 250 °C for 60 min with a catalyst-to-feed proportion of 1 wt% gave the largest gasoline fraction.
1. Introduction
Plastics are a subset of polymers that are widely used in a variety of applications throughout society.1 The usage of plastic products has steadily increased as a result of the unique and versatile properties of these materials, including high thermal and chemical resistance, significant tensile strength, good durability, low manufacturing costs and easy processability. Unfortunately, the accumulation of used plastics in municipal solid waste system leads to environmental issues because the majority of these substances are not biodegradable.2–4 For this reason, there have been significant research efforts aimed at developing efficient recycling methods for plastic waste, so as to realize substantial economic and environmental benefits.1One approach to plastic waste management that also addresses increasing energy demands is to produce fuel oils from this material. A number of research groups have reported that catalytic hydrocracking shows the highest potential with regard to developing successful plastics recycling processes.5–7 Hydrocracking converts larger hydrocarbon molecules into smaller compounds by simultaneous or sequential breaking of carbon bonds and hydrogenation.8,9 This technique is commonly applied during petroleum refining, but is also a promising method for recycling plastic waste.10,11
The application of metal-loaded zeolites to the hydrocracking of waste low density polyethylene (LDPE) typically requires high temperatures (≥350 °C) that can lead to the formation of coke deposits.12–14 This coke inhibits the mass transportation processes that accompany the hydrocracking reaction, such that the catalytic activity is greatly reduced and the useable lifespan of the catalyst is shortened. Therefore, it is necessary to inhibit coke deposition to prolong the life of the catalyst. Platinum-loaded sulphated zirconia (Pt/ZrO2–SO4) is well-known as a bifunctional metal–acid catalyst,15–17 and the presence of Pt and hydrogen during hydrocracking has the potential to renew active catalytic sites by hydrogenating coke.18–20
The impregnation method is most commonly used to load Pt onto the ZrO2–SO4, but the associated calcination step frequently leads to particle agglomeration that can decrease the catalytic activity due to a reduction in surface area. Hydrothermal impregnation is an alternative approach that avoids these issues by allowing control over processing variables such as aging time, reaction temperature and pressure.21 The other advantage of using hydrothermal methods is that materials can be produced in high purity with tuneable particle sizes and stable pore structures, using low temperatures and a simple preparation process.22 Furthermore, the hydrothermal reaction media have low viscosities and thus minimal resistance to mass transfer. Consequently, hydrothermal technique is an effective means of loading active species onto a support to give a highly dispersed catalyst.23–25 Despite this, to the best of our best knowledge, the use of hydrothermal methods to load Pt onto the nano ZrO2–SO4 has not yet been reported. The present study developed a novel platinum-loaded sulphated nanozirconia (Pt/nano ZrO2–SO4) catalyst using an advanced hydrothermal process. This material was found to be highly active at relatively low temperatures during the conversion of waste LDPE into gasoline-range hydrocarbons.
2. Experimental
2.1 Materials
Zirconium dioxide nanopowder (nano ZrO2, 60–70 nm, ≥99.90%) was provided by the Hongwu International Group, Ltd. (Guangzhou, China) and tetrachloroplatinum (PtCl4, ≥99.90%) was supplied by the Zibo Jiashitai Chemical Technology Co., Ltd. (Zibo, China). A sulphuric acid solution (H2SO4, 98%) and ammonium hydroxide solution (NH4OH, 25%) were obtained from Merck (Germany). All chemicals were analytical grade and used as received. The LDPE comprised commonly used plastics collected from household waste. Hydrogen gas (H2, 99.99%) was supplied by PT Samator Gas Industri (Yogyakarta, Indonesia).2.2 Methods
The nano ZrO2 was dispersed in a 0.8 mol dm−3 H2SO4 solution. The powder was then filtrated, dried in an oven at 100 °C for 24 h and calcined at 600 °C for 4 h.26 A quantity of this calcined nano ZrO2–SO4 was dispersed in an aqueous solution of PtCl4 (1 wt% Pt) in a Teflon-lined stainless steel autoclave and heated at 90 °C for 4 h. The resulting paste was then dried in an oven at 100 °C for 24 h and calcined at 600 °C for 4 h, followed by the reduction of Pt4+ to Pt0 under a hydrogen gas stream (20 mL min−1) at 400 °C for 3 h. The obtained material is referred to herein as Pt/nano ZrO2–SO4.Scanning electron microscopy (SEM) imaging and elemental mapping were performed using a JEOL JSM-6510 (Japan) in conjunction with an energy-dispersive X-ray spectrometry (EDX) detector, employing a JED-2300 Analysis Station (Japan). Specimens were placed on a carbon coated sample holder prior to these SEM-EDX mapping observations. Characterization by Fourier transform infrared spectroscopy (FTIR) was performed using a Shimadzu Prestige-21 (Japan), scanning the range of 4000–400 cm−1 and employing the KBr disc technique. X-ray photoelectron spectroscopy (XPS) data were acquired with a Shimadzu AXIS-ULTRADLD (Japan). The binding energy values were calibrated using the C 1s peak at 284.7 eV. X-ray diffraction (XRD) characterization was carried out using a Shimadzu XRD-7000 (Japan) with CuKα radiation (Ni filtered) at λ = 1.5418 Å over the range of 2θ = 4–80°. Gas sorption analysis (GSA) was performed using a Quantachrome NOVA 1200e (USA) over the P/Po range of 0.005–0.999 at 77.3 K, using liquid nitrogen.
Thermogravimetric analysis (TGA) data were obtained with a Shimadzu DTG-60H (Japan) at a heating rate of 10 °C min−1 from room temperature to 900 °C under an atmosphere composed of nitrogen (80%) and oxygen (20%). The acidity of the catalysts was determined based on the adsorption of ammonia using a gravimetric method.
A feedstock for the hydrocracking reaction was prepared by vaporizing waste LDPE in a pyrolysis reactor at 300 °C for 3 h and condensing the vapor into liquid. Hydrocracking of the heavy oil obtained from pyrolysis was performed using either nano ZrO2, nano ZrO2–SO4 or Pt/nano ZrO2–SO4 catalysts under a hydrogen gas stream (20 mL min−1) in a flow reactor.7 The catalytic activities of these materials were assessed at various temperatures, reaction times and catalyst-to-feed ratios. Products were characterized by gas chromatography-mass spectrometry (GC-MS) using a Shimadzu QP 2010S (Japan) with an RtXi-5MS column (length 30 m, diameter 0.25 mm and film thickness 0.25 μm) and an electron ionization detector. Further details of this analysis are provided in ESI.†
3. Results and discussion
3.1 Electron microscopy characterization
The SEM images obtained for the nano ZrO2, nano ZrO2–SO4 and Pt/nano ZrO2–SO4 are shown in Fig. 1. It can be seen that the surface morphology of the nano ZrO2 precursor was not significantly changed after the addition of sulphate and Pt. However, the nano ZrO2–SO4 does exhibit increased agglomeration. The nano ZrO2 surface topography after acid modification shows a typical porous material that has a rough structure with irregular shapes. It has been reported that the calcination step in the process used to make the sulphate facilitates the coalescence of primary particles, leading to a significant increase in the particle size of the nano ZrO2.27 For nano ZrO2–SO4 sample, some particles with different size and disordered shape were obtained from the incorporation of very small crystallites during the calcination process.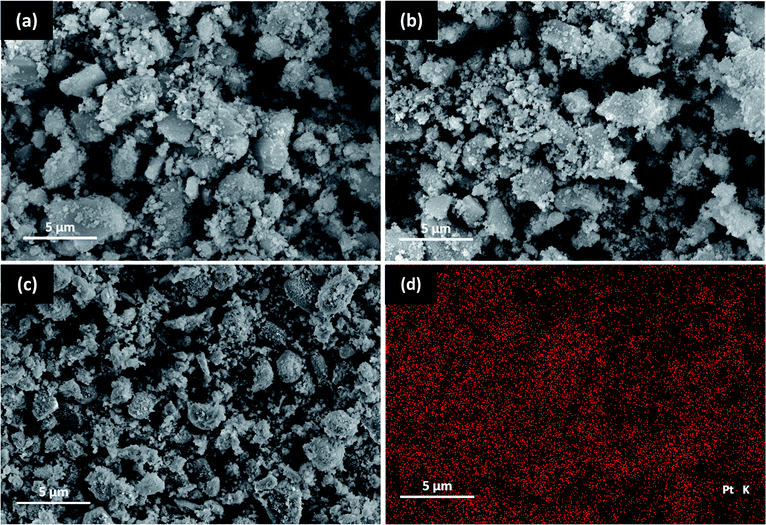 | ||
| Fig. 1 SEM images of (a) nano ZrO2, (b) nano ZrO2–SO4, (c) Pt/nano ZrO2–SO4 and (d) EDX Pt mapping of Pt/nano ZrO2–SO4. | ||
The Pt/nano ZrO2–SO4 shows a typical finer surface morphology with smaller and more regular particle size. The EDX spectrum of the Pt/nano ZrO2–SO4 clearly shows Pt particles on the surface (Fig. 1d). This observation indicates the homogeneous dispersion of Pt over the nano ZrO2–SO4 support and the size of Pt particles fit into the range of 2–5 nm. The size of the metallic Pt and support plays a crucial role in the reaction pathway to obtain the optimum catalytic activity and selectivity. The impregnation of Pt via a hydrothermal method significantly inhibited the particle agglomeration, thus stabilized the catalyst surface.
3.2 XPS analysis
XPS was used to obtain additional insights into the Pt composition, based on comparisons of the binding energy values, so as to examine the metal loading mechanism. Fig. 2 presents the deconvoluted Pt 4f spectrum acquired from the Pt/nano ZrO2–SO4, which contains Pt0 4f7/2 and Pt0 4f5/2 peaks, centered at 71.5 and 74.8 eV, respectively. Peak is also present at 73.1 eV (Pt2+ 4f7/2) due to the presence of Pt2+ species. This result indicates that the Pt particles had diameters on the scale of several nm, such that electron interactions occurred between these particles and the nano ZrO2–SO4 surface.28–30 In addition, Table 1 shows the relative area of the deconvoluted Pt0 4f7/2, Pt0 4f5/2 and Pt2+ 4f7/2 spectra. This result indicates that the reduction of Pt4+ under a hydrogen gas stream was successfully formed Pt0 particles with the total composition of 81.8%.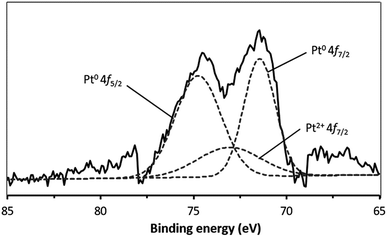 | ||
| Fig. 2 The XPS spectrum of Pt/nano ZrO2–SO4 in the Pt 4f region. The broken lines indicate the peaks obtained by deconvolution. | ||
| Pt 4f peak | Peak position (eV) | Relative area% |
|---|---|---|
| Pt0 4f7/2 | 71.5 | 36.4 |
| Pt0 4f5/2 | 74.8 | 45.4 |
| Pt2+ 4f7/2 | 73.1 | 18.2 |
3.3 Surface sulphate analysis
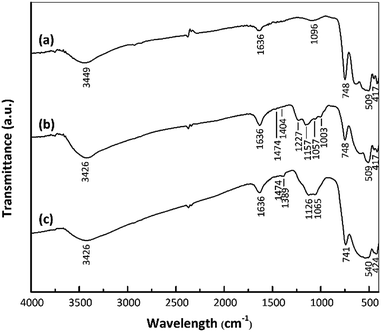
The surface functional groups of the samples were assessed to investigate changes following the acid treatment and Pt loading. Fig. 3 shows the FTIR spectra of the nano ZrO2, nano ZrO2–SO4 and Pt/nano ZrO2–SO4. The spectra of the latter two materials contain the same peaks as the nano ZrO2 spectrum in the range of 417–748 cm−1, which are ascribed to Zr–O–Zr bonds.27 An intense, broad band around 3449 cm−1 and another peak at 1636 cm−1 are assigned to the stretching and bending modes of adsorbed water, respectively.31,32The presence of SO42− ions on the nano ZrO2 surface was confirmed by the peaks in the range of 1003–1474 cm−1, assigned to chelating bidentate bridging SO42− groups coordinated to Zr4+.29 The four bands at 1003, 1057, 1157 and 1227 cm−1 result from symmetric S–O, asymmetric S–O, symmetric S![[double bond, length as m-dash]](https://www.rsc.org/images/entities/char_e001.gif) O and asymmetric S
O and asymmetric S![[double bond, length as m-dash]](https://www.rsc.org/images/entities/char_e001.gif) O vibrations, respectively.33 The weak bands at 1404–1474 cm−1 are ascribed to the stretching vibrations of S
O vibrations, respectively.33 The weak bands at 1404–1474 cm−1 are ascribed to the stretching vibrations of S![[double bond, length as m-dash]](https://www.rsc.org/images/entities/char_e001.gif) O bonds in adsorbed SO3 molecules.34 There are no appreciable shifts in the band positions in the Pt/nano ZrO2–SO4 spectrum compared with those in the nano ZrO2–SO4 spectrum, although the Pt/nano ZrO2–SO4 generated a broad SO42− band with a shoulder at 1065–1126 cm−1 and less intense bands at 1389 and 1474 cm−1. These typical SO42− peaks clearly indicate that the nano ZrO2 surface was modified with sulphate.
O bonds in adsorbed SO3 molecules.34 There are no appreciable shifts in the band positions in the Pt/nano ZrO2–SO4 spectrum compared with those in the nano ZrO2–SO4 spectrum, although the Pt/nano ZrO2–SO4 generated a broad SO42− band with a shoulder at 1065–1126 cm−1 and less intense bands at 1389 and 1474 cm−1. These typical SO42− peaks clearly indicate that the nano ZrO2 surface was modified with sulphate.
3.4 Catalyst acidity analysis
The catalyst acidities were estimated based on the gravimetric method, using the amounts of ammonia vapor absorbed by the catalysts which were first placed under vacuum conditions.35,36 A vacuum was applied to prevent any interference by water vapor that might have been adsorbed by the catalyst. The acidities of the nano ZrO2, nano ZrO2–SO4 and Pt/nano ZrO2–SO4 are summarized in Table 2, and these data demonstrate that the nano ZrO2 had low total acidity, resulting from Zr4+ species acting as Lewis acid sites. Activation of this material through the sulphate treatment increased the total acidity, indicating that the relative amounts of Brønsted and Lewis acid sites were determined largely by the surface sulphate concentration.15 The acidity of the Pt/nano ZrO2–SO4 was increased significantly due to the presence of Pt species acting as strong Lewis acid sites.11| Sample | Acidity (mmol g−1) |
|---|---|
| Nano ZrO2 | 0.5 |
| Nano ZrO2–SO4 | 2.2 |
| Pt/nano ZrO2–SO4 | 8.9 |
The strengths of Brønsted and Lewis acid sites on a catalyst play important roles in determining the catalytic activity.18–20 In the present work, interactions between catalyst acid sites and ammonia were confirmed by FTIR spectroscopy. Fig. 4 presents the FTIR spectra of the nano ZrO2, nano ZrO2–SO4 and Pt/nano ZrO2–SO4 after ammonia adsorption. Following this adsorption, the S![[double bond, length as m-dash]](https://www.rsc.org/images/entities/char_e001.gif) O and S–O bands were broadened and shifted to 1119 and 1396 cm−1, respectively. The symmetric bending band around 1119 cm−1 confirms the presence of ammonia coordinated to Lewis acid sites. In addition, the symmetric bending band at 1396 cm−1 indicates ammonia in the form of a conjugate acid based on interactions with hydrogen from Brønsted sites.35,36
O and S–O bands were broadened and shifted to 1119 and 1396 cm−1, respectively. The symmetric bending band around 1119 cm−1 confirms the presence of ammonia coordinated to Lewis acid sites. In addition, the symmetric bending band at 1396 cm−1 indicates ammonia in the form of a conjugate acid based on interactions with hydrogen from Brønsted sites.35,36
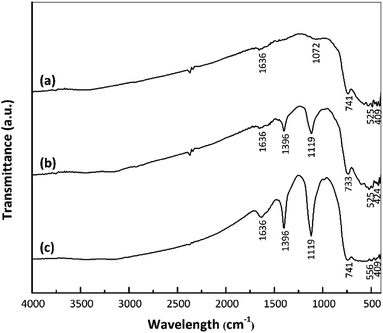 | ||
| Fig. 4 FTIR spectra of (a) nano ZrO2, (b) nano ZrO2–SO4 and (c) Pt/nano ZrO2–SO4 after ammonia adsorption. | ||
3.5 XRD characterization
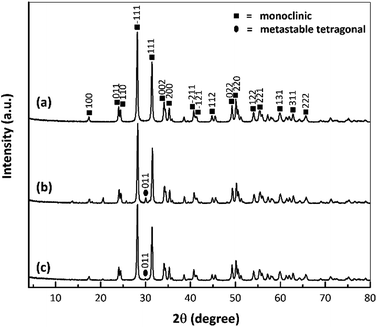
Fig. 5 provides the XRD patterns of the nano ZrO2, nano ZrO2–SO4 and Pt/nano ZrO2–SO4. The ZrO2 typically used as a catalyst has only three crystal phases (tetragonal, monoclinic and metastable tetragonal),37 and the characteristic peaks at 2θ = 28.3° (−111) and 31.6° (111) correspond to the monoclinic crystal phase.13 In general, this series of diffraction patterns indicates stable crystallinity, although the addition of sulphate modified the crystal phase of the nano ZrO2. This is suggested by the appearance of a new, low intensity peak at 2θ = 30.2° (011), indicating the transition of the crystal phase from monoclinic to metastable tetragonal.26Previous research has demonstrated that the sulphate addition process induces a phase transformation from monoclinic to metastable tetragonal. However, this process in the present study did not generate a complete transformation to a tetragonal crystal phase because the phase of the nano ZrO2–SO4 was also affected by the crystalline properties of the nano ZrO2 precursor. The nano ZrO2 comprised a pure monoclinic phase with a high degree of crystallinity and thermodynamic stability, such that the nano ZrO2–SO4 was also largely monoclinic.38,39
The nano ZrO2–SO4 containing Pt produced peaks at 2θ = 39.8° and 46.2° associated with (111) and (200) reflections, as has also been reported in prior publications.20,40 In this research, Pt peaks were not detected because the total amount of Pt on the surface was relatively low. Moreover, the crystal phase of the nano ZrO2 was stabilized by the addition of sulphate.32,41,42 Therefore, there were no significant changes in the crystal phase after Pt was loaded onto the nano ZrO2–SO4, as a result of the increased phase stability of this material. However, the intensities of the monoclinic and metastable tetragonal peaks were gradually decreased. The Pt/nano ZrO2–SO4 with the highest acidity (Table 2) generated the least intense diffraction peaks out of all the catalysts. This result confirms that the amount of Pt was loaded on the nano ZrO2–SO4 surface in the case of this specimen.
3.6 Textural properties evaluation
Fig. 6 presents the isotherms for the samples, all of which conform to type IV according to the IUPAC classification system. There was no appreciable change in the shape of the nano ZrO2 isotherm before and after modification. In addition, the data in Table 3 indicate the formation of a mesoporous material based on an average pore diameter in the range of 2–50 nm.43,44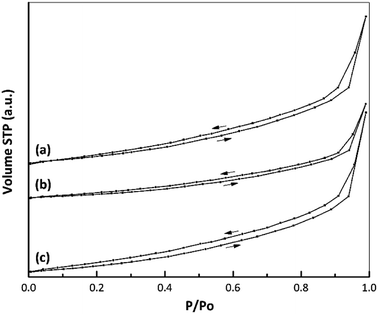 | ||
| Fig. 6 Nitrogen adsorption–desorption isotherms of (a) nano ZrO2, (b) nano ZrO2–SO4 and (c) Pt/nano ZrO2–SO4. | ||
| Sample | BET surface area (m2 g−1) | Total pore volume (cm3 g−1) | Average pore diameter (nm) |
|---|---|---|---|
| Nano ZrO2 | 25.1 | 0.1 | 3.4 |
| Nano ZrO2–SO4 | 16.7 | 0.1 | 4.3 |
| Pt/nano ZrO2–SO4 | 23.7 | 0.1 | 3.5 |
The textural properties of each catalyst, including the specific surface area, total pore volume and average pore diameter, are summarized in Table 3. A large decrease in the specific surface area (from 25.1 to 16.7 m2 g−1) was observed after the addition of sulphate to nano ZrO2.7 This change was attributed to the interaction between the nano ZrO2 and sulphate groups, which promoted agglomeration during the calcination process. This same behaviour was also reported in a previous paper.45 In the present study, the decreased crystallinity following the addition of sulphate was confirmed by XRD data (Fig. 5). After Pt loading via a hydrothermal method, the specific surface area of the catalyst was increased to 23.7 m2 g−1, which is attributed to highly dispersion of Pt species interacting with the nano ZrO2–SO4 support and inhibition of the agglomeration process. This observation corresponds to elemental mapping images (Fig. 1d) for Pt/nano ZrO2–SO4. Thus, the hydrothermal method is evidently a useful means of controlling particle agglomeration of catalyst.
3.7 Thermal analysis
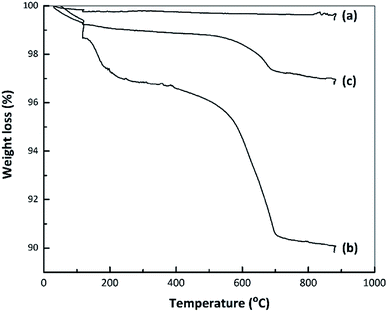
Fig. 7 presents TG curves obtained from the nano ZrO2, nano ZrO2–SO4 and Pt/nano ZrO2–SO4. The TG data for the nano ZrO2–SO4 before and after Pt loading exhibit the same two mass reductions steps, while the nano ZrO2 did not show any significant changes in mass loss. The initial decreases in mass of the nano ZrO2–SO4 and Pt/nano ZrO2–SO4 occurred over the range of 50–200 °C (2.5 and 0.9%, respectively) and can be ascribed to the removal of adsorbed water. The rapid mass losses in the range of 500–700 °C (5.7 and 1.5%, respectively) might indicate the loss of sulphate species.14,46 The decomposition of sulphate could result in structural changes that significantly reduce the catalytic activity.3.8 Optimization of the hydrocracking reaction
The heavy oil obtained from the pyrolysis of waste LDPE was used as the feedstock during atmospheric pressure catalytic hydrocracking experiments (see Table S1 in ESI† for details regarding the chemical compositions). The reaction conditions were varied to optimize the properties of the hydrocarbon products. In each trial, 100% conversion of the feed was obtained, with three main products (liquids, gases and solids) and no other residue. The liquid yield was clear yellowish oil, while the solid yield was black coke formed on the catalyst surface. The quality of the final product is known to vary greatly depending on the operating conditions.47 Therefore, the effects of temperature, reaction time and catalyst-to-feed proportion were evaluated to optimize the reaction process. The product distributions obtained from the hydrocracking of waste LDPE over the nano ZrO2, nano ZrO2–SO4 and Pt/nano ZrO2–SO4 are presented herein in terms of the selectivity for gasoline (C5–C12) and diesel (C13–C22) hydrocarbons.The effect of temperature on the catalytic activity is summarized in Table 4. It can be seen that the greatest liquid yields were obtained at 250 °C in each case. The gasoline-range hydrocarbons generated over the nano ZrO2 and nano ZrO2–SO4 at 250 °C with selectivities of 35.2 and 44.5 wt%, respectively. When using the Pt/nano ZrO2–SO4 catalyst, the selectivity for the gasoline fraction was 56.0 wt%. This represents a significant increase in the gasoline fraction, as a result of the strong acid properties of this catalyst. These results are also in agreement with the estimated acidity values of the three materials (Table 2).
| T (°C) | Sample | Yield (wt%) | |||
|---|---|---|---|---|---|
| Liquid | Solid | Gas | |||
| C5–C12 | C13–C20 | ||||
| 250 | Nano ZrO2 | 35.2 | 17.9 | 0.1 | 46.8 |
| Nano ZrO2–SO4 | 44.5 | 15.5 | 0.3 | 39.7 | |
| Pt/nano ZrO2–SO4 | 56.0 | 13.7 | 0.2 | 30.1 | |
| 300 | Nano ZrO2 | 4.8 | 2.3 | 0.3 | 92.6 |
| Nano ZrO2–SO4 | 18.1 | 5.7 | 1.0 | 75.2 | |
| Pt/nano ZrO2–SO4 | 37.1 | 17.7 | 0.3 | 44.9 | |
| 350 | Nano ZrO2 | 1.0 | 0.3 | 0.6 | 98.1 |
| Nano ZrO2–SO4 | 6.1 | 1.9 | 0.9 | 91.1 | |
| Pt/nano ZrO2–SO4 | 12.0 | 3.9 | 0.4 | 83.7 | |
At higher temperatures, the relative amount of coke formed on the catalyst surface increased, leading to a decrease in the liquid yields. Furthermore, the catalysts exhibited a tendency toward deactivation and decreased catalytic activity. In the case of the Pt/nano ZrO2–SO4, the application of high temperatures could lead to sintering, which would be expected to degrade the catalytic activity.48
The reactions at 350 °C over the catalysts resulted in sharp decreases in the liquid yields and gave the highest gaseous product yields of 98.1, 91.1 and 83.7 wt%. These results suggest excessive cracking5 because elevated temperatures during hydrocracking have been shown to lower the selectivity for liquid products.49 This effect is associated with the homolysis of organic compounds to form free radicals, which can bind hydrogen radicals to form short chain hydrocarbons that are gases under ambient conditions.50
Several experimental studies had been carried out with the aim of improving gasoline yields from plastics pyrolysis by introducing suitable catalysts, as listed in Table 5. Various catalysts currently used in petroleum refining have already been tested extensively with common plastics such as waste LDPE, HDPE and PP. The experiments in these previous studies were primarily performed at high reaction temperatures (≥350 °C). However, in this work, the addition of Pt to nano ZrO2–SO4 facilitated the low-temperature hydrocracking reaction by increasing the surface concentration of olefins. These active olefin intermediates reacted with acid sites to form carbenium ion intermediates.
| Catalyst | Modification of catalyst | Plastic | Hydrocracking temperature (°C) |
|---|---|---|---|
| a LDPE: low density polyethylene, HDPE: high density polyethylene, PP: polypropylene. | |||
| HZSM-5 5,51 | Ion exchange | LDPE | 425 |
| Al-MCM-41 5,51 | Sol–gel | LDPE | 450 |
| Silica–alumina47 | — | LDPE | 375 |
| HZSM-5 47 | Ion exchange | LDPE | 375 |
| Y-zeolite52 | Used as received | LDPE | 400 |
| HZSM-5 52 | Used as received | LDPE | 400 |
| Cr/zeolite53 | Ion exchange | LDPE | 450 |
| Y-zeolite10 | Used as received | LDPE, HDPE | 450 |
| Natural zeolite10 | Used as received | LDPE, HDPE | 450 |
| Ni/zeolite11 | Reflux | LDPE | 350 |
| Ni–Mo/zeolite11 | Reflux | LDPE | 350 |
| Co/zeolite11 | Reflux | LDPE | 350 |
| Co–Mo/zeolite11 | Reflux | LDPE | 350 |
| Y-zeolite54 | Used as received | PP | 390 |
| Pt/ZrO2–SO4 7 | Reflux | LDPE | 250 |
| This work | Hydrothermal | LDPE | 250 |
It has been reported that using HZSM-5 and Al-MCM-41 as catalysts for hydrocracking at 450 °C gives the highest gasoline fraction yield from waste LDPE.5 Moreover, a Ni/Co-modified zeolite applied to hydrocracking at 350 °C has been found to exhibit high selectivity for gasoline.11 Compared with prior studies (Table 5), the present research demonstrated the use of lower temperature reaction, and confirmed that the hydrocracking over the Pt/nano ZrO2–SO4 at 250 °C effectively converted waste LDPE into the highest gasoline fraction. This low temperature process would reduce energy consumption and lower operational costs.7
The Pt/ZO2–SO4 catalyst reported in prior publication has been prepared via a reflux method.7 The use of reflux method led to uneven dispersion of Pt that can decrease the catalytic activity and stability. Meanwhile, in this present research, the hydrothermal method offers solution in an easier way for metal impregnation. It succesfully produced catalyst with highly dispersion of Pt species (Fig. 1d) by controlling aging time, reaction temperature and pressure.
The effect of reaction time on the product yields was assessed, as presented in Table 6. The conversion to liquids over the Pt/nano ZrO2–SO4 following reaction times of 30, 60 and 90 min showed a continuous increase, with values of 42.6, 69.7 and 70.2 wt%, respectively. However, reaction times of 60 and 90 min led to a significant decrease in the selectivity for the gasoline fraction, going from 56.0 to 44.8 wt%. This result indicates that a relatively long reaction time tends to increase the formation of coke on the catalyst surface. In addition, prolonged reaction times can promote condensation and repolymerization reactions. Repolymerization can result in the formation of a heavy fraction and significantly decrease the catalytic activity. Moreover, prolonged hydrocracking reactions can produce catalyst deactivation as reactants and products cover the active sites of the catalyst.53 Therefore, 60 min was determined to be the optimum reaction time with regard to obtaining the highest proportion of the gasoline fraction. The use of a relatively short time also gives a more efficient process.
| t (min) | Sample | Yield (wt%) | |||
|---|---|---|---|---|---|
| Liquid | Solid | Gas | |||
| C5–C12 | C13–C20 | ||||
| 30 | Nano ZrO2 | 32.3 | 1.6 | 0.1 | 66.0 |
| Nano ZrO2–SO4 | 29.7 | 12.0 | 0.3 | 58.0 | |
| Pt/nano ZrO2–SO4 | 33.7 | 8.9 | 0.1 | 57.3 | |
| 60 | Nano ZrO2 | 35.2 | 17.9 | 0.1 | 46.8 |
| Nano ZrO2–SO4 | 44.5 | 15.5 | 0.3 | 39.7 | |
| Pt/nano ZrO2–SO4 | 56.0 | 13.7 | 0.2 | 30.1 | |
| 90 | Nano ZrO2 | 37.7 | 5.0 | 0.1 | 57.2 |
| Nano ZrO2–SO4 | 41.9 | 14.9 | 0.4 | 42.8 | |
| Pt/nano ZrO2–SO4 | 44.8 | 25.4 | 0.2 | 29.6 | |
Table 7 shows the product distributions obtained from the hydrocracking of waste LDPE at various catalyst-to-feed proportions. A value of 1 wt% gave the highest catalyst activity and selectivity for the gasoline fraction. For the Pt/nano ZrO2–SO4, increasing the catalyst proportion from 1 to 2 to 3 wt% gradually decreased the gasoline fraction (56.0, 46.1 and 36.0 wt%). These results may have been due to excessive hydrocarbon reactions at higher catalyst amounts. Based on the solid fraction compositions, it is evident that the use of a large amount of catalyst significantly increased coke deposits on the catalyst surface, thus reducing the gasoline fraction. The hydrocracking of waste LDPE over the Pt/nano ZrO2–SO4 at a catalyst-to-feed proportion of 1 wt% gave the highest selectivity for the gasoline fraction together with minimal coke formation, and so is optimal (see Fig. S1 and Table S1 in ESI† for details regarding the chemical compositions).
| Catalyst-to-feed (wt%) | Sample | Yield (wt%) | |||
|---|---|---|---|---|---|
| Liquid | Solid | Gas | |||
| C5–C12 | C13–C20 | ||||
| 1 | Nano ZrO2 | 35.2 | 17.9 | 0.1 | 46.8 |
| Nano ZrO2–SO4 | 44.5 | 15.5 | 0.3 | 39.7 | |
| Pt/nano ZrO2–SO4 | 56.0 | 13.7 | 0.2 | 30.1 | |
| 2 | Nano ZrO2 | 30.3 | 18.5 | 0.1 | 51.1 |
| Nano ZrO2–SO4 | 39.4 | 17.3 | 0.4 | 42.9 | |
| Pt/nano ZrO2–SO4 | 46.1 | 14.6 | 0.2 | 39.1 | |
| 3 | Nano ZrO2 | 27.3 | 22.6 | 0.1 | 50.0 |
| Nano ZrO2–SO4 | 33.1 | 18.0 | 0.4 | 48.5 | |
| Pt/nano ZrO2–SO4 | 36.0 | 12.9 | 0.3 | 50.8 | |
3.9 Catalytic stability evaluation
The stabilities of the nano ZrO2, nano ZrO2–SO4 and Pt/nano ZrO2–SO4 were assessed at 250 °C with a reaction time of 60 min and a catalyst-to-feed proportion of 1 wt%. The results, based on the liquid yields obtained upon repeated reuses, are presented in Fig. 8. The catalytic stability of the nano ZrO2 during the hydrocracking reaction showed a gradual reduction with repeated use, followed by a sharp decrease during the fourth cycle, while the performance of the nano ZrO2–SO4 exhibited a significant drop in the second cycle. The rapid deactivation of ZrO2–SO4 represents a serious drawback. Several reasons for this phenomenon have been proposed. These include; a reduction in the oxidation state of sulphur in the surface sulphate groups (from S6+ to lower oxidation states) leading to a decrease in the acid strength, the formation of macromolecules on the catalyst surface (i.e., coke formation), and the loss of sulphur as H2S.55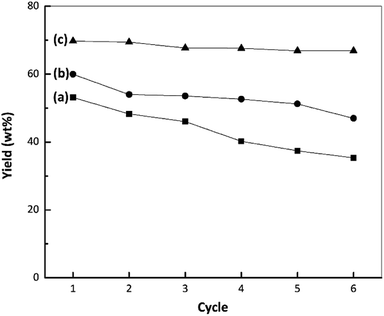 | ||
| Fig. 8 Results from stability tests during the hydrocracking of waste LDPE over (a) nano ZrO2, (b) nano ZrO2–SO4 and (c) Pt/nano ZrO2–SO4. | ||
Fig. 9 depicts a proposed illustration for the catalytic stability of the nano ZrO2–SO4 with and without Pt. The overall catalytic and selectivity data suggest that the conversion of waste LDPE over the nano ZrO2–SO4 produces the highest solid yield. The results also demonstrate that this material had high initial activity that rapidly decreased during subsequent cycles. The catalytic activity of the nano ZrO2–SO4 undergoes a significant decrease when in contact with hydrocarbons or water vapor at high temperatures due to deactivation by the formation of coke deposits over the strong acid sites.14
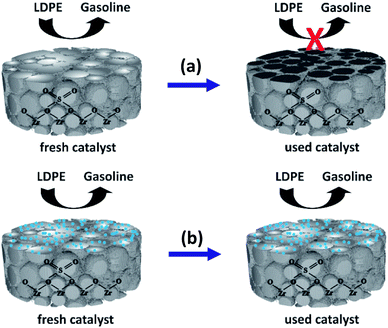 | ||
| Fig. 9 A proposed illustration for the catalytic stability difference between (a) nano ZrO2–SO4 and (b) Pt/nano ZrO2–SO4. | ||
The calcination of deactivated catalyst in oxygen at 450 °C has been shown to recover the original activity.55 This result suggests that the use of air as a carrier gas could prevent the deactivation of the catalyst, likely by degrading hydrocarbons in the catalyst pores.37 In the present work, the Pt-loaded catalyst showed high stability when used in the hydrocracking reaction and maintained its activity up to the sixth cycle (Fig. 8). It has been reported that the deactivation of the nano ZrO2–SO4 can be mitigated by applying Pt to suppress coke formation. This occurs due to hydrogenation via the homolytic dissociation of hydrogen. As a result, the loading of a small amount of Pt has been shown to significantly improve the stability of the nano ZrO2–SO4 while inhibiting coke formation.18–20
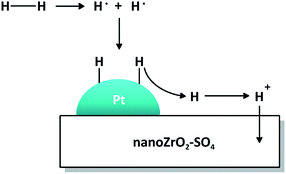
The mechanistic role of Pt in the presence of hydrogen is illustrated in Fig. 10. The hydrogen molecule dissociates homolitically on the surface of Pt particle to form two radical hydrogen atoms which then bind to unpaired electrons in the 5d orbitals of Pt. The H+ ion is released from Pt, distributed to nano ZrO2–SO4 and migrated to electron-rich oxygen sites, forming a new Brønsted acid site and suppress coke formation. Thus, Pt plays an important role as active sites for acid catalyzed reactions.
4. Conclusions
The catalyst characterizations indicate that Pt loading via a hydrothermal method inhibited particle agglomeration and thus increased the surface area of the Pt/nano ZrO2–SO4. The acid treatment and Pt loading increased the activity and selectivity for hydrocracking of waste LDPE due to a significant increase in catalyst acidity. The data show that Pt was successfully impregnated with the total composition of Pt0 was 81.8% and homogeneously dispersed on the nano ZrO2–SO4 surface, producing a highly active and selective solid acid catalyst in the hydrocracking reaction under low temperature reaction conditions. Liquid, solid and gas yields of 69.7, 0.2 and 30.1 wt% were obtained from waste LDPE hydrocracking under the optimized conditions (a temperature of 250 °C, a reaction time of 60 min and a catalyst-to-feed proportion of 1 wt%). The liquid fraction contained as much as 56.0 wt% gasoline-type products and 13.7 wt% diesel-type products. In addition, the Pt/nano ZrO2–SO4 showed high stability and maintained its activity up to the sixth cycle for the conversion of waste LDPE into gasoline-range hydrocarbons.Conflicts of interest
There are no conflicts to declare.Acknowledgements
The authors would like to acknowledge the support of Master Program of Education Leading to Doctoral Degree for Excellent Graduates Scholarships and Enhancing International Publication (Sandwich-Like Program) Research Grants from the Ministry of Research, Technology and Higher Education, Republic of Indonesia. We would also like to thank the Department of Chemistry at Universitas Islam Indonesia, the Department of Chemistry at Universitas Gadjah Mada, the Department of Chemistry and Applied Chemistry at Saga University, the Faculty of Engineering at Kumamoto University and the Department of Chemistry at Kyushu University for performing the various chemical analyses reported herein.References
- A. Rahimi and J. M. García, Nat. Rev. Chem., 2017, 1, 1–11 CrossRef.
- S. Xu, M. Jiang and J. Shen, Polym. J., 1995, 27, 607–613 CrossRef CAS.
- A. G. Buekens and H. Huang, Resour., Conserv. Recycl., 1998, 23, 163–181 CrossRef.
- B. Suresh, S. Maruthamuthu, M. Kannan and A. Chandramohan, Polym. J., 2011, 43, 398–406 CrossRef CAS.
- J. Aguado, D. P. Serrano, G. S. Miguel, M. C. Castro and S. Madrid, J. Anal. Appl. Pyrolysis, 2007, 79, 415–423 CrossRef CAS.
- B. Kunwar, H. N. Cheng, S. R. Chandrasekaran and B. K. Sharma, Renewable Sustainable Energy Rev., 2016, 54, 421–428 CrossRef CAS.
- M. Utami, K. Wijaya and W. Trisunaryanti, Mater. Chem. Phys., 2018, 213, 548–555 CrossRef CAS.
- S. T. Sie, Ind. Eng. Chem. Res., 1992, 31, 1881–1889 CrossRef CAS.
- S. T. Sie, Ind. Eng. Chem. Res., 1993, 32, 397–402 CrossRef CAS.
- M. Syamsiro, H. Saptoadi, T. Norsujianto, P. Noviasri, S. Cheng, Z. Alimuddin and K. Yoshikawa, Energy Procedia, 2014, 47, 180–188 CrossRef CAS.
- W. Sriningsih, M. G. Saerodji, W. Trisunaryanti, T. Triyono, R. Armunanto and I. I. Falah, Procedia Environ. Sci., 2014, 20, 215–224 CrossRef CAS.
- R. A. Keogh, R. Srinivasan and B. H. Davis, Appl. Catal., A, 1996, 140, 47–57 CrossRef CAS.
- M. Busto, C. R. Vera and J. M. Grau, Fuel Process. Technol., 2011, 92, 1675–1684 CrossRef CAS.
- A. K. Aboul-Gheit, F. K. Gad, G. M. Abdel-Aleem, D. S. El-Desouki, S. M. Abdel-Hamid, S. A. Ghoneim and A. H. Ibrahim, Egypt. J. Pet., 2014, 23, 303–314 CrossRef.
- K. Föttinger, K. Zorn and H. Vinek, Appl. Catal., A, 2005, 284, 69–75 CrossRef.
- K. Watanabe, T. Kawakami, K. Baba, N. Oshio and T. Kimura, Catal. Surv. Asia, 2005, 9, 17–24 CrossRef CAS.
- O. Y. Gutiérrez, Y. Yu, R. Kolvenbach, G. L. Haller and J. A. Lercher, Catal. Sci. Technol., 2013, 3, 2365–2372 RSC.
- K. Ebitani, J. Konishi and H. Hattori, J. Catal., 1991, 130, 257–267 CrossRef CAS.
- H. Hattori, Stud. Surf. Sci. Catal., 1993, 77, 69–76 CrossRef CAS.
- A. Sayari and A. Dicko, J. Catal., 1994, 145, 561–564 CrossRef CAS.
- Z. Li, B. Hou, Y. Xu, D. Wu, Y. Sun, W. Hu and F. Deng, J. Solid State Chem., 2005, 178, 1395–1405 CrossRef CAS.
- H. Wang, Y. Fan, G. Shi, Z. Liu, H. Liu and X. Bao, Catal. Today, 2007, 125, 149–154 CrossRef CAS.
- H. Wang, Y. Fan, G. Shi, H. Liu and X. Bao, J. Catal., 2008, 260, 119–127 CrossRef CAS.
- H. Wang, Y. Wu, L. He and Z. Liu, Energy Fuels, 2012, 26, 6518–6527 CrossRef CAS.
- S. Yu, P. Jiang, Y. Dong, P. Zhang, Y. Zhang and W. Zhang, Bull. Korean Chem. Soc., 2012, 33, 524–528 CrossRef CAS.
- M. Utami, K. Wijaya and W. Trisunaryanti, Key Eng. Mater., 2017, 757, 131–137 Search PubMed.
- A. E. A. Said, M. M. A. El-Wahab and M. A. El-Aal, J. Mol. Catal. A: Chem., 2014, 394, 40–47 CrossRef CAS.
- J. F. Moulder, W. F. Stickle, P. E. Sobol and K. D. Bomben, Handbook of X-Ray Photoelectron Spectroscopy, PerkinElmer Corp., Eden Prarie, 1992 Search PubMed.
- J. Manoli, C. Potvin, M. Muhler, U. Wild, G. Resofszki, T. Buchholz and Z. Paál, J. Catal., 1998, 178, 338–351 CrossRef CAS.
- T. Fujigaya, C. Kim, Y. Hamasaki and N. Nakashima, Sci. Rep., 2016, 6, 1–10 CrossRef PubMed.
- B. Fu, L. Gao, L. Niu, R. Wei and G. Xiao, Energy Fuels, 2009, 23, 569–572 CrossRef CAS.
- F. Heshmatpour and R. B. Aghakhanpour, Adv. Powder Technol., 2012, 23, 80–87 CrossRef CAS.
- F. Haase and J. Sauer, J. Am. Chem. Soc., 1998, 120, 13503–13512 CrossRef CAS.
- X. Li, K. Nagaoka, L. J. Simon, R. Olindo, J. A. Lercher, A. Hofmann and J. Sauer, J. Am. Chem. Soc., 2005, 127, 16159–16166 CrossRef CAS PubMed.
- F. D. Rey-Bueno, A. García-Rodríguez, A. Mata-Arjona and F. J. D. Rey-Pérez-Caballero, Clays Clay Miner., 1995, 43, 554–561 CrossRef CAS.
- D. Spielbauer, G. A. H. Mekhemer and H. Knozinger, Catal. Lett., 1996, 40, 71–79 CrossRef CAS.
- T. Yamaguchi, Catal. Today, 1994, 20, 199–218 CrossRef CAS.
- S. Ardizzone, C. L. Bianchi, W. Cattagni and V. Ragaini, Catal. Lett., 1997, 49, 193–198 CrossRef CAS.
- W. Stichert and F. Schüth, J. Catal., 1998, 174, 242–245 CrossRef CAS.
- H. F. Aritonang, D. Onggo, C. Ciptati and C. L. Radiman, J. Nanopart., 2014, 2014, 1–6 CrossRef.
- G. D. Yadav and J. J. Nair, Microporous Mesoporous Mater., 1999, 33, 1–48 CrossRef CAS.
- Y. Liu, J. Chen and Y. Sun, Stud. Surf. Sci. Catal., 2005, 156, 249–256 CrossRef CAS.
- K. S. W. Sing, D. H. Everett, R. A. W. Haul, L. Moscou, R. A. Pierotti, J. Rouquérol and T. Siemieniewska, Pure Appl. Chem., 1985, 57, 603–619 CAS.
- A. Rachmat, W. Trisunaryanti, S. Sutarno and K. Wijaya, Mater. Renew. Sustain. Energy, 2017, 13, 1–9 Search PubMed.
- A. Patel, V. Brahmkhatri and N. Singh, Renewable Energy, 2013, 51, 227–233 CrossRef CAS.
- Y. Song, J. Tian, Y. Ye, Y. Jin, X. Zhou, J. Wang and L. Xu, Catal. Today, 2013, 212, 108–114 CrossRef CAS.
- Y. Uemichi, J. Nakamura, T. Itoh and M. Sugioka, Ind. Eng. Chem. Res., 1999, 38, 385–390 CrossRef CAS.
- F. A. Khowatimy, Y. Priastomo, E. Febriyanti, H. Riyantoko and W. Trisunaryanti, Procedia Environ. Sci., 2014, 20, 225–234 CrossRef CAS.
- T. Kimura, Catal. Today, 2003, 81, 57–63 CrossRef CAS.
- R. J. Fessenden and J. S. Fessenden, Organic Chemistry, Brooks/Cole Publishing Company, Monterey, 3rd edn, 1986 Search PubMed.
- J. Aguado, J. L. Sotelo, D. P. Serrano, J. A. Calles and J. M. Escola, Energy Fuels, 1997, 11, 1225–1231 CrossRef CAS.
- R. Bagri and P. T. Williams, J. Anal. Appl. Pyrolysis, 2002, 63, 29–41 CrossRef CAS.
- W. Trisunaryanti, Indones. J. Chem., 2002, 2, 30–40 CrossRef.
- S. R. Chandrasekaran, B. Kunwar, B. R. Moser, N. Rajagopalan and B. K. Sharma, Energy Fuels, 2015, 29, 6068–6077 CrossRef CAS.
- B. Li and R. D. Gonzalez, Appl. Catal., A, 1997, 165, 291–300 CrossRef CAS.
Footnote |
| † Electronic supplementary information (ESI) available. See DOI: 10.1039/c9ra08834b |
| This journal is © The Royal Society of Chemistry 2019 |

