 Open Access Article
Creative Commons Attribution 3.0 Unported Licence
Preparation and electroactive phase adjustment of Ag-doped poly(vinylidene fluoride) (PVDF) films†
Seung-Hyun Kimab,
So-Jeong Parka,
Chang-Yeol Choa,
Hong Suk Kang a,
Eun-Ho Sohn
 a,
In Jun Parka,
Jong-Wook Haa and
Sang Goo Lee
 *a
*a
aInterface Materials and Chemical Engineering Research Center, Korea Research Institute of Chemical Technology, Daejeon, 34114, Republic of Korea. E-mail: sgoo@krict.re.kr
bSchool of Chemical Engineering, Sungkyunkwan University, Suwon 16419, Republic of Korea
First published on 4th December 2019
Abstract
The crystallinities of Ag-doped poly(vinylidene fluoride) (PVDF) films were modified by removing Ag+ using a novel washing process, which allowed control of the ratio of γ- and β-phases. The polarity of the composite film without Ag+ removal through the washing process reached 98%, and the β-phase content in the total electroactive phase was increased to 61%, according to Fourier-transform infrared spectroscopy. When Ag+ were removed through a process involving several cycles of washing, filtering, drying, and re-dissolving, the highest ratio of the γ-phase was increased to 67%, 28% higher than that before washing. This showed that Ag+ induced β-phase formation while Ag nanoparticles induced γ-phase formation, and that the ratio of γ- and β-phases in PVDF composite films can be controlled to suit specific applications by this washing process.
Introduction
Extensive research has been conducted over the last few years on the development of high-performance energy harvesters for various applications, including self-powered sensors, smart skins, wearable electronics and portable electronics.1–3 Inorganic materials with high piezoelectric coefficients, such as BaTiO3, PbZrxTi1−xO3 (PZT), ZnO, ZnSnO3, and GaN, have attracted attention because they possess nanostructures that facilitate electricity harvesting from mechanical energy.4–12 However, the rigidity, brittleness, processing difficulties, and toxicity of these materials have limited their possible applications.13–17Polymer-based materials, on the other hand, are lightweight, flexible, and easy to process. Poly(vinylidene fluoride) (PVDF) is attractive because of its excellent pyro-, piezo-, and ferroelectricities.18–21 Moreover, flexibility, light weightness, easy processing, and presence of five crystallite phases (α, β, γ, δ, and ε)22–25 impart excellent mechanical properties, high thermal and chemical stabilities, and biocompatibility to PVDF.26–29 The polar β- and γ-forms are facilitate electrical applications.
Among the crystalizes polar phases with piezoelectric effect can be easily formed by external treatment such as stretching, heat treatment and poling (applying a high electric field) and crystalline induction of the film due to mixing with filler such as nanoparticles have.26,30–32 However, the crystallization induction of the film through an external treatment method has a disadvantage that it can induce an undesirable structural transformation and an incomplete crystal phase.33,34 Conversely, nanocomposite film formation of nano-fillers and PVDF can meet the requirements of device fabrication because it not only promotes the formation of polar phases in PVDF, but also improves the mechanical properties. Typically, different types of inorganic fillers are doped in PVDF to induce electroactive phases and improve electrical and mechanical properties.
Current methods for inducing crystalline polar phases with the piezoelectric effect in PVDF include stretching, heat treatment, poling, and addition of nanoparticle (NP) fillers to the PVDF matrix.26,30–32 While most of these methods can induce undesirable structural transformations and incomplete phases, the addition of NPs to PVDF promotes polar phase formation and improves mechanical properties.33,34 AgNPs have been widely studied as additives because of their high electrical and thermal conductivity, excellent catalytic activity in oxidation and reduction systems, effective anti-bacterial/anti-fouling action, and relatively low cost.35–38 However, the piezoelectric characteristics of AgNP/PVDF composite films depend on their electroactive phase composition, which is difficult to control using current manufacturing methods.
The aim of this study was to change the crystallinity of Ag+/AgNP/PVDF composite films by removing Ag+ through a new washing process and consequently control the ratio of γ- and β-phases. Compared to the afore-mentioned physical methods for modifying crystallinity, washing has not been well-studied or standardized. Herein, a washing process is outlined that allows for the removal of Ag+ from Ag+/AgNP/PVDF composite films to increase the ratio of the γ-phase.
Results and discussion
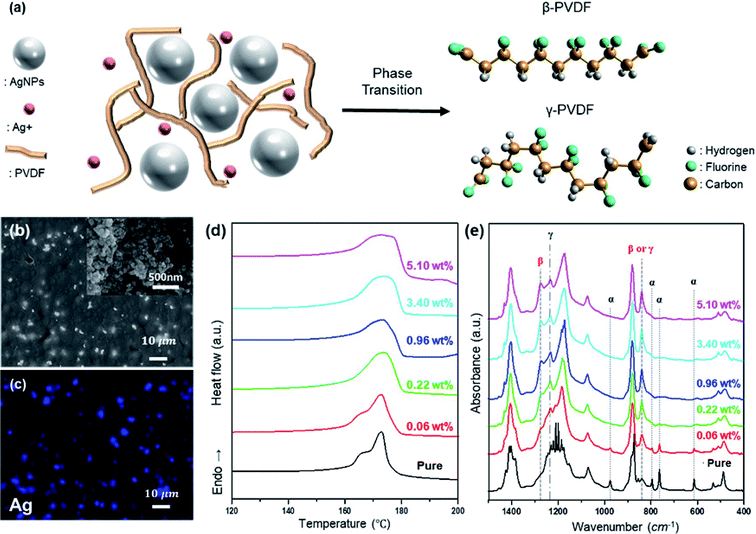
Studies on electroactive phase formation in PVDF nanocomposite films are mainly performed through FTIR spectroscopy, in which electroactive phases yield peaks at 840 cm−1.39 In addition, β-phase induction using AgNPs was reportedly effective in inducing electroactive phase formation in PVDF.40 However, when PVDF and AgNO3 are mixed for the formation of the PVDF/AgNP composite, and the electroactive phase is induced through film production, unreacted Ag+ remains, as shown in Fig. 1(a). The remaining Ag+ reacts with PVDF separately from AgNPs, thus affecting the electroactive phase induction of PVDF. To confirm this, the properties of the prepared Ag+/AgNP/PVDF films were studied. Ag+ and AgNPs are uniformly distributed in the prepared Ag+/AgNP/PVDF film, as shown in Fig. 1(b and c). The electroactive phase of PVDF is formed by PVDF–AgNP interaction; as the amount of Ag is increased, the reaction between PVDF and Ag is increased. Therefore, the electroactive phase content and melting temperature Tm are increased with increasing Ag, as shown in Fig. 1(d). In addition, the AgNPs and Ag+ induce electroactive phase formation in PVDF. As shown in Fig. 1(e), pure PVDF films prepared at 10 wt% and 80 °C show peaks at 975, 795, 764, and 614 cm−1 due to the α-phase. As the amount of Ag precursor is increased, these α-phase peaks disappear because of AgNP–PVDF and Ag+–PVDF interactions; instead, peaks at 840, 1233, and 1275 cm−1 from the polar β-and γ-phases appear. PVDF also has different melting points depending on the phase in which it exists.41 Pure PVDF has α- and γ-phases, and for these phases the peaks appear around 167 °C and 174 °C (Fig. 1(d)). Upon increasing the amount of Ag, the α-phase disappears and the γ-and β-phases emerge. The peaks appearing at 165 °C and 174 °C correspond to the γ- and β-phases. AgNPs and Ag+ tend to induce γ- and β-phase formation respectively. The peak corresponding to the β-phase appears with a polar solvent from hydrogen bonds between the PVDF chains and the F bridging AgNO3 and the PVDF chain.42 The γ-phase, meanwhile, is induced when the surface charges of AgNPs cause vibrational motion through electrostatic coupling between PVDF dipoles. Some parts of the PVDF polymer experience a polar induction from the reaction between the negative charge on the AgNP surface and the δ+, generated around the H atom of PVDF. However, the degree of polarity of the affected parts does not affect the rest of the polymer chain, leading to a γ-phase in the form of T3GT3G'.43As the amount of Ag precursor (AgNO3) increases, so does the quantity of unreacted Ag+. Therefore, in comparing Ag 0.96, 3.40, and 5.10%, the total polar phases are similar, but as the amount of precursor increases, the peak at 1275 cm−1 representing the β-phase is heightened. Increasing the amount of hydrazine fraction of Ag+ reduction is also increased and thus the amount of AgNPs. As a result, the β-phase is decreased and the γ-phase is increased as shown in Fig. S1.†
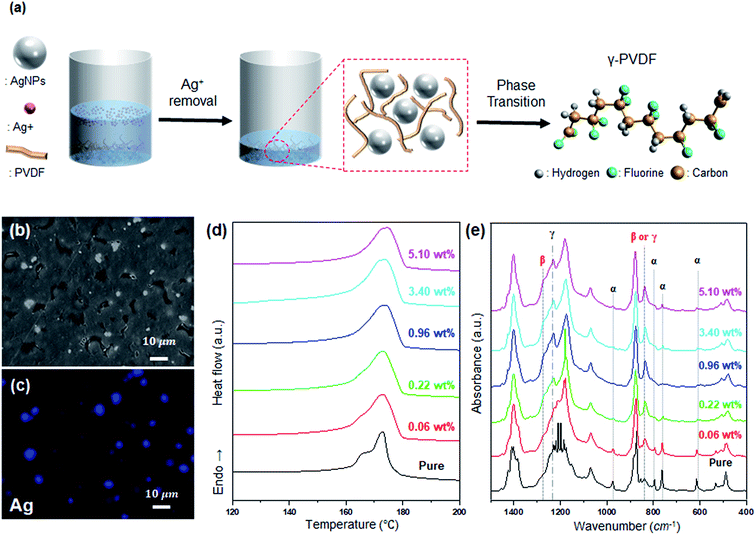
The modification of the PVDF electroactive phase to γ-phase is achieved through washing, as shown in Fig. 2(a). As shown in Fig. 2(b and c), the AgNP/PVDF composite films are formed such that AgNPs are uniformly distributed in the PVDF. These films lack the Ag+–PVDF interactions described above. Therefore, as AgNP concentration is increased, the electroactive phase induction of PVDF by AgNPs is increased, and the electroactive phase is also increased only up to a certain concentration. However, since excess AgNPs interfere with the reaction between the adjacent AgNPs and PVDF, the total percentage of the polar phase is decreased.44,45 As a result, the film Tm increases until 0.96 wt%, as shown in Fig. 2(d), but decreases again starting from 3.4 wt%. As shown in Fig. 2(b), α-phase is predominant until 0.06 wt%, but after 0.22 wt%, γ-phase is generated and α-phase is decreased. Therefore, the Tm of the film is increased, and is highest at 0.96 wt% with the highest γ-phase. Tm decreases from 3.4 wt% because of the predominance of the α-phase.
Unlike Ag+, AgNPs induce γ-phase formation in PVDF. As shown in Fig. 1(e), when the Ag concentration is increased, the peaks at 975, 795, 764, and 614 cm−1 from the α-phase are diminished, and peaks at 1233 and 1275 cm−1 appear from the polar phase. However, as shown in Fig. 2(e), when Ag+ is removed and only AgNPs are present, peaks at 975, 795, 764, and 614 cm−1 from the α-phase are decreased with increasing Ag concentration, and the peak at 1235 cm−1 from the γ-phase is increased. These results demonstrate that Ag+ induces β-phase formation and that of the polar phase composition of PVDF can be controlled.
Data analysis using XRD was also performed to confirm the control over the polar phase ratio of PVDF. As shown in Fig. S2(a and b),† the Ag/PVDF composite film before the washing process had a peak of 18.5° corresponding to the γ (202) plane and broad peaks at 20.2° and 20.5° corresponding to the β (110) and (110/200) planes. However, after washing, only peaks at 18.5° and 20.2° appeared, as shown in Fig. S2(c and d).† The peak at 38.5° indicated the presence of AgNPs.
The crystallinity (Xc) in the Ag/PVDF composite film can be quantitatively calculated using the following equation,46
 | (1) |
 and ΔHf are the enthalpy of melting for 100% crystalline PVDF (104.7 J g−1) and the Ag/PVDF composite film, respectively. The crystallinity of the pure PVDF film is 41.67%, while the crystallinity of Ag/PVDF composite films slightly increases (refer Table S1†). After washing the films, the AgNP/PVDF film showed the highest crystallinity of 42.71% at 5.10 wt% whereas the Ag+/AgNP/PVDF film with both γ- and β-phases before washing also showed a maximum crystallinity of 43.33% at 5.10 wt%. This indicates that not only the γ- and β-phases of the film increased, but also the total crystallinity slightly increased.
Data analysis using XRD was also performed to confirm the control over the polar phase ratio of PVDF. As shown in Fig. S2(a and b),† the Ag/PVDF composite film before the washing process had a peak of 18.5° corresponding to the γ (202) plane and broad peaks at 20.2° and 20.5° corresponding to the β (110) and (110/200) planes. However, after washing, only peaks at 18.5° and 20.2° appeared, as shown in Fig. S2(c and d).† The peak at 38.5° indicated the presence of AgNPs.
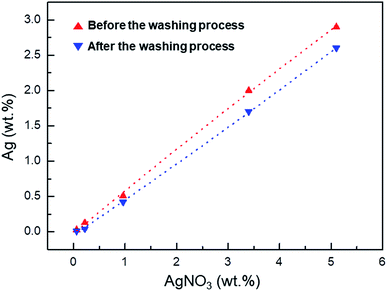
As shown by the ICP data in Fig. 3, the washing process removes unreacted Ag+, reducing the Ag+ concentration in the Ag+/AgNP/PVDF composite film. The conversion rate of Ag+ to AgNPs is calculated by the Ag wt% value present in the sample before and after washing. These values are 37, 31.5, 82.4, 85, and 89.7% for 0.06, 0.22, 0.96, 3.40, and 5.10 wt% AgNO3, respectively. As the concentration of AgNO3 in the sample is increased, the amount of Ag+ that can be converted into AgNPs is also increased, thus increasing the Ag+–AgNP conversion.
 | ||
| Fig. 3 Inductively coupled plasma (ICP) data of Ag atoms in films with 0.06, 0.22, 0.96, 3.40, and 9.10 wt% AgNO3 affected by the washing process. | ||
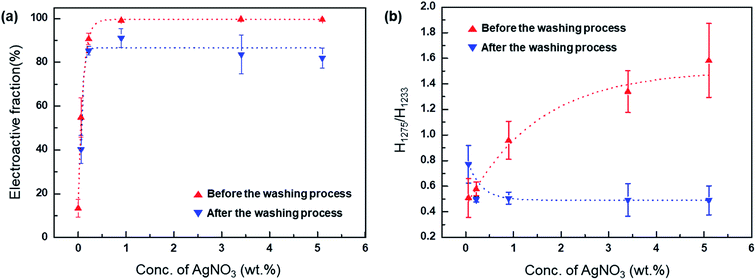
The fractions of the electroactive phase (β + γ) in the PVDF composite film can be quantitatively calculated using the following equation:47
 | (2) |
The fractions of the electroactive phase were calculated using the absorbance of the peak at 840 cm−1. However, this peak reflects both β- and γ-phases. To confirm the effect of Ag+ on β phase induction, quantitative values of β- and γ-phases were needed. The quantification of individual β- and γ-phases was performed using the absorbance of the two peaks (1275 and 1234 cm−1) and the following equation:
 | (3) |
Experimental
Materials
The PVDF polymer was Solef® 6008 (Solvay Solexis) and the solvent was N,N-dimethylformamide (DMF, Sigma-Aldrich, USA). AgNO3 (Sigma-Aldrich, USA) was used as an Ag+/AgNP precursor. Hydrazine monohydrate (NH2NH2·H2O, Junsei Chemical, Japan), in the same molar ratio as AgNO3, was added as a reducing agent to the DMF/PVDF/AgNO3 system to reduce Ag+ to AgNPs.Methods
Half of each reaction solution was dried in a vacuum oven at 80 °C for 24 h; this portion was used to form Ag+/AgNP/PVDF films. The remaining half was subjected to a washing process to remove Ag+ and form AgNP/PVDF composite films. The solution was washed three times in triple distilled water. In this process, the reaction solution was precipitated in water, stirred for 1 h, filtered, and dried in a vacuum oven at 80 °C for 24 h followed by re-dissolution in DMF. The washing–precipitation–re-dissolution procedure was repeated five times for each reaction solution. Finally, the unwashed and washed samples were dissolved in DMF to prepare 10 wt% casting solutions of equal concentrations.
Characterization
The crystalline phases of PVDF were identified by Fourier-transform infrared spectroscopy (FT-IR, Bruker ALPHA-T & ALPHA-P). The film morphologies were investigated by field-emission scanning electron microscopy (FE-SEM, TESCAN Mira 3 LMU FEG) and energy dispersive spectroscopy (EDS, Bruker Quantax 200). Inductively coupled plasma-atomic emission spectroscopy (ICP-AES, Thermo Fisher Scientific iCAP 6500Duo) was conducted to determine the relative amount of Ag+ to NP conversions before and after washing. A differential scanning calorimeter (DSC, Q1000 V9.9 Build 303) was calibrated with in before use and calorimetry was performed in N2 atmosphere. The films were heated at 5°C min−1 from 0 to 220 °C.Conclusion
Polar crystal phase formation was induced in PVDF through the preparation of PVDF composite films with Ag+ and AgNPs. In addition, the concentrations of β- and γ-phases were controlled using a novel washing process. The polarity of the Ag+/AgNP/PVDF composite film before washing reached 98%, and the ratio of the β phase was 61%. The polarity of the composite film after washing was 85%, lower than that before washing. However, of the total polar phase of PVDF, the ratio of the β phase was decreased and the ratio of the γ-phase was increased to 67%, demonstrating the ability of Ag+ and AgNPs to induce β- and γ-phase formation, respectively. These results indicated that the polar phase and, thus, polarity of PVDF can be easily adjusted, thereby promoting various applications such as outdoor energy harvesting, self-powered wearable devices, and portable sensors.Conflicts of interest
The authors declare no competing financial interest.Acknowledgements
This research is supported by the Korea Institute of Energy Technology Evaluation and Planning (KETEP) grant funded by the Korea Government Ministry of Trade, Industry and Energy (grant no. 201720104830).References
- U. Yaqoob, A. S. M. I. Uddin and G.-S. Chung, Appl. Surf. Sci., 2017, 405, 420–426 CrossRef CAS
.
- C. Sun, J. Shi and X. Wang, J. Appl. Phys., 2010, 108, 034309–034320 CrossRef
.
- J. H. Jung, M. Lee, J. I. Hong, Y. Ding, C. Y. Chen, L. J. Chou and Z. L. Wang, ACS Nano, 2011, 5, 10041–10046 CrossRef CAS PubMed
.
- Z. L. Wang and J. Song, Science, 2006, 312, 242–246 CrossRef CAS PubMed
.
- M. Koo, K.-I. Park, S. H. Lee, M. Suh, D. Y. Jeon, J. W. Choi, K. Kang and K. J. Lee, Nano Lett., 2012, 12, 4810–4816 CrossRef CAS
.
- S. Kim, H. Y. Jeong, S. K. Kim, S. -Y. Choi and K. J. Lee, Nano Lett., 2011, 11, 5438–5442 CrossRef CAS PubMed
.
- K.-I. Park, C. K. Jeong, J. Ryu, G.-T. Hwang and K. J. Lee, Adv. Energy Mater., 2013, 3, 1539–1544 CrossRef CAS
.
- P. Adhikary, A. Biswas and D. Mandal, Nanotechnology, 2016, 27, 495501 CrossRef
.
- M. M. Alam, S. K. Ghosh, A. Sultana and D. Mandal, Nanotechnology, 2015, 26, 165403 CrossRef
.
- A. Sultana, M. M. Alam, S. Garain, T. K. Sinha, T. R. Middya and D. Mandal, ACS Appl. Mater. Interfaces, 2015, 7, 19091–19097 CrossRef CAS PubMed
.
- M. M. Alam and D. Mandal, ACS Appl. Mater. Interfaces, 2016, 8, 1555–1558 CrossRef CAS PubMed
.
- T. Q. Trung and N.-E. Lee, Adv. Mater., 2016, 28, 4338–4472 CrossRef CAS PubMed
.
- C. S. Lee, J. Joo, S. Han and S. K. Koh, Appl. Phys. Lett., 2004, 85, 1841–1843 CrossRef CAS
.
- C. S. Lee, J. Joo, S. Han, J. H. Lee and S. K. Koh, Synth. Met., 2005, 152, 49–52 CrossRef CAS
.
- M. M. Alam, A. Sultana, D. Sarkar and D. Mandal, Nanotechnology, 2017, 28, 365401 CrossRef PubMed
.
- S. Jana, S. Garain, S. Sen and D. Mandal, Phys. Chem. Chem. Phys., 2015, 17, 17429–17436 RSC
.
- Y. N. Hao, X. H. Wang, S. O'Brien, J. Lombardi and L. T. Li, J. Mater. Chem. C, 2015, 3, 9740–9747 RSC
.
- A. Vinogradov and F. Holloway, Ferroelectrics, 1999, 226, 169–181 CrossRef CAS
.
- B. Ameduri, Chem.–Eur. J., 2018, 24, 18830–18841 CrossRef CAS
.
- J. Gomes, J. S. Nunes, V. Sencadas and S. Lanceros-Mendez, Smart Mater. Struct., 2010, 19, 065010 CrossRef
.
- H. R. Gallantree, IEE Proc., Part I: Solid-State Electron Devices, 1983, 130, 219–224 CAS
.
- H. S. Nalwa, Ferroelectric Polymers: Chemistry, Physics, and Applications, Marcel Dekker, New York 1995 Search PubMed
.
- T. T. Wang, J. M. Herbert and A. M. Glass, The Applications of Ferroelectric Polymers, Chapman and Hall, New York, 1988 Search PubMed
.
- A. Issa, M. A. Al-Maadeed, A. S. Luyt, M. Mrlik and M. K. Hassan, J. Appl. Polym. Sci., 2016, 133, 2–13 CrossRef
.
- A. Al-Saygh, D. Ponnamma, M. A. Al Maadeed, P. Vijayan, A. Karim and M. K. Hassan, Polymers, 2017, 9, 33 CrossRef
.
- Y. Zhao, Q. Liao, G. Zhang, Z. Zhang, Q. Liang, X. Liao and Y. Zhang, Nano Energy, 2015, 11, 719–727 CrossRef CAS
.
- N. Jia, Q. Xing, G. Xia, J. Sun, R. Song and W. Huang, Mater. Lett., 2015, 139, 212–215 CrossRef CAS
.
- P. Talemi, M. Delaigue, P. Murphy and M. Fabretto, ACS Appl. Mater. Interfaces, 2015, 7, 8465–8471 CrossRef
.
- V. Cauda, S. Stassi, K. Bejtka and G. Canavese, ACS Appl. Mater. Interfaces, 2013, 5, 6430–6437 CrossRef CAS PubMed
.
- Y. Kim, Y. Xie, X. Wen, S. Wang, S. J. Kim, H. Song and Z. L. Wang, Nano Energy, 2015, 14, 77–86 CrossRef CAS
.
- M. S. Sebastian, A. Larrea, R. Gonçalves, T. Alejo, J. L. Vilas, V. Sebastian, P. Martins and S. Lanceros-Mendez, RSC Adv., 2016, 6, 113007–113015 RSC
.
- S.-H. Kim, J.-W. Ha, S. G. Lee, E.-H. Sohn, I. J. Park, H. S. Kang and G.-R. Yi, Langmuir, 2019, 35, 8816–8822 CrossRef CAS PubMed
.
- B.-E. E. Mohajir and N. Heymans, Polymer, 2001, 42, 5661–5667 CrossRef
.
- V. Sencadas, R. Gregorio and S. Lanceros-Méndez, J. Macromol. Sci., Part B: Phys., 2009, 48, 514–525 CrossRef CAS
.
- B. Li, C. Xu, J. Zheng and C. Xu, Sensors, 2014, 14, 9889–9899 CrossRef PubMed
.
- Z.-M. Dang, S.-S. You, J.-W. Zha, H.-T. Song and S.-T. Li, Phys. Status Solidi, 2010, 207, 739–742 CrossRef CAS
.
- J. H. Li, X. S. Shao, Q. Zhou, M. Z. Li and Q. Q. Zhang, Appl. Surf. Sci., 2013, 265, 663–670 CrossRef CAS
.
- J. Compton, D. Kranbuehl, G. Martin, E. Espuche and L. David, Macromol. Symp., 2007, 247, 182–189 CrossRef CAS
.
- X. Cai, T. Lei, D. Sund and L. Lin, RSC Adv., 2017, 7, 15382–15389 RSC
.
- D.-M. Ren, H.-K. Huang, Y. Yu, Z.-T. Li, L.-W. Jiang, S.-M. Chen, K.-H. Lam, B. Lin, B. Shi, F.-A. He and H.-J. Wu, J. Nanosci. Nanotechnol., 2018, 18, 3274–3282 CrossRef CAS
.
- P. Martins, A. C. Lopes and S. Lanceros-Mendez, Prog. Polym. Sci., 2014, 39, 683–706 CrossRef CAS
.
- M. Benz, W. B. Euler and O. J. Gregory, Macromolecules, 2002, 35, 2682–2688 CrossRef CAS
.
- H. Liow, X. Lu, C. F. Tan, K. H. Chan, K. Zeng, S. Li and G. W. Ho, Small, 2018, 14, 1702268 CrossRef PubMed
.
- C. Tsonos, N. Pandis, D. Soin, E. Sakellari, S. Myrovali, A. Kripotou, A. Kanapitsas and E. Siores, eXPRESS Polym. Lett., 2015, 9, 1104–1118 CrossRef CAS
.
- P. Martins, C. M. Costa and S. Lanceros-Mendez, Appl. Phys. A, 2011, 103, 233–237 CrossRef CAS
.
- J. Liu, X. Lu and C. Wu, Membranes, 2013, 3, 389–405 CrossRef PubMed
.
- R. Gregorio Jr and M. Cestari, J. Polym. Sci., Part B: Polym. Phys., 1994, 32, 859–870 CrossRef
.
Footnote |
| † Electronic supplementary information (ESI) available: Additional data for the FT-IR spectra of Ag+/AgNP/PVDF composite film according to the amount of hydrazine (Fig. S1), the melting enthalpy (ΔHf) and total crystallinity (Xc) of PVDF films (Table S1), and XRD patterns and their curve deconvolution (Fig. S2) in the literature (PDF). See DOI: 10.1039/c9ra08763j |
| This journal is © The Royal Society of Chemistry 2019 |


