DOI:
10.1039/C9RA08875J
(Paper)
RSC Adv., 2019,
9, 41126-41134
Inhibiting effect of CO2 on the oxidative combustion thermodynamics of coal
Received
29th October 2019
, Accepted 5th December 2019
First published on 12th December 2019
Abstract
A thermal analysis experiment was conducted in O2/N2/CO2 and O2/N2 atmospheres (O2 concentrations were 21, 14, 8, and CO2 concentrations were 0, 39, 46, 52) to investigate the thermal behavior of coal oxidation and combustion. Results demonstrated that an elevated CO2 concentration or decreased O2 concentration had a delaying effect on the thermogravimetric analysis and differential scanning calorimetry (DSC) curves; moreover, the characteristic temperatures were substantially augmented. When the O2 concentration was 21 vol%, the total heat released by coals A (highly volatile bituminous coal) and B (anthracite coal) decreased by 5.8% and 4.1%, respectively, after CO2 addition. The comprehensive combustion performance index was also lowered. The DSC curve can be divided into two exothermic peaks, and the ratio of the peak 1 to peak 2 areas decreased with the addition of CO2, which indicated that CO2 inhibited the oxidation of the active functional groups of coal structures. Apparent activation energy in O2/CO2/N2 was less than that in O2/N2.
1. Introduction
Coal is one of the most commonly used fossil energy resources in the world.1 However, spontaneous combustion of coal is commonplace in many coal-producing countries, resulting in not only safety problems and resource waste2–4 but also ecological damage and environmental pollution.5,36 Therefore, understanding the characteristics of coal spontaneous combustion and developing preventative technology is crucial.6 Conventional techniques adopted to prevent and control coal spontaneous combustion are irrigation with water and loess mud.7 However, water and loess mud are unable to completely cover areas affected by the spontaneous combustion of coal. Consequently, a series of coal fire prevention and extinguishment materials, such as cellular grout, three-phase foam, gel foam, and suspension sand have been developed.8,37 CO2 has not only a density greater than air but also an effective flame retardant effect. As a result, pouring CO2 into a goaf will completely bury the lower area, which is beneficial for the prevention and control of coal fires.9 Therefore, CO2 firefighting technology has been developed, and used in the prevention and control of coal fires. Therefore, the inhibiting effect of CO2 on spontaneous combustion of coal under different conditions is the key to improving and using CO2 firefighting technology. But previous publications have focused on the characteristics of coal oxidation and combustion, and relevant experimental techniques such as thermogravimetric analysis (TGA) and differential scanning calorimetry (DSC) have been increasingly used.10–12 Rotaru et al.13 discovered that different types of coal demonstrated different apparent activation energies in the process of spontaneous combustion. Deng et al.14 determined that a large difference in activation energy existed between the oxidation and combustion stages. The study of oxygen-enriched combustion characteristics involves examining the impact of CO2 on coal combustion.15 Liu et al.16 combusted two chars in O2/CO2 and O2/N2 atmospheres and found that substituting CO2 for inert nitrogen in the oxidizer had a subtle effect on coal combustion. Várhegyi et al.17 demonstrated that during coal combustion in an O2/CO2 atmosphere, the net reaction rate of coal combustion was only proportional to the partial pressure of oxygen. Rathnam et al.18 revealed that combustion reactivity prominently increased at high temperature stages in a 2% O2/CO2 atmosphere compared with a 2% O2/N2 atmosphere Zhou et al.19 discovered that CO2 has a delayed effect on the maximum mass-loss rate and burnout temperature in the coal combustion process. Therefore, the influence of CO2 on characteristics of coal oxidation and combustion should be further study.
To further examine the inhibiting effect of CO2 on the characteristics of coal oxidation and combustion in different atmospheres, this study used the TGA and DSC methods to analyze the thermal behaviors and variation of apparent activation energies in O2/N2/CO2 and O2/N2 atmospheres. The main purposes of this research were to: (1) investigate the thermal behavior in different atmospheres; (2) analyze the effect of CO2 and oxygen concentration on apparent activation energies during oxidation and combustion of coal; (3) research the influence of CO2 and oxygen concentration on coal oxidation and combustion. The results are useful for understanding the oxidation and combustion characteristics of coal in O2/N2/CO2 and O2/N2 atmospheres and can aid development of CO2 fire prevention technology.
2. Experiments and methods
2.1. Experimental samples
Coal A was highly volatile bituminous coal and was collected from the Juye mining area in Shandong Province, China, whereas coal B was anthracite coal and came from the Furong mining area in Sichuan Province, China. The proximate and ultimate analyses of the two samples are listed in Table 1. The samples had a particle size of 0.067–0.079 mm and were stored in an airtight container.
Table 1 Proximate and ultimate analyses of the two coal samples
| Coal sample |
Proximate analysis (air-dried basis, mass%) |
Ultimate analysis (%, daf.) |
| Moisture |
Ash |
Volatile matter |
Fixed carbon |
C |
H |
O |
N |
S |
| Coal A |
2.3 |
9.7 |
34.85 |
53.15 |
85.71 |
4.58 |
7.48 |
1.54 |
0.69 |
| Coal B |
1.4 |
26.02 |
8.85 |
63.73 |
89.69 |
3.61 |
1.71 |
2.85 |
2.14 |
2.2. Experimental details
A synchronous thermal analyzer, STA449F3 (Netzseh, Germany), was employed to conduct the experimental tests. The heating rates were set as 5, 10, and 15 °C min−1. The experimental samples were heated from 30 to 800 °C for each heating rate. The gases, mixtures of O2, N2, and CO2, were constantly supplied at a 100 mL min−1 flow rate. Table 2 presents the gas mixtures with different volume fractions of O2, N2, and CO2.
Table 2 Gases supplied when undergoing thermal analysis experiments
| Gas |
Volume fraction (vol%) |
| 1 |
2 |
3 |
4 |
5 |
6 |
| O2 |
21 |
14 |
8 |
21 |
14 |
8 |
| CO2 |
0 |
0 |
0 |
39 |
46 |
52 |
| N2 |
79 |
86 |
92 |
40 |
40 |
40 |
2.3. Analysis methods
According to the heating rate used in the experiments, single heating rate and multi-rate heating rate methods were concluded to calculate the activation energy. In addition, the single heating rate method must determine the mechanism functions before calculating the activation energy,20 which may cause errors in the process of selecting mechanism functions. However, the multi-heating rate method can avoid the selection of mechanism functions to obtain more accurate values of activation energy. For instance, Kissinger–Akahira–Sunose (KAS) method and Flynn–Wall–Ozawa (FWO) widely used to the calculation of activation energy, as eqn (1) and (2), respectively.21| |
 | (1) |
| |
 | (2) |
According to the analysis of Starink,21 KAS method developed by Starink offers more accurate estimates of Eα, as described in eqn (3):
| |
 | (3) |
The comprehensive combustion performance index (K) was used to comprehensively evaluate the characteristics of coal spontaneous combustion, and is expressed in eqn (2):22
| |
 | (4) |
3. Results and discussion
3.1. Features on TG-DSC tests
According to the characteristic temperatures in Fig. 1, the mass variation of coal was divided into three stages: the low-temperature pyrolysis stage (stage 1), oxygen-adsorption stage (stage 2), and combustion stage (stage 3). The boundary temperatures for stage 2 were T1 and Tig, where T1 is the initial temperature when the coal's mass continuously increases and Tig is the ignition temperature.20 Furthermore, T2 was defined as the temperature at which the maximum exothermic peak is completed on the DSC curve. Stage 1 was from the initial temperature to T1. Stage 3 was from Tig to T2.
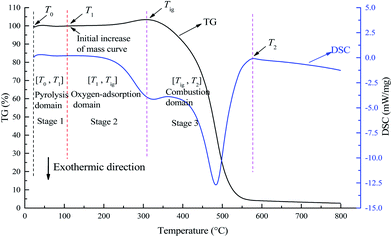 |
| | Fig. 1 TG and DSC curves of a coal sample showing the temperature boundaries for different stages. This individual diagram is obtained from the thermal analysis of coal A conversion under 21 vol% O2/79 vol% N2 and heating rate of 5 °C min−1. | |
3.2. Mass variation
Fig. 2 illustrates the TG and differential thermogravimetry (DTG) curves, and the characteristic temperatures are given in Table 3 with a heating rate of 5 °C min−1.
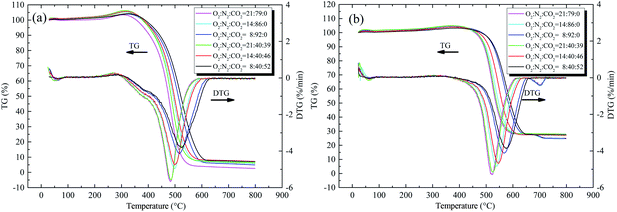 |
| | Fig. 2 TG and DTG curves of the two coal samples with the heating rate of 5 °C min−1 under different atmospheres, (a) coal A and (b) coal B. | |
Table 3 Characteristic temperatures during combustion of coal with heating rate of 5 °C min−1
Sample Atmosphere (O2![[thin space (1/6-em)]](https://www.rsc.org/images/entities/char_2009.gif) : :![[thin space (1/6-em)]](https://www.rsc.org/images/entities/char_2009.gif) N2 N2![[thin space (1/6-em)]](https://www.rsc.org/images/entities/char_2009.gif) : :![[thin space (1/6-em)]](https://www.rsc.org/images/entities/char_2009.gif) CO2) CO2) |
Coal A |
Coal B |
| T1 (°C) |
Tig (°C) |
Tmax (°C) |
T2 (°C) |
T1 (°C) |
Tig (°C) |
Tmax (°C) |
T2 (°C) |
21![[thin space (1/6-em)]](https://www.rsc.org/images/entities/char_2009.gif) : :![[thin space (1/6-em)]](https://www.rsc.org/images/entities/char_2009.gif) 79 79![[thin space (1/6-em)]](https://www.rsc.org/images/entities/char_2009.gif) : :![[thin space (1/6-em)]](https://www.rsc.org/images/entities/char_2009.gif) 0 0 |
81.3 |
308.4 |
482.9 |
579.5 |
83.35 |
367.6 |
523.2 |
617.9 |
14![[thin space (1/6-em)]](https://www.rsc.org/images/entities/char_2009.gif) : :![[thin space (1/6-em)]](https://www.rsc.org/images/entities/char_2009.gif) 86 86![[thin space (1/6-em)]](https://www.rsc.org/images/entities/char_2009.gif) : :![[thin space (1/6-em)]](https://www.rsc.org/images/entities/char_2009.gif) 0 0 |
79.1 |
313.6 |
500.1 |
591.1 |
81.45 |
370.1 |
539.7 |
627 |
8![[thin space (1/6-em)]](https://www.rsc.org/images/entities/char_2009.gif) : :![[thin space (1/6-em)]](https://www.rsc.org/images/entities/char_2009.gif) 92 92![[thin space (1/6-em)]](https://www.rsc.org/images/entities/char_2009.gif) : :![[thin space (1/6-em)]](https://www.rsc.org/images/entities/char_2009.gif) 0 0 |
83.1 |
323.1 |
516.2 |
616.4 |
70.25 |
382.3 |
567.1 |
649.2 |
21![[thin space (1/6-em)]](https://www.rsc.org/images/entities/char_2009.gif) : :![[thin space (1/6-em)]](https://www.rsc.org/images/entities/char_2009.gif) 40 40![[thin space (1/6-em)]](https://www.rsc.org/images/entities/char_2009.gif) : :![[thin space (1/6-em)]](https://www.rsc.org/images/entities/char_2009.gif) 39 39 |
71.9 |
309.2 |
485.4 |
583.4 |
84.55 |
371.7 |
524.9 |
618.8 |
14![[thin space (1/6-em)]](https://www.rsc.org/images/entities/char_2009.gif) : :![[thin space (1/6-em)]](https://www.rsc.org/images/entities/char_2009.gif) 40 40![[thin space (1/6-em)]](https://www.rsc.org/images/entities/char_2009.gif) : :![[thin space (1/6-em)]](https://www.rsc.org/images/entities/char_2009.gif) 46 46 |
80.6 |
317.9 |
499.7 |
598.7 |
81.45 |
378.6 |
546 |
634.7 |
8![[thin space (1/6-em)]](https://www.rsc.org/images/entities/char_2009.gif) : :![[thin space (1/6-em)]](https://www.rsc.org/images/entities/char_2009.gif) 40 40![[thin space (1/6-em)]](https://www.rsc.org/images/entities/char_2009.gif) : :![[thin space (1/6-em)]](https://www.rsc.org/images/entities/char_2009.gif) 52 52 |
75.7 |
325.5 |
523.9 |
627.5 |
80.55 |
387.4 |
576.5 |
660.2 |
Both the increase of the CO2 concentration and decrease of the O2 concentration made the TG/DTG curve move to a high temperature range, as illustrated in Fig. 2. Tig and Tmax decreased with increasing O2 concentration. For example, when the O2 concentration was reduced from 21 to 8 vol%, the Tig of coal A increased from 308.4 to 323.1 °C, and the Tig of coal B increased from 309.2 to 325.5 °C (Table 3). The lower the oxygen concentration in the environment, the lower the number of activated oxygen molecules. Therefore, the opportunities of collision between activated oxygen molecules and active functional groups of coal is significantly reduced, and the reaction between coal and oxygen becomes difficult. This finding is in agreement with the reports by Deng et al.,14 Wang et al.,23 and Liu et al.24 When the O2 concentration was constant, increasing the CO2 concentration had a delay effect on the TG and DTG curves, whereas the characteristic temperatures increased along with CO2 concentration. As Table 3 shows, when the O2 concentration was 21 vol% and the CO2 concentration was increased from 0 to 52 vol%, the ignition temperature of coal A increased from 323.1 to 325.5 °C and the ignition temperature of coal B increased from 382.3 to 387.4 °C. The diffusion rate of O2 in CO2 is lower than that in N2, which has an adverse effect on the transportation of O2 from the gas mixture to the coal particle surface.23,25 In addition, CO2 is much easier for coal to physically adsorb than O2 and N2.26,27 Therefore, adsorption of CO2 occupies some of the active sites on the coal surface, inhibiting the ability of O2 and coal to interact.
3.3. Exothermic properties
3.3.1. Differential scanning calorimetry. The DSC and first-order differential of DSC (DDSC) curves for the two coal samples from 30 to 800 °C were illustrated in Fig. 3. Total heat release is presented in Table 4.
 |
| | Fig. 3 DSC and DDSC curves of the two coal samples with the heating rate of 5 °C min−1 under different atmospheres, (a) coal A and (b) coal B. | |
Table 4 Factors used to fit sub-peaks for DSC curves and total heat release and the maximum of exothermic peak with heating rate of 5 °C min−1
| Coal sample |
Atmosphere (O2![[thin space (1/6-em)]](https://www.rsc.org/images/entities/char_2009.gif) : :![[thin space (1/6-em)]](https://www.rsc.org/images/entities/char_2009.gif) N2 N2![[thin space (1/6-em)]](https://www.rsc.org/images/entities/char_2009.gif) : :![[thin space (1/6-em)]](https://www.rsc.org/images/entities/char_2009.gif) CO2) CO2) |
Peak |
v0 |
S |
tc |
w |
R2 |
Q (kJ g−1) |
| Coal A |
21![[thin space (1/6-em)]](https://www.rsc.org/images/entities/char_2009.gif) : :![[thin space (1/6-em)]](https://www.rsc.org/images/entities/char_2009.gif) 79 79![[thin space (1/6-em)]](https://www.rsc.org/images/entities/char_2009.gif) : :![[thin space (1/6-em)]](https://www.rsc.org/images/entities/char_2009.gif) 0 0 |
1 |
0.306 |
−172.495 |
66.473 |
35.291 |
0.9896 |
19.247 |
| 2 |
−162.325 |
90.641 |
13.913 |
14![[thin space (1/6-em)]](https://www.rsc.org/images/entities/char_2009.gif) : :![[thin space (1/6-em)]](https://www.rsc.org/images/entities/char_2009.gif) 86 86![[thin space (1/6-em)]](https://www.rsc.org/images/entities/char_2009.gif) : :![[thin space (1/6-em)]](https://www.rsc.org/images/entities/char_2009.gif) 0 0 |
1 |
0.156 |
−158.973 |
68.084 |
35.237 |
0.9939 |
17.891 |
| 2 |
−159.263 |
93.457 |
15.907 |
8![[thin space (1/6-em)]](https://www.rsc.org/images/entities/char_2009.gif) : :![[thin space (1/6-em)]](https://www.rsc.org/images/entities/char_2009.gif) 92 92![[thin space (1/6-em)]](https://www.rsc.org/images/entities/char_2009.gif) : :![[thin space (1/6-em)]](https://www.rsc.org/images/entities/char_2009.gif) 0 0 |
1 |
0.042 |
−139.887 |
69.772 |
34.700 |
0.9972 |
17.296 |
| 2 |
−175.342 |
97.945 |
19.815 |
21![[thin space (1/6-em)]](https://www.rsc.org/images/entities/char_2009.gif) : :![[thin space (1/6-em)]](https://www.rsc.org/images/entities/char_2009.gif) 40 40![[thin space (1/6-em)]](https://www.rsc.org/images/entities/char_2009.gif) : :![[thin space (1/6-em)]](https://www.rsc.org/images/entities/char_2009.gif) 39 39 |
1 |
−0.141 |
−162.444 |
66.061 |
34.582 |
0.9889 |
18.177 |
| 2 |
−158.456 |
90.895 |
14.639 |
14![[thin space (1/6-em)]](https://www.rsc.org/images/entities/char_2009.gif) : :![[thin space (1/6-em)]](https://www.rsc.org/images/entities/char_2009.gif) 40 40![[thin space (1/6-em)]](https://www.rsc.org/images/entities/char_2009.gif) : :![[thin space (1/6-em)]](https://www.rsc.org/images/entities/char_2009.gif) 46 46 |
1 |
−0.274 |
−118.875 |
67.107 |
33.344 |
0.9942 |
17.893 |
| 2 |
−150.177 |
94.420 |
18.585 |
8![[thin space (1/6-em)]](https://www.rsc.org/images/entities/char_2009.gif) : :![[thin space (1/6-em)]](https://www.rsc.org/images/entities/char_2009.gif) 40 40![[thin space (1/6-em)]](https://www.rsc.org/images/entities/char_2009.gif) : :![[thin space (1/6-em)]](https://www.rsc.org/images/entities/char_2009.gif) 52 52 |
1 |
−0.093 |
−131.845 |
70.106 |
34.198 |
0.9938 |
17.794 |
| 2 |
−172.622 |
99.379 |
20.963 |
| Coal B |
21![[thin space (1/6-em)]](https://www.rsc.org/images/entities/char_2009.gif) : :![[thin space (1/6-em)]](https://www.rsc.org/images/entities/char_2009.gif) 79 79![[thin space (1/6-em)]](https://www.rsc.org/images/entities/char_2009.gif) : :![[thin space (1/6-em)]](https://www.rsc.org/images/entities/char_2009.gif) 0 0 |
1 |
0.038 |
−103.340 |
82.755 |
38.798 |
0.9972 |
15.308 |
| 2 |
−138.154 |
97.773 |
12.381 |
14![[thin space (1/6-em)]](https://www.rsc.org/images/entities/char_2009.gif) : :![[thin space (1/6-em)]](https://www.rsc.org/images/entities/char_2009.gif) 86 86![[thin space (1/6-em)]](https://www.rsc.org/images/entities/char_2009.gif) : :![[thin space (1/6-em)]](https://www.rsc.org/images/entities/char_2009.gif) 0 0 |
1 |
−0.165 |
−89.947 |
83.914 |
39.612 |
0.9984 |
13.812 |
| 2 |
−141.981 |
100.100 |
13.747 |
8![[thin space (1/6-em)]](https://www.rsc.org/images/entities/char_2009.gif) : :![[thin space (1/6-em)]](https://www.rsc.org/images/entities/char_2009.gif) 92 92![[thin space (1/6-em)]](https://www.rsc.org/images/entities/char_2009.gif) : :![[thin space (1/6-em)]](https://www.rsc.org/images/entities/char_2009.gif) 0 0 |
1 |
0.004 |
−68.126 |
84.428 |
39.436 |
0.9967 |
13.018 |
| 2 |
−152.792 |
106.658 |
16.9603 |
21![[thin space (1/6-em)]](https://www.rsc.org/images/entities/char_2009.gif) : :![[thin space (1/6-em)]](https://www.rsc.org/images/entities/char_2009.gif) 40 40![[thin space (1/6-em)]](https://www.rsc.org/images/entities/char_2009.gif) : :![[thin space (1/6-em)]](https://www.rsc.org/images/entities/char_2009.gif) 39 39 |
1 |
−0.200 |
−106.997 |
83.199 |
39.943 |
0.9976 |
14.779 |
| 2 |
−144.890 |
98.404 |
12.736 |
14![[thin space (1/6-em)]](https://www.rsc.org/images/entities/char_2009.gif) : :![[thin space (1/6-em)]](https://www.rsc.org/images/entities/char_2009.gif) 40 40![[thin space (1/6-em)]](https://www.rsc.org/images/entities/char_2009.gif) : :![[thin space (1/6-em)]](https://www.rsc.org/images/entities/char_2009.gif) 46 46 |
1 |
0.021 |
−76.145 |
83.285 |
37.229 |
0.9983 |
13.197 |
| 2 |
−144.658 |
102.357 |
14.770 |
8![[thin space (1/6-em)]](https://www.rsc.org/images/entities/char_2009.gif) : :![[thin space (1/6-em)]](https://www.rsc.org/images/entities/char_2009.gif) 40 40![[thin space (1/6-em)]](https://www.rsc.org/images/entities/char_2009.gif) : :![[thin space (1/6-em)]](https://www.rsc.org/images/entities/char_2009.gif) 52 52 |
1 |
−0.081 |
−68.306 |
87.135 |
42.810 |
0.9948 |
12.476 |
| 2 |
−143.390 |
108.245 |
17.740 |
Fig. 3 shows that exothermic peaks occur when the temperature exceeds 200 °C. The exothermic process finished when the temperature was more than 600 °C. The DSC curve of coal exhibited typical bimodal exothermic behavior. However, the first exothermic peak of the DSC curves for coal B was not clear. This phenomenon is caused by differences in the types and quantities of active structures contained in coal. Some active structures, such as alkyl chains, methyl groups, carboxyl groups, and hydroxyl groups, are easily oxidized at lower temperatures.28,29 However, the combustion or decomposition temperature of some stable structures, such as aromatic structures, is higher.30 When the concentration of CO2 was zero, the maximum heat intensity and total heat increased significantly with an increase in the O2 concentration. When the O2 concentration was increased from 8 to 21 vol%, the total heat released by coal rose from 17.296 to 19.247 kJ g−1, as listed in Table 4. When the O2 was sufficient, the coal–oxygen reaction was more intense. With the increased O2 concentration, the coal and O2 were able to have more contact; therefore, the oxidation/combustion reactions of the coal produced a high proportion of stable oxidation products, increasing heat intensity. When the O2 concentration was kept constant, the DSC and DDSC curves moved to the high temperature region, whereas total heat release decreased substantially with increasing CO2 concentration. As Lee31 noted, competitive adsorption occurs in coal when various gases exist. The adsorption of CO2 causes a reduction in the amount of O2 contacting coal. In addition, more unstable products are formed, leading to an apparent reduction in heat intensity.
3.3.2. Stage characteristics of heat release. The DSC curves for the two samples at a heating rate of 5 °C min−1 and in O2![[thin space (1/6-em)]](https://www.rsc.org/images/entities/char_2009.gif) :
:![[thin space (1/6-em)]](https://www.rsc.org/images/entities/char_2009.gif) N2
N2![[thin space (1/6-em)]](https://www.rsc.org/images/entities/char_2009.gif) :
:![[thin space (1/6-em)]](https://www.rsc.org/images/entities/char_2009.gif) CO2 = 21
CO2 = 21![[thin space (1/6-em)]](https://www.rsc.org/images/entities/char_2009.gif) :
:![[thin space (1/6-em)]](https://www.rsc.org/images/entities/char_2009.gif) 79
79![[thin space (1/6-em)]](https://www.rsc.org/images/entities/char_2009.gif) :
:![[thin space (1/6-em)]](https://www.rsc.org/images/entities/char_2009.gif) 0 and O2
0 and O2![[thin space (1/6-em)]](https://www.rsc.org/images/entities/char_2009.gif) :
:![[thin space (1/6-em)]](https://www.rsc.org/images/entities/char_2009.gif) N2
N2![[thin space (1/6-em)]](https://www.rsc.org/images/entities/char_2009.gif) :
:![[thin space (1/6-em)]](https://www.rsc.org/images/entities/char_2009.gif) CO2 = 21
CO2 = 21![[thin space (1/6-em)]](https://www.rsc.org/images/entities/char_2009.gif) :
:![[thin space (1/6-em)]](https://www.rsc.org/images/entities/char_2009.gif) 40
40![[thin space (1/6-em)]](https://www.rsc.org/images/entities/char_2009.gif) :
:![[thin space (1/6-em)]](https://www.rsc.org/images/entities/char_2009.gif) 39 atmospheres are illustrated in Fig. 4. The sub-peaks of the DSC curves were fitted using eqn (5) (Gaussian equation). The fitting parameters of the sub-peaks are given in Table 4. Fig. 5 illustrates the ratio of the peak 1 to peak 2 areas.
39 atmospheres are illustrated in Fig. 4. The sub-peaks of the DSC curves were fitted using eqn (5) (Gaussian equation). The fitting parameters of the sub-peaks are given in Table 4. Fig. 5 illustrates the ratio of the peak 1 to peak 2 areas.| |
 | (5) |
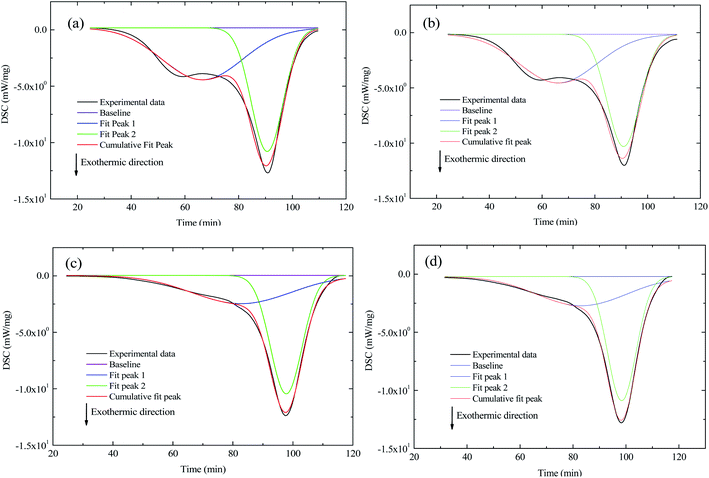 |
| | Fig. 4 DSC curves from the pyrolysis domain stage (stage 1) through the combustion domain stage (stage 3) for the two coal samples, (a) coal A in atmosphere O2![[thin space (1/6-em)]](https://www.rsc.org/images/entities/char_2009.gif) : :![[thin space (1/6-em)]](https://www.rsc.org/images/entities/char_2009.gif) N2 = 21 N2 = 21![[thin space (1/6-em)]](https://www.rsc.org/images/entities/char_2009.gif) : :![[thin space (1/6-em)]](https://www.rsc.org/images/entities/char_2009.gif) 79, (b) coal A in atmosphere O2 79, (b) coal A in atmosphere O2![[thin space (1/6-em)]](https://www.rsc.org/images/entities/char_2009.gif) : :![[thin space (1/6-em)]](https://www.rsc.org/images/entities/char_2009.gif) N2 N2![[thin space (1/6-em)]](https://www.rsc.org/images/entities/char_2009.gif) : :![[thin space (1/6-em)]](https://www.rsc.org/images/entities/char_2009.gif) CO2 = 21 CO2 = 21![[thin space (1/6-em)]](https://www.rsc.org/images/entities/char_2009.gif) : :![[thin space (1/6-em)]](https://www.rsc.org/images/entities/char_2009.gif) 40 40![[thin space (1/6-em)]](https://www.rsc.org/images/entities/char_2009.gif) : :![[thin space (1/6-em)]](https://www.rsc.org/images/entities/char_2009.gif) 39, (c) coal B in atmosphere O2 39, (c) coal B in atmosphere O2![[thin space (1/6-em)]](https://www.rsc.org/images/entities/char_2009.gif) : :![[thin space (1/6-em)]](https://www.rsc.org/images/entities/char_2009.gif) N2 = 21 N2 = 21![[thin space (1/6-em)]](https://www.rsc.org/images/entities/char_2009.gif) : :![[thin space (1/6-em)]](https://www.rsc.org/images/entities/char_2009.gif) 79, and (d) coal B in atmosphere O2 79, and (d) coal B in atmosphere O2![[thin space (1/6-em)]](https://www.rsc.org/images/entities/char_2009.gif) : :![[thin space (1/6-em)]](https://www.rsc.org/images/entities/char_2009.gif) N2 N2![[thin space (1/6-em)]](https://www.rsc.org/images/entities/char_2009.gif) : :![[thin space (1/6-em)]](https://www.rsc.org/images/entities/char_2009.gif) CO2 = 21 CO2 = 21![[thin space (1/6-em)]](https://www.rsc.org/images/entities/char_2009.gif) : :![[thin space (1/6-em)]](https://www.rsc.org/images/entities/char_2009.gif) 40 40![[thin space (1/6-em)]](https://www.rsc.org/images/entities/char_2009.gif) : :![[thin space (1/6-em)]](https://www.rsc.org/images/entities/char_2009.gif) 39. 39. | |
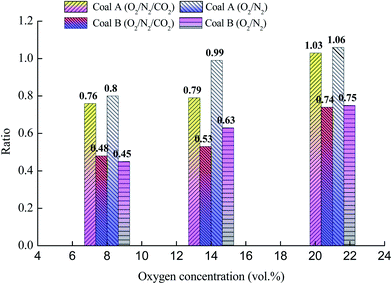 |
| | Fig. 5 Ratio of the peak 1/peak 2 areas. | |
The temperature corresponding to the maximum of peak 1 in coal A was in the range of 320–360 °C, whereas it was in the range of 410–440 °C for coal B, as listed in Table 4. Furthermore, the temperature corresponding to the maximum of peak 1 was close to the ignition temperature of coal. Some of the active structures in coal, such as alkyl chains, methyl groups, carboxyl groups, and hydroxyl groups, are oxidized at low temperatures, resulting in a clear oxidative-exothermic peak before coal combustion.30 Peak 2 was caused by the breaking of numerous stable structures (such as aromatic rings) into small molecules that participated in the combustion reaction.32 As illustrated in Fig. 5, the ratio for coal A was clearly larger than that for coal B, which indicates that attribution of peak 1 to the total heat release was greater than coal B. The primary reason for this phenomenon is that the metamorphic grade of coal A was lower than that of coal B, and the molecules of coal A contained numerous alkyl chains, methyl groups, carboxyl groups, hydroxyl groups, and other active structures.33 The ratio decreased with a decrease of the O2 concentration or increase of the CO2 concentration, which indicates that a low O2 concentration or high CO2 concentration inhibits oxidation of some reactive groups in coal.
3.4. Comprehensive combustion performance index
The dependence of K on the O2 concentration for the two samples is illustrated in Fig. 6. The comprehensive combustion performance index of the two samples decreased with a decrease in the O2 concentration; furthermore, the higher the O2 concentration was, the more O2 participated in coal combustion, leading to the combustibility being strengthened. For the same O2 concentration, the addition of CO2 resulted in a significant decrease in the comprehensive combustion performance index. The physical adsorption of CO2 onto the coal surface occupied active sites, which hindering the physical adsorption and chemical adsorption of O2 by coal, and further inhibiting coal oxidation and combustion.
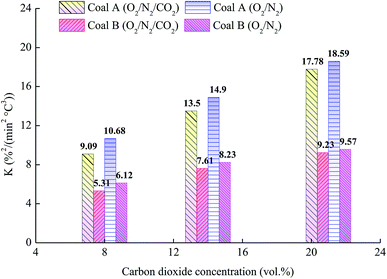 |
| | Fig. 6 Relationship between the comprehensive combustion performance index and O2 concentration. | |
3.5. Apparent activation energy
The calculation of the apparent activation energy uses the Starink method, which is a multiple heating rates calculation method. Therefore, a set of data points of multiple heating rates (5, 10 and 15 °C) calculated at intervals of 0.5 from 0.5 to 0.95 was obtained according to eqn (3), and ln(β/(T + 273.15)1.92) and 1/(T + 273.15) were calculated at different conversion rates as shown in Fig. 7. The apparent activation energies during stages 2 and 3 for the two coal samples are given in Fig. 8 and 9.
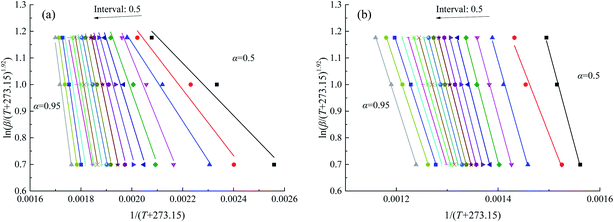 |
| | Fig. 7 Linear relationship between ln(β/(T + 273.15)1.92) and 1/(T + 273.15) of coal A in atmosphere O2![[thin space (1/6-em)]](https://www.rsc.org/images/entities/char_2009.gif) : :![[thin space (1/6-em)]](https://www.rsc.org/images/entities/char_2009.gif) N2 N2![[thin space (1/6-em)]](https://www.rsc.org/images/entities/char_2009.gif) : :![[thin space (1/6-em)]](https://www.rsc.org/images/entities/char_2009.gif) CO2 = 21 CO2 = 21![[thin space (1/6-em)]](https://www.rsc.org/images/entities/char_2009.gif) : :![[thin space (1/6-em)]](https://www.rsc.org/images/entities/char_2009.gif) 40 40![[thin space (1/6-em)]](https://www.rsc.org/images/entities/char_2009.gif) : :![[thin space (1/6-em)]](https://www.rsc.org/images/entities/char_2009.gif) 39, (a) in oxygen-adsorption stage and (b) combustion domain stage. 39, (a) in oxygen-adsorption stage and (b) combustion domain stage. | |
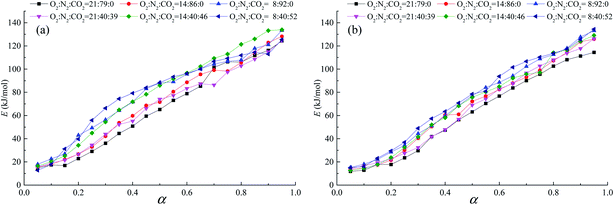 |
| | Fig. 8 Relationship between apparent activation energy and conversion during the oxygen-adsorption stage (stage 2), (a) coal A and (b) coal B. | |
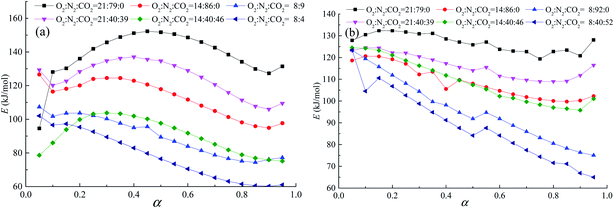 |
| | Fig. 9 Relationship between apparent activation energy and conversion during the combustion domain stage (stage 3), (a) coal A and (b) coal B. | |
3.5.1. Oxygen-adsorption stage. The physical and chemical adsorption of O2 and CO2 is easier and the energy required for the chemical reaction between O2 and coal is lower at the beginning of the oxygen-adsorption stage. The reaction between coal and oxygen is a step-by-step reactive process in which functional groups are gradually activated and oxidized. At low temperatures, only some active structures are activated and react with O2. Moreover, these oxidation reactions require less reaction energy, resulting in lower apparent activation energy of coal. As the temperature increases, more stable structures are gradually activated and react with O2. These oxidation reactions require more energy, leading to an increase in apparent activation energy. Therefore, we observed that with an increase of the conversion rate, apparent activation energy increased. Furthermore, the tendency and value of apparent activation energy changed relative to the conversion rate at all percentages of O2 in O2/N2 or O2/CO2/N2, while tendency of apparent activation energy was almost the same, as illustrated in Fig. 8. When the CO2 concentration was 0, the apparent activation energy decreased with an increase in the O2 concentration. In light of the criteria of competitive reactions, the primary reason for this behavior is that the active structures consume a considerable amount of O2. The decrease of the O2 concentration inhibits the reaction of the stable structures in coal with O2, which requires more energy. In addition, coal B was anthracite, which provides more surface area for strongly competitive chemisorption,34 resulting in complex changes of the apparent activation energies. When the O2 concentration was the same, the apparent activation energy of coal oxidation in O2/N2 was greater than that in O2/CO2/N2. Liu et al.24 considered chemisorption in O2/CO2 conditions to be mainly controlled by O2 chemisorption at the oxygen-adsorption stage. Moreover, CO2 competes with O2 when they are adsorbed by active sites on the coal surface, which hinders the chemical reaction of coal and O2. In summary, O2 competed with CO2 for active sites; thus, more energy was required.
3.5.2. Combustion stage. The apparent activation energy of coal A first increased and then decreased with an increase in the conversion rate. Coal B exhibited a similar tendency when the O2 concentration was more than 8 vol%. When the O2 concentration was 8 vol%, the apparent activation energy of coal B decreased with an increase in the conversion rate, as illustrated in Fig. 9. Temperatures when the apparent activation energy reached the maximum were close to the devolatilization temperature of coal. When the temperature exceeded the devolatilization temperature, a large volume of volatiles evaporated out, leading to an increase in the diffusion resistance of O2 to the coal pores.35 Then, the apparent activation energy of coal combustion tended to decrease due to the large number of active structures resulting from pyrolysis. Values of the apparent activation energy in N2/O2 atmospheres were larger than those in O2/N2/CO2 atmospheres. The cause of this phenomenon is that competition chemisorption of O2 and CO2 on the coal surface during combustion in the O2/N2/CO2 atmosphere, which causes the chemical adsorption process of oxygen in the O2/N2/CO2 atmosphere significantly longer than in the O2/N2 atmosphere.24 Consequently, the probability of oxygen contacting with the active structure is reduced. Therefore, the combustion rate of coal in the O2/N2/CO2 atmosphere is lower than that in the O2/N2 atmosphere (Fig. 2).
4. Conclusions
• With an increase in the CO2 concentration or decrease in the O2 concentration, the thermal analysis curves of coal were delayed and the characteristic temperatures increased.
• The DSC curve can be divided into two exothermic peaks, and the ratio of the peak 1 to peak 2 areas decreased with the addition of CO2, which indicated that CO2 inhibited the oxidation of active functional groups of coal structures. Furthermore, the total heat release decreased. Higher concentrations of CO2 or lower concentrations of O2 resulted in a lower comprehensive combustion performance index.
• At the oxygen-adsorption stage, the apparent activation energy increased with an increase in the conversion rate, whereas it first increased and then decreased at the combustion stage. The apparent activation energy in the O2/CO2/N2 atmosphere was less than that in the O2/N2 atmosphere.
Nomenclature
| Eα | Apparent activation energy (J mol−1) |
| I | Constant |
| K | Comprehensive combustion performance index (%2 min−2 °C−3)) |
| Q | Total heat release (kJ mg−1) |
| R | Gas constant (J mol−1 K−1)) |
| S | Peak area (mW min mg−1) |
| T | Temperature (°C) |
| T1 | Initial temperature when the coal's mass continuously increases (°C) |
| T2 | Temperature is exothermic completed on DSC curve (°C) |
| Tb | Burnout temperature (°C) |
| tc | Center of the peak time (min) |
| Tig | Ignition temperature (°C) |
| v0 | Baseline of peak (mW mg−1) |
| w | Full width at half maximum (min) |
| vm | Change rate of exothermic (min) |
| (dw/dt)av | Average rate of mass loss (% min−1) |
| (dw/dt)max | Maximum rate of mass loss (% min−1) |
| α | Conversion rate (%) |
| β | Heating rate (°C min−1) |
Conflicts of interest
There are no conflicts to declare.
Acknowledgements
This work was supported by the National Key R&D Program of China (Grant No. 2018YFC0807900), National Natural Science Foundation of China (No. 51904232 and 51804247) and Shaanxi Key R&D Program in China (2017ZDCXL-GY-01-02-03).
References
- V. Saini, R. P. Gupta and M. K. Arora, Environmental impact studies in coalfields in India: a case study from Jharia coal-field, Renewable Sustainable Energy Rev., 2016, 53, 1222–1239 CrossRef.
- Y. Xiao, S. J. Ren, J. Deng and C. M. Shu, Comparative analysis of thermokinetic behavior and gaseous products between first and second coal spontaneous combustion, Fuel, 2018, 227, 325–333 CrossRef CAS.
- J. Deng, J. Qu, Q. H. Wang, Y. Xiao, Y. C. Cheng and C. M. Shu, Experimental data revealing explosion characteristics of methane, air, and coal mixtures, RSC Adv., 2019, 9, 24627–24637 RSC.
- J. Deng, C. Lei, Y. Xiao, K. Cao, L. Ma, W. Wang and B. Laiwang, Determination and prediction on “three zones” of coal spontaneous combustion in a gob of fully mechanized caving face, Fuel, 2018, 211, 458–470 CrossRef CAS.
- U. Green, Z. Aizenshtat, L. Metzger and H. Cohen, Field and laboratory simulation study of hot spots in stockpiled bituminous coal, Energy Fuels, 2012, 26, 7230–7235 CrossRef CAS.
- L. Zhang, B. Shi, B. Qin, Q. Wu and V. Dao, Characteristics of foamed gel for coal spontaneous combustion prevention and control, Combust. Sci. Technol., 2017, 189, 980–990 CrossRef CAS.
- J. Deng, Y. Xiao, J. Lu, H. Wen and Y. Jin, Application of composite fly ash gel to extinguish outcrop coal fires in China, Nat. Hazards, 2015, 79, 881–898 CrossRef.
- F. B. Zhou, B. B. Shi, J. W. Cheng and L. J. Ma, A New approach to control a serious mine fire with using liquid nitrogen as extinguishing media, Fire Technol., 2015, 51, 325–334 CrossRef.
- Y. B. Shu, W. J. Li and Z. X. Li, The technology of liquid CO2 used for fire prevention and the related device, Adv. Mater. Res., 2012, 347–353, 1642–1646 CAS.
- J. Deng, Y. Xiao, Q. Li, J. Lu and H. Wen, Experimental studies of spontaneous combustion and anaerobic cooling of coal, Fuel, 2015, 157, 261–269 CrossRef CAS.
- Y. Hu, Z. Wang, X. Cheng and C. Ma, Non-isothermal TGA study on the combustion reaction kinetics and mechanism of low-rank coal char, RSC Adv., 2018, 8, 22909–22916 RSC.
- J. Deng, L. F. Ren, L. Ma, C. K. Lei, G. M. Wei and W. F. Wang, Effect of oxygen concentration on low-temperature exothermic oxidation of pulverized coal, Thermochim. Acta, 2018, 653, 102–111 CrossRef.
- A. Rotaru, Thermal analysis and kinetic study of Petroşani bituminous coal from Romania in comparison with a sample of Ural bituminous coal, J. Therm. Anal. Calorim., 2012, 110, 1283–1291 CrossRef CAS.
- J. Deng, Q. Li, Y. Xiao and H. Wen, The effect of oxygen concentration on the non-isothermal combustion of coal, Thermochim. Acta, 2017, 653, 106–115 CrossRef CAS.
- N. Ding, C. Zhang, C. Luo, Y. Zheng and Z. Liu, Effect of hematite addition to CaSO4 oxygen carrier in chemical looping combustion of coal char, RSC Adv., 2015, 5, 56362–56376 RSC.
- L. Hao, Combustion of coal chars in O2/CO2 and O2/N2 mixtures: a comparative study with non-isothermal thermogravimetric analyzer (TGA) tests, Energy Fuels, 2009, 23, 4278–4285 CrossRef.
- G. Várhegyi and F. Till, Comparison of temperature-programmed char combustion in CO2–O2 and Ar–O2 mixtures at elevated pressure, Energy Fuels, 1999, 13, 539–540 CrossRef.
- R. K. Rathnam, L. K. Elliott, T. F. Wall, Y. Liu and B. moghtaderi, differences in reactivity of pulverised coal in air (O2/N2) and oxy-fuel (O2/CO2) conditions, Fuel Process. Technol., 2009, 90, 797–802 CrossRef CAS.
- Z. Zhou, X. Hu, Z. You, Z. Wang, J. Zhou and K. Cen, Oxy-fuel combustion characteristics and kinetic parameters of lignite coal from thermo-gravimetric data, Thermochim. Acta, 2013, 553, 54–59 CrossRef CAS.
- J. Deng, K. Wang, Y. Zhang and H. Yang, Study on the kinetics and reactivity at the ignition temperature of Jurassic coal in North Shaanxi, J. Therm. Anal. Calorim., 2014, 118, 417–423 CrossRef CAS.
- S. Vyazovkin, A. K. Burnham, J. M. Criado, L. A. Pérez-Maqueda, C. Popescu and N. Sbirrazzuoli, ICTAC Kinetics Committee recommendations for performing kinetic computations on thermal analysis data, Thermochim. Acta, 2011, 520, 1–19 CrossRef CAS.
- C. Wang, M. Lei, W. Yan, S. Wang and L. Jia, Combustion characteristics and ash formation of pulverized coal under pressurized oxy-fuel conditions, Energy Fuels, 2011, 25, 4333–4344 CrossRef CAS.
- M. Wang, R. Zhao, Q. Shan, Y. Liu and A. Zhang, Study on combustion characteristics of young lignite in mixed O2/CO2, atmosphere, Appl. Therm. Eng., 2017, 110, 1240–1246 CrossRef CAS.
- Y. Liu, P. F. Fu, B. Zhang and C. Zheng, Study on the surface active reactivity of coal char conversion in O2/CO2 and O2/N2 atmospheres, Fuel, 2016, 181, 1244–1256 CrossRef CAS.
- R. Khatami, C. Stivers and Y. A. Levendis, Ignition characteristics of single coal particles from three different ranks in O2/N2, and O2/CO2, atmospheres, Combust. Flame, 2012, 159, 3554–3568 CrossRef CAS.
- I. Aarna and E. M. Suuberg, Changes in reactive surface area and porosity during char oxidation, Symp. Combust., 1998, 27, 2933–2939 CrossRef.
- W. Zhou, H. Wang, Z. Zhang, H. Chen and X. Liu, Molecular simulation of CO2/CH4/H2O competitive adsorption and diffusion in brown coal, RSC Adv., 2019, 9, 3004–3011 RSC.
- J. Li, Z. Li, Y. Yang and X. Zhang, Study on the generation of active sites during low-temperature pyrolysis of coal and its influence on coal spontaneous combustion, Fuel, 2019, 241, 283–296 CrossRef CAS.
- L. F. Ren, J. Deng, Q. W. Li, L. Ma, L. Zou, B. Laiwang and C. M. Shu, Low-temperature exothermic oxidation characteristics and spontaneous combustion risk of pulverised coal, Fuel, 2019, 252, 238–245 CrossRef CAS.
- J. Deng, B. Li, Y. Xiao, L. Ma, C. P. Wang, B. L. Wang and C. M. Shu, Combustion properties of coal gangue using thermogravimetry-Fourier transform infrared spectroscopy, Appl. Therm. Eng., 2017, 116, 244–252 CrossRef CAS.
- H. H. Lee, H. J. Kim, S. Yao, D. Keffer and C. H. Lee, Competitive adsorption of CO2/CH4, mixture on dry and wet coal from subcritical to supercritical conditions, Chem. Eng. J., 2013, 230, 93–101 CrossRef CAS.
- X. Lin, M. Luo, S. Li, Y. Yang, X. Chen, B. Tian and Y. Wang, The evolutionary route of coal matrix during integrated cascade pyrolysis of a typical low-rank coal, Appl. Energy, 2017, 199, 335–346 CrossRef CAS.
- M. Tomaszewicz and A. Mianowski, Char structure dependence on formation enthalpy of parent coal, Fuel, 2017, 199, 380–393 CrossRef CAS.
- B. Nie, X. Liu, L. Yang, J. Meng and X. Li, Pore structure characterization of different rank coals using gas adsorption and scanning electron microscopy, Fuel, 2015, 158, 908–917 CrossRef CAS.
- K. V. Slyusarskiy, K. B. Larionov, V. I. Osipov, S. A. Yankovskya, V. E. Gubina and A. A. Gromova, Non-isothermal kinetic study of bituminous coal and lignite conversion in air and in argon/air mixtures, Fuel, 2017, 191, 383–392 CrossRef CAS.
- S. J. Ren, C. P. Wang, Y. Xiao, J. Deng, Y. Tian, J. J. Song, X. J. Cheng and G. F. Sun, Thermal properties of coal during low temperature oxidation using a grey correlation method, Fuel, 2020, 260, 116287 CrossRef CAS.
- J. Deng, Z. J. Bai, Y. Xiao, C. M. Shu and B. Laiwang, Effects of imidazole ionic liquid on macroparameters and microstructure of bituminous coal during low-temperature oxidation, Fuel, 2019, 246, 160–168 CrossRef CAS.
|
| This journal is © The Royal Society of Chemistry 2019 |
Click here to see how this site uses Cookies. View our privacy policy here.  Open Access Article
 *acd,
Jun Dengacd,
Xiao Yang
 acd,
Li Maacd and
Wei-Feng Wangacd


![[thin space (1/6-em)]](https://www.rsc.org/images/entities/char_2009.gif) :
:![[thin space (1/6-em)]](https://www.rsc.org/images/entities/char_2009.gif) N2
N2![[thin space (1/6-em)]](https://www.rsc.org/images/entities/char_2009.gif) :
:![[thin space (1/6-em)]](https://www.rsc.org/images/entities/char_2009.gif) CO2)
CO2)![[thin space (1/6-em)]](https://www.rsc.org/images/entities/char_2009.gif) :
:![[thin space (1/6-em)]](https://www.rsc.org/images/entities/char_2009.gif) 79
79![[thin space (1/6-em)]](https://www.rsc.org/images/entities/char_2009.gif) :
:![[thin space (1/6-em)]](https://www.rsc.org/images/entities/char_2009.gif) 0
0![[thin space (1/6-em)]](https://www.rsc.org/images/entities/char_2009.gif) :
:![[thin space (1/6-em)]](https://www.rsc.org/images/entities/char_2009.gif) 86
86![[thin space (1/6-em)]](https://www.rsc.org/images/entities/char_2009.gif) :
:![[thin space (1/6-em)]](https://www.rsc.org/images/entities/char_2009.gif) 0
0![[thin space (1/6-em)]](https://www.rsc.org/images/entities/char_2009.gif) :
:![[thin space (1/6-em)]](https://www.rsc.org/images/entities/char_2009.gif) 92
92![[thin space (1/6-em)]](https://www.rsc.org/images/entities/char_2009.gif) :
:![[thin space (1/6-em)]](https://www.rsc.org/images/entities/char_2009.gif) 0
0![[thin space (1/6-em)]](https://www.rsc.org/images/entities/char_2009.gif) :
:![[thin space (1/6-em)]](https://www.rsc.org/images/entities/char_2009.gif) 40
40![[thin space (1/6-em)]](https://www.rsc.org/images/entities/char_2009.gif) :
:![[thin space (1/6-em)]](https://www.rsc.org/images/entities/char_2009.gif) 39
39![[thin space (1/6-em)]](https://www.rsc.org/images/entities/char_2009.gif) :
:![[thin space (1/6-em)]](https://www.rsc.org/images/entities/char_2009.gif) 40
40![[thin space (1/6-em)]](https://www.rsc.org/images/entities/char_2009.gif) :
:![[thin space (1/6-em)]](https://www.rsc.org/images/entities/char_2009.gif) 46
46![[thin space (1/6-em)]](https://www.rsc.org/images/entities/char_2009.gif) :
:![[thin space (1/6-em)]](https://www.rsc.org/images/entities/char_2009.gif) 40
40![[thin space (1/6-em)]](https://www.rsc.org/images/entities/char_2009.gif) :
:![[thin space (1/6-em)]](https://www.rsc.org/images/entities/char_2009.gif) 52
52
![[thin space (1/6-em)]](https://www.rsc.org/images/entities/char_2009.gif) :
:![[thin space (1/6-em)]](https://www.rsc.org/images/entities/char_2009.gif) N2
N2![[thin space (1/6-em)]](https://www.rsc.org/images/entities/char_2009.gif) :
:![[thin space (1/6-em)]](https://www.rsc.org/images/entities/char_2009.gif) CO2)
CO2)![[thin space (1/6-em)]](https://www.rsc.org/images/entities/char_2009.gif) :
:![[thin space (1/6-em)]](https://www.rsc.org/images/entities/char_2009.gif) 79
79![[thin space (1/6-em)]](https://www.rsc.org/images/entities/char_2009.gif) :
:![[thin space (1/6-em)]](https://www.rsc.org/images/entities/char_2009.gif) 0
0![[thin space (1/6-em)]](https://www.rsc.org/images/entities/char_2009.gif) :
:![[thin space (1/6-em)]](https://www.rsc.org/images/entities/char_2009.gif) 86
86![[thin space (1/6-em)]](https://www.rsc.org/images/entities/char_2009.gif) :
:![[thin space (1/6-em)]](https://www.rsc.org/images/entities/char_2009.gif) 0
0![[thin space (1/6-em)]](https://www.rsc.org/images/entities/char_2009.gif) :
:![[thin space (1/6-em)]](https://www.rsc.org/images/entities/char_2009.gif) 92
92![[thin space (1/6-em)]](https://www.rsc.org/images/entities/char_2009.gif) :
:![[thin space (1/6-em)]](https://www.rsc.org/images/entities/char_2009.gif) 0
0![[thin space (1/6-em)]](https://www.rsc.org/images/entities/char_2009.gif) :
:![[thin space (1/6-em)]](https://www.rsc.org/images/entities/char_2009.gif) 40
40![[thin space (1/6-em)]](https://www.rsc.org/images/entities/char_2009.gif) :
:![[thin space (1/6-em)]](https://www.rsc.org/images/entities/char_2009.gif) 39
39![[thin space (1/6-em)]](https://www.rsc.org/images/entities/char_2009.gif) :
:![[thin space (1/6-em)]](https://www.rsc.org/images/entities/char_2009.gif) 40
40![[thin space (1/6-em)]](https://www.rsc.org/images/entities/char_2009.gif) :
:![[thin space (1/6-em)]](https://www.rsc.org/images/entities/char_2009.gif) 46
46![[thin space (1/6-em)]](https://www.rsc.org/images/entities/char_2009.gif) :
:![[thin space (1/6-em)]](https://www.rsc.org/images/entities/char_2009.gif) 40
40![[thin space (1/6-em)]](https://www.rsc.org/images/entities/char_2009.gif) :
:![[thin space (1/6-em)]](https://www.rsc.org/images/entities/char_2009.gif) 52
52![[thin space (1/6-em)]](https://www.rsc.org/images/entities/char_2009.gif) :
:![[thin space (1/6-em)]](https://www.rsc.org/images/entities/char_2009.gif) N2
N2![[thin space (1/6-em)]](https://www.rsc.org/images/entities/char_2009.gif) :
:![[thin space (1/6-em)]](https://www.rsc.org/images/entities/char_2009.gif) CO2 = 21
CO2 = 21![[thin space (1/6-em)]](https://www.rsc.org/images/entities/char_2009.gif) :
:![[thin space (1/6-em)]](https://www.rsc.org/images/entities/char_2009.gif) 79
79![[thin space (1/6-em)]](https://www.rsc.org/images/entities/char_2009.gif) :
:![[thin space (1/6-em)]](https://www.rsc.org/images/entities/char_2009.gif) 0 and O2
0 and O2![[thin space (1/6-em)]](https://www.rsc.org/images/entities/char_2009.gif) :
:![[thin space (1/6-em)]](https://www.rsc.org/images/entities/char_2009.gif) N2
N2![[thin space (1/6-em)]](https://www.rsc.org/images/entities/char_2009.gif) :
:![[thin space (1/6-em)]](https://www.rsc.org/images/entities/char_2009.gif) CO2 = 21
CO2 = 21![[thin space (1/6-em)]](https://www.rsc.org/images/entities/char_2009.gif) :
:![[thin space (1/6-em)]](https://www.rsc.org/images/entities/char_2009.gif) 40
40![[thin space (1/6-em)]](https://www.rsc.org/images/entities/char_2009.gif) :
:![[thin space (1/6-em)]](https://www.rsc.org/images/entities/char_2009.gif) 39 atmospheres are illustrated in Fig. 4. The sub-peaks of the DSC curves were fitted using eqn (5) (Gaussian equation). The fitting parameters of the sub-peaks are given in Table 4. Fig. 5 illustrates the ratio of the peak 1 to peak 2 areas.
39 atmospheres are illustrated in Fig. 4. The sub-peaks of the DSC curves were fitted using eqn (5) (Gaussian equation). The fitting parameters of the sub-peaks are given in Table 4. Fig. 5 illustrates the ratio of the peak 1 to peak 2 areas.

![[thin space (1/6-em)]](https://www.rsc.org/images/entities/char_2009.gif) :
:![[thin space (1/6-em)]](https://www.rsc.org/images/entities/char_2009.gif) N2
N2![[thin space (1/6-em)]](https://www.rsc.org/images/entities/char_2009.gif) :
:![[thin space (1/6-em)]](https://www.rsc.org/images/entities/char_2009.gif) CO2 = 21
CO2 = 21![[thin space (1/6-em)]](https://www.rsc.org/images/entities/char_2009.gif) :
:![[thin space (1/6-em)]](https://www.rsc.org/images/entities/char_2009.gif) 40
40![[thin space (1/6-em)]](https://www.rsc.org/images/entities/char_2009.gif) :
:![[thin space (1/6-em)]](https://www.rsc.org/images/entities/char_2009.gif) 39, (a) in oxygen-adsorption stage and (b) combustion domain stage.
39, (a) in oxygen-adsorption stage and (b) combustion domain stage.


