 Open Access Article
PFOM fillers embedded PVDF/cellulose dual-layered membranes with hydrophobic–hydrophilic channels for desalination via direct contact membrane distillation process†
Thanigaivelan Arumughama,
Noel Jacob Kaleekkalb,
Dipak Rana c and
Kulathu Iyer Sathiyanarayanan
 *a
*a
aDepartment of Chemistry, School of Advanced Sciences, Vellore Institute of Technology (VIT), Vellore, Tamil Nadu, India. E-mail: sathiya_kuna@hotmail.com
bMembrane Separation Group, Department of Chemical Engineering, National Institute of Technology Calicut (NITC), Kerala, India
cDepartment of Chemical and Biological Engineering, Industrial Membrane Research Institute, University of Ottawa, 161 Louis Pasteur St., Ottawa, Ontario K1N 6N5, Canada
First published on 16th December 2019
Abstract
In this research work, novel perfluorooctanoic acid-modified melamine (PFOM) was synthesized as a hydrophobic filler using a facile one-pot synthesis. PFOM incorporating polyvinylidene fluoride (PVDF) solution was cast on a cellulose sheet to prepare a dual-layered membrane employing the phase-inversion technique for direct contact membrane distillation (DCMD) application. The influence of PFOM to tailor the dual-layered membrane performance was then investigated. The long perfluoro chain in PFOM hydrophobic fillers increased the surface roughness of the membranes due to its random overlapping with PVDF backbone, and these membranes exhibited a higher water contact angle value. The increase in pore size and membrane porosity did not significantly influence the liquid entry pressure of water (LEPw). The microporous membranes displayed good mechanical strength for use in the test setup. Pure water permeation was the highest (6.9 kg m−2 h−1) for membrane (M1) with 1 wt% of PFOM when tested with a simulated sea-water solution (3.5% w/v NaCl) in the direct contact distillation mode. These membranes also achieved the theoretical salt-rejection of 99.9%, thus confirming the potential of these membranes to be investigated for large scale membrane distillation (MD) applications like desalination of seawater.
1. Introduction
Desalination has a significant impact on the global economy. Most countries lack access to potable water, and this paucity of potable water, coupled with the current unpredictable climate changes and the higher consumption patterns, poses a threat of extreme water shortage.1 The National Institution for Transforming India (NITI) Aayog, Government of India, report2 indicates that 40% of Indians will have no access to safe drinking water by 2030. Owing to India's vast 7517 km coastline, sustainable desalination techniques can be adopted to overcome the projected water scarcity.3Membrane distillation (MD) based seawater desalination can be considered a suitable alternative to the well-established pressure-driven reverse osmosis (RO) process due to reasons such as-excellent permeate quality, energy efficiency, ease of operation and its robustness in treating highly concentrated saline water.4 In the MD process, a hydrophobic membrane acts as a physical barrier, which in turn forms a liquid–gas interface for heat and mass exchanges.5 MD is being widely explored in many applications such as desalination,6 wastewater treatment,7 fruit-juice clarification8 and recovery of radioactive pollutants.9
The direct contact mode or the DCMD process is well established, can be successively scaled up and the feed and permeate are directly in contact with hydrophobic membrane.10 Hydrophobic polymers including polytetrafluoroethylene (PTFE), polyvinylidene fluoride (PVDF), polyethylene (PE) and polypropylene (PP) have been investigated as a membrane material in the DCMD process.11,12 Of these, PVDF is favorable, as it has a high solubility for commonly used polar aprotic solvents such as N-methyl-2-pyrrolidone (NMP),13 N,N-dimethylformamide (DMF)14 and N,N-dimethylacetamide (DMAC).15 It has been extensively used for preparing membranes by coating,16 electrospinning,5 phase inversion method,17 thermally induced phase separation (TIPS)18 and a few more. Hydrophobic characteristics are believed to be suitable for the MD process. Therefore, many efforts have been devoted to improve the hydrophobic properties of MD membrane. Especially, composite membranes are receiving greater attention due to their high functionality and selectivity. Hydrophobic fillers such as multi-walled carbon nanotubes (MWCNTs),19 graphene,20 carbon nanotubes (CNTs),21 clay,22 silica,23 TiO2,24 polydimethylsiloxane,25 Hyflon AD60 (ref. 26) and perfluoro silanes27 have been explored as suitable modifiers to improve membrane surface hydrophobicity. However, the long transport path of the water vapour through the pores of the hydrophobic membrane increases the mass transfer resistance and causes severe flux decline.28 This major issue compelled researchers to focus not only on aspects of surface chemistry but also on aspects of membrane engineering, for effective membrane distillation process.29–31 One of the potential solutions involved the use of dual-layer membranes combining both hydrophobic and hydrophilic polymers, which could eventually reduce the vapor transport path and as a result improve the mass transport across the membrane.32,33 These dual-layered membranes possess certain advantages such as: (i) the non-requirement of complex pre/post-treatment of the membrane and (ii) selective modification.34 Ray et al., fabricated the hydrophobic electrospun nanofibrous layer composed of polysulfone (PSF) and sodium dodecyl sulfate (SDS) supported on cellulose filter paper for improved desalination performance. The results indicated a salt rejection >99% and a high permeate flux of ∼9 LMH.35 PTFE/PSF electrospun nanofibrous membranes, evaluated for desalination by DCMD, exhibited impressive permeate fluxes that were as high as 39.5 kg m−2 h−1 with low, permeate conductivity (<7.145 μS cm−1). Further, there was no wetting of the interfiber space.36 However, an increase in surface hydrophilicity causes severe pore wetting, which leads to a decline in permeate quality. This is one of the main factors that limit the industrial implementation of dual-layered MD membranes. It is explicit that factors such as surface hydrophobicity, pore wetting and liquid entry pressure of water (LEPw) are considered significant factors when a hydrophilic polymer is used for preparing a dual-layered membrane. Owing to the highly hydrophobic nature of fluorine compounds, they are widely preferred in the preparation of an efficient membrane for the MD process.37–39 A report on the investigation of a hydrophobic sponge prepared by melamine functionalized with stearic acid for the separation of oil from water,40 was an inspiration for designing a novel class of hydrophobic PFOM fillers by functionalizing the melamine moiety with perfluorooctanoic acid.
Herein, we introduce a new strategy to construct the hydrophobic dual layered membrane with remarkable membrane distillation performances. A novel hydrophobic modifier, PFOM was investigated for its ability to improve the non-wetting properties of the membrane. The phase-inversion technique was employed to fabricate PFOM fillers embedded with PVDF/cellulose membranes which exhibited dual-layer composite structure. The effect of hydrophobic PFOM on membrane morphology, its roughness and non-wetting properties was carefully investigated. The feasibility of the proposed membrane modification approach was examined using simulated seawater (3.5% w/v) in direct contact mode with the MD test setup. The results of salt rejection and permeability were of desirable nature for the prepared membranes, and these correlated well with membrane properties. Thus, the present investigation could be the first for engineering the dual-layer membrane surface with the novel class of hydrophobic PFOM fillers in the field of MD.
2. Materials and experimental methods
2.1 Materials
Commercial poly(vinylidene fluoride) (PVDF) was procured from Alfa Aesar, United States, polyethylene glycol 200, perfluorooctanoic acid (95%) and melamine (99%) were obtained from Sigma-Aldrich, United States. N-Methyl-2-pyrrolidone (NMP, 99.5%) was procured from Spectrochem Pvt. Ltd., India and sodium chloride (NaCl, 99.5%), from Merck Specialties Pvt. Ltd., India. All chemicals were utilized as received, and distilled water was used for all experiments.2.2 Synthesis of perfluorooctanoic acid-modified melamine (PFOM) hydrophobic filler
As shown in Fig. 1, a facile one-pot synthesis was adopted to prepare the hydrophobic modifier, perfluorooctanoic acid-modified melamine (PFOM).The reaction scheme was carried out as follows: initially, perfluorooctanoic acid (15.8 mmol) was added into a round bottom flask (100 mL) containing 30 mL of deionized water with two drops of dil. HCl and was continuously stirred while being heated. When the temperature of the contents reached 60 °C, melamine (3.9 mmol) was introduced into the reaction medium. The entire reaction mixture was further stirred at 70 °C for 12 h. The fine white precipitate obtained was filtered through a Whatman® Grade 40 filter paper, washed with hot water to remove unreacted precursors and dried overnight at 70 °C. The resultant product was designated as PFOM, and the synthesis was confirmed by FT-IR (Shimadzu IRAffinity-1), 1H & 19F-NMR (Bruker FT-NMR 400 MHz) and TEM (FEI-Tecnai G2 20 Twin) with EDX.
2.3 Preparation of PVDF–PFOM dual-layered membranes
Phase inversion technique was implemented to construct the flat-sheet membranes, and their composition is given in Table 1.| Membrane code | PVDF (wt%) | PFOM (wt%) | PEG-200 (wt%) | NMP (wt%) |
|---|---|---|---|---|
| M0 | 11 | 0 | 2 | 87 |
| M0.5 | 11 | 0.5 | 2 | 86.5 |
| M1 | 11 | 1 | 2 | 86 |
| M2 | 11 | 2 | 2 | 85 |
The polymer with the solvent and filler was stirred for 12 h to obtain a homogeneous solution and kept undisturbed at room temperature for 4 h to remove any trapped air bubbles. Meanwhile, pre-wetted cellulose support (18 cm × 30 cm) with the solvent was affixed onto a clean glass plate. After that, the clear polymer solution was then spread over on the cellulose support by using a casting knife with a gap height of ∼150 μm. Subsequently, the glass plate with polymer solution was immersed in the gelation bath (2 L distilled water) to stimulate the phase separation process by allowing mutual exchange of solvent–non solvent (water). After 4 h, the nascent flat sheet membranes were transferred into another bath containing clean distilled water to completely eliminate the remaining residual solvent. The flat-sheet membranes were allowed to dry at room temperature and stored.
3. Characterization of PVDF–PFOM dual-layered membranes
3.1 Morphological investigation of membrane
The membrane morphology was observed through a scanning electron microscope (SEM, Cam Scan MV 2300) fitted with energy dispersive X-ray (EDX) spectroscopy. 1 cm × 1 cm samples of the non-conductive membranes were gold-sputtered under vacuum to enhance the surface conductivity, and the images were captured at suitable magnifications. The surface of the membrane was analyzed using EDX to confirm successful incorporation of the hydrophobic filler. In order to measure the membrane surface roughness (average roughness (Sa) and root mean square of the Z data (Sq)), atomic force microscope (Nanosurf EasyScan 2 AFM, version 1.3) was operated in a non-contact mode to scan 5 μm × 5 μm of the membrane area (n = 5).3.2 BET analysis and porosity of membranes
The pore structure of the membrane was examined by Brunauer–Emmett–Teller (BET) (Quantachrome Autosorb iQc) equipment. Specific surface area, mean pore radius and total pore volume of membrane samples were calculated from the BET equation.41Overall membrane porosity is defined as the pore volume per total volume of the membrane sample. Equal sized membrane samples were immersed in a pore filling solvent isopropyl alcohol for 10 min.42 and the excess solvent were removed by blotting with tissue paper. The membrane was weighed before (w1) and after (w2) wetting, and the membrane porosity was calculated by eqn (1). At least three measurements were performed for each membrane to yield an average result.43
 | (1) |
3.3 Contact angle analysis of membranes
The water contact angle (WCA) of the membranes was measured using a GBX instrument (Germany), to determine surface hydrophobicity. A smooth, flat membrane surface was set on a glass strip to receive a 2 μL of Milli-Q water and the WCA was measured within 20 s using the sessile drop analysis. To obtain an accurate result, the WCA at five different locations was randomly analyzed for each membrane.3.4 Surface free energy, wetting tension and reversible work of adhesion of membranes
The most important surface free energy elements of membrane–liquid–air interfaces were studied, as shown in previous research work.44 Young and Neumann equation was used to derive the interfacial forces or energy such as γlv, γsl and γsv at liquid–air, liquid–solid and solid–air, respectively.45Wetting tension (ΔF) is another important interface property in order to test the wetting capability of a solid surface. Wetting tension (ΔF) of membranes is derived using the following equation,46
 | (2) |
Reversible work of adhesion (Wa) can be defined as the amount of energy released during the process of wetting phenomena, and is calculated based on Young–Dupre equation,47
 | (3) |
3.5 Mechanical properties of membranes
The mechanical properties of membranes, tensile strength, % elongation and Young's modulus were evaluated. The values were obtained through a universal mechanical testing machine (INSTRON 8801). All measurements in triplicate were carried out at 25 °C with a rate of elongation of 5 mm min−1 for membrane samples (50 mm × 15 mm) (n = 5).3.6 Liquid entry pressure of water (LEPw) test of membranes
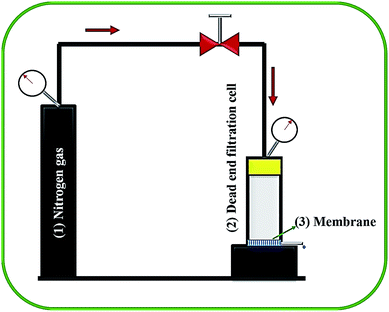
The liquid entry pressure of water (LEPw) represents the membrane wetting resistance. To investigate the LEPw, a laboratory-developed, dead-end cell connected with N2-cylinder (shown in Fig. 2) was used. Membrane sample with surface areas of 38 cm2 was placed in the test setup, and the hydraulic pressure was raised stepwise at a rate of 0.2 bar every 30 min. The LEPw is the lowest pressure which permeates water droplets through the porous membrane. These tests were carried out at least three times for each membrane, with the aim of obtaining reliable results.3.7 Dual-layered membranes performance in direct contact membrane distillation (DCMD) process
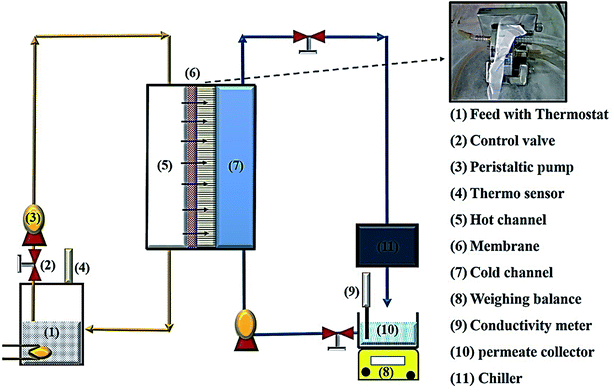
The prepared membranes were investigated using simulated seawater to challenge their ability for desalination. This was done using a laboratory test kit (Fig. 3). The hot feed side and the cold permeate channels of the DCMD test cell were separated by the membrane with an effective area of 44.15 cm2. Simulated seawater (3.5% w/v NaCl) was used as the feed solution and the inlet feed temperature was maintained at 60(±2) °C. A constant flow rate of 0.25 L min−1 was maintained using a peristaltic pump (Ravel, RH-P120S). Distilled water which was cooled to 20(±0.5) °C using a water chiller was circulated on the left side of the DMFC cell at a flow rate of 0.25 L min−1. The connecting pipes were insulated with thermal insulation tape to minimize heat loss. The condensed vapours in the permeate side were collected in the beaker that was placed on a highly sensitive electronic weighing balance to determine the permeate flux (kg m−2 h−1, KMH).The flux were calculated using eqn (4) and conductivity of the permeate helped to obtain the salt concentration (eqn (5)).
 | (4) |
 | (5) |
4. Results and discussion
4.1 Characterization of perfluorooctanoic acid-modified melamine (PFOM)
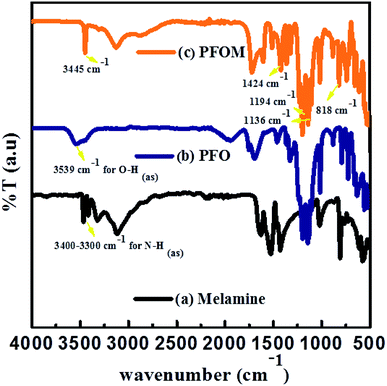
The chemical functionality of the melamine, PFO and PFOM was confirmed by FTIR (Fig. 4).The major characteristic peaks at 3451 cm−1 (N–H(as) in amide), 1698 cm−1 (C![[double bond, length as m-dash]](https://www.rsc.org/images/entities/char_e001.gif) O(s) in amide), 1424 cm−1 (C–N(s) in amide), 1136 (C–F of CF3), 1367–1194 cm−1 (C–F of CF2), 1096 cm−1 (C–N(s) in outside of triazine ring), 1511 cm−1 (quadrant stretching of the 1,3,5 triazine ring, C–N), 818 cm−1 (bending mode of sextant 1,3,5 triazine, C–N) and 624 cm−1 (amide N–H(b)) indicated the formation of the PFOM moiety. Further, after comparing these results with our previous research article,46 we inferred that the absence of both –NH2 of melamine band and O–H of perfluorooctanoic acid at around 3500 cm−1 could be an additional evidence for PFOM formation.
O(s) in amide), 1424 cm−1 (C–N(s) in amide), 1136 (C–F of CF3), 1367–1194 cm−1 (C–F of CF2), 1096 cm−1 (C–N(s) in outside of triazine ring), 1511 cm−1 (quadrant stretching of the 1,3,5 triazine ring, C–N), 818 cm−1 (bending mode of sextant 1,3,5 triazine, C–N) and 624 cm−1 (amide N–H(b)) indicated the formation of the PFOM moiety. Further, after comparing these results with our previous research article,46 we inferred that the absence of both –NH2 of melamine band and O–H of perfluorooctanoic acid at around 3500 cm−1 could be an additional evidence for PFOM formation.
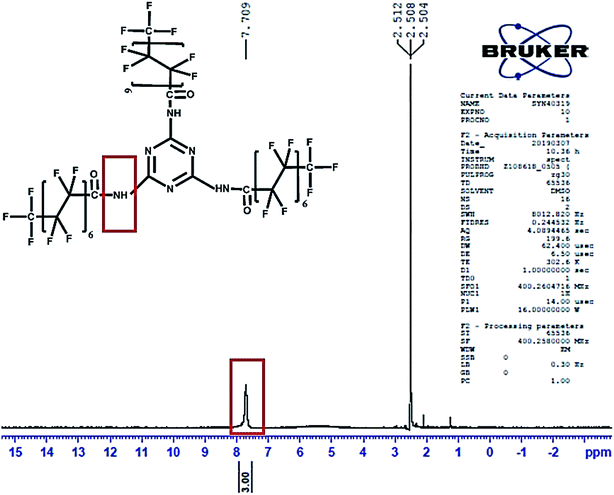
Literature reports indicate that the amine proton peak present in melamine is located at 5.6 ppm as a single intense peak48 in the NMR spectrum. The 1H NMR spectrum of PFOM (DMSO-d6, delta δ ppm) was observed at downfield, δ = 7.7 (s, 3H, 3NH–C![[double bond, length as m-dash]](https://www.rsc.org/images/entities/char_e001.gif) O) due to the introduction of the –C
O) due to the introduction of the –C![[double bond, length as m-dash]](https://www.rsc.org/images/entities/char_e001.gif) O group of the PFO, which decreases the electron cloud density around N–H (Fig. 5). In 19F-NMR (Fig. S1†) of PFOM, (DMSO-d6, delta δ ppm): δ = −80.5 (s, 3F, –CF3, position 8th), −116.8 (s, 2F, –CF2, position 2nd), −121.6 (s, 2F, –CF2, position 3rd), −122.0 (s, 2F, –CF2, position 4th), −122.3 (s, 2F, –CF2, position 5th), −122.7 (s, 2F, –CF2, position 6th), −126.0 (s, 2F, –CF2, position 7th). These fluorine peaks confirmed the introduction of the long perfluorocarbon chain (CF3–(CF2)6–CF2–) on the melamine moiety.
O group of the PFO, which decreases the electron cloud density around N–H (Fig. 5). In 19F-NMR (Fig. S1†) of PFOM, (DMSO-d6, delta δ ppm): δ = −80.5 (s, 3F, –CF3, position 8th), −116.8 (s, 2F, –CF2, position 2nd), −121.6 (s, 2F, –CF2, position 3rd), −122.0 (s, 2F, –CF2, position 4th), −122.3 (s, 2F, –CF2, position 5th), −122.7 (s, 2F, –CF2, position 6th), −126.0 (s, 2F, –CF2, position 7th). These fluorine peaks confirmed the introduction of the long perfluorocarbon chain (CF3–(CF2)6–CF2–) on the melamine moiety.
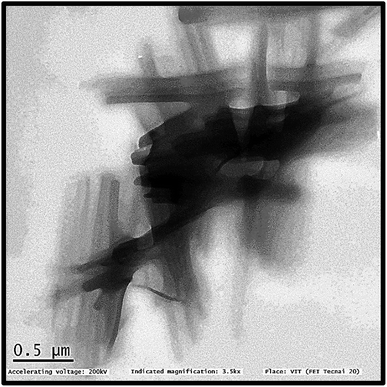
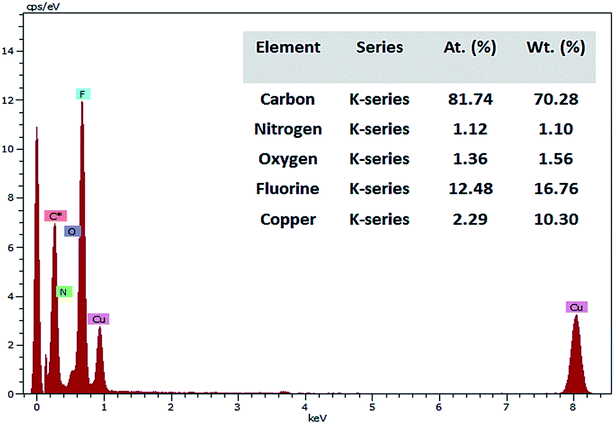
TEM images (Fig. 6) illustrates the shape of PFOM. It was observed that PFOM molecules aggregated rod-like shape. In addition, the incorporation of PFO was clearly evidenced by EDX analysis (Fig. 7). From the elemental composition data, it is evident that the atomic wt% of fluorine is higher than other heteroatoms like N, and O. Hence, it can be confirmed that the perfluoro long chain, PFO, was successfully anchored onto the melamine moiety, which played a major role in altering surface chemical properties of PVDF membranes.
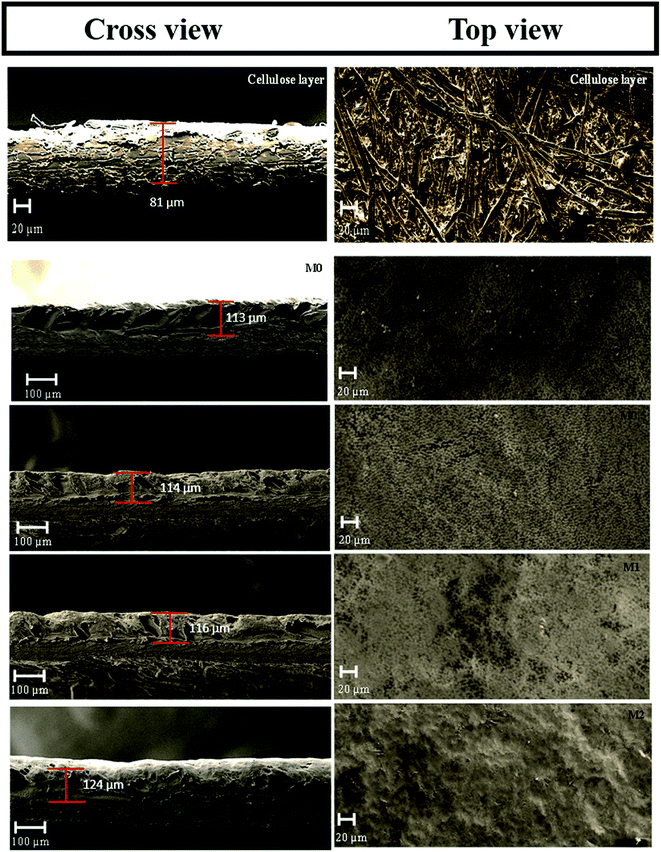
4.2 Morphology and topological properties of the dual-layered membranes
Fig. 8 displays the cross-sectional and top surface SEM images of the cellulose support and dual-layered membranes. Thinner cellulosic fibres were intercross linked on the cellulose support surface. In the case of dual-layered membranes (see Fig. 8 M0–M2), though PVDF matrix strongly adhered to the cellulose support layer due to its strong polymer chain entanglement, it was easy to distinguish the layers of PVDF top layer and cellulose-based support. The membrane thickness was maintained around ∼81 μm for cellulose bottom support and ∼116 μm for top PVDF layer. However, the addition of more than optimum concentration of PFOM in M2 led to notable increase in membrane top layer thickness. In particular, the bare membrane, M0, displayed a larger number of surface pores with a wider substructure. The addition of PFOM hydrophobic fillers led to many protrusions (roughness) in modified membranes (M0.5–M2). Decreasing number of surface pores were also noticed with the increasing amount of PFOM. However, no significant change was observed in the bottom support cellulose layer.37,39The EDX spectrum (Fig. 9) of the cellulose support layer exhibited peaks of C (51.5%) and O (48.5%) atoms. The dual-layered membrane M0 displayed F (49.52%) atom along with C (48.3%), O (2.29%) which was expected, as the entire cellulose support was coated with the PVDF polymer. The elemental composition of the modified membrane (M1) was C (43.15%), O (1.62%) and F (55.23%). The increasing F atomic% confirms that hydrophobic fluoroalkyl chains are highly entangled on the modified membrane surfaces.49
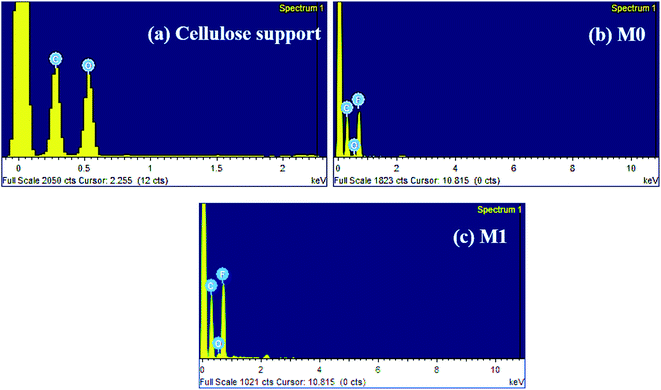 | ||
| Fig. 9 EDX spectrum of (a) cellulose support (b) bare PVDF membrane, M0 and (c) modified PVDF membrane, M1. | ||
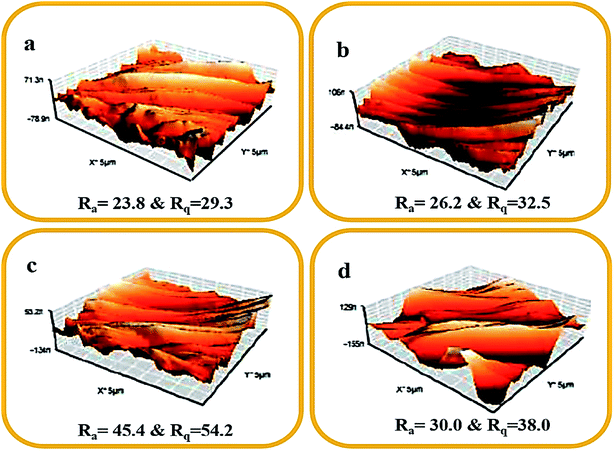
Fig. 10 displays the surface roughness profile image and the two surface roughness parameters (Ra and Rq) for all fabricated membranes. Here, Ra and Rq denote the average roughness and the root mean square roughness, respectively. The Ra and Rq values of the bare membrane (M0) were lower when compared with the modified membranes (M0.5–M2). The long perfluoro chain in the PFOM hydrophobic fillers enhanced the membrane surface roughness because of its random overlapping with the PVDF backbone. This effect was seen up to 1 wt% of filler content while the trend reversed for higher loading (2%) of PFOM. The obtained AFM results were more consistent with SEM results. Overall, both AFM and SEM findings indicated that adding PFOM fillers increased the roughness of membrane surfaces, which was expected to improve hydrophobic properties.50
4.3 Water contact angle, porosity, mean pore size and liquid entry pressure (LEPw) of the dual-layered membranes
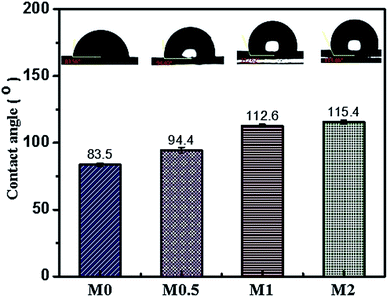
Increasing sessile drop contact angle values are observed in membranes incorporated with PFOM hydrophobic fillers. The incorporation of the 2 wt% PFOM significantly increased the membrane water contact angle to 115°(±1.7) as opposed to 83.5°(±) for M0. The reason for high CA value can be attributed to the surface chemical properties (F-content) of the membranes and high surface roughness (see Fig. 11).51 The interwoven, hydrophobic long-chain perfluoro moieties on the membrane surfaces can effectively diminish the contact with water molecules, and thus impart the hydrophobic character.Work of adhesion (Wa), Interfacial free energy (γSl), surface free energy and wetting tension (ΔF) results are shown in Table 2 to provide more information on membrane surface properties. The calculated values of Wa, γSV and ΔF decreased significantly to 41.1(±2.5), 10.0(±1.0) and −31.6(±2.5) with the addition of 2 wt% of PFOM. At the same time, γSl value displayed an increasing trend. Overall, these results indicated the improvement in the nonwetting character of the membrane surfaces.
| Membrane | Work of adhesion, Wa (mJ m−2) | Interfacial free energy, γSl (mJ m−2) | Surface free energy, γSV (mJ m−2) | Wetting tension (ΔF) |
|---|---|---|---|---|
| M0 | 78.8(±2.0) | 21.4(±1.0) | 27.5(±1.1) | 6.0(±2.0) |
| M0.5 | 67.3(±3.1) | 26.9(±1.6) | 21.5(±1.5) | −5.4(±3.1) |
| M1 | 44.7(±1.6) | 39.3(±0.9) | 11.2(±0.6) | −28.0(±1.6) |
| M2 | 41.1(±2.5) | 41.6(±1.4) | 10.0(±1.0) | −31.6(±2.5) |
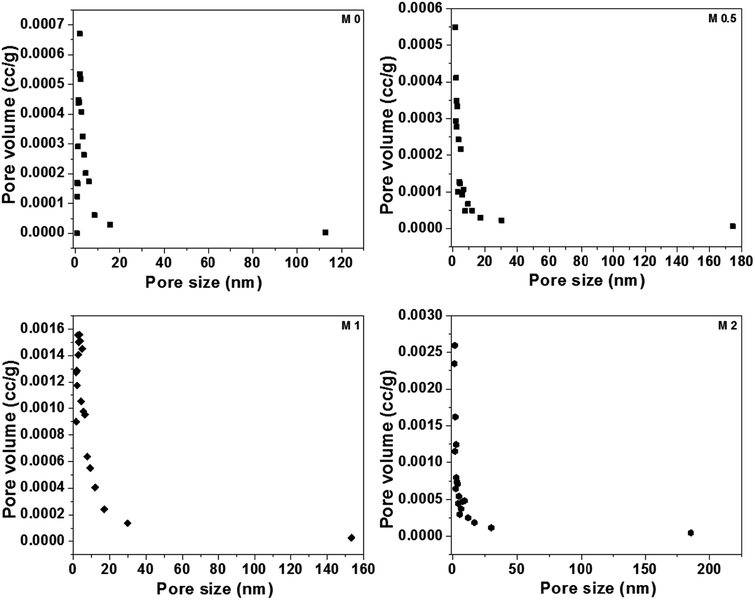
BET analysis was carried out to analyze the porous nature of the dual-layered membranes. All membranes displayed a typical type II isotherm because of the hysteresis at lower relative pressures (shown in Fig. S3†). Further, these results also revealed that all membranes consist of a large number of membrane pores in mesopore region. The values of the surface area (m2 g−1), BJH mean pore size (nm) and BJH mean pore volume (cm3 g−1) are given in Table 3 and BJH pore size distribution of membranes was shown in Fig. 12. It can be seen that the membrane surface area is in agreement with the membrane porosity results. The surface area, mean pore size and pore volume of M0 were 8.317 m2 g−1, 1.87 nm and 0.013 cm3 g−1, respectively. There was a notable increase in pore size and pore volume with the incorporation of PFOM. This could be due to the presence of aromatic melamine moiety along with aliphatic PFO, which could increase the pore size.
| Membrane | Porosity (%) | BET surface area (m2 g−1) | BJH mean pore size (nm) | BJH pore volume (cm3 g−1) | Liquid entry pressure (LEPw, bar) |
|---|---|---|---|---|---|
| M0 | 78.7(±0.9) | 8.317 | 1.87 | 0.013 | 1.4 |
| M0.5 | 72.2(±1.1) | 6.113 | 3.14 | 0.057 | 1.7 |
| M1 | 75.1(±1.5) | 6.338 | 5.02 | 0.079 | 2.0 |
| M2 | 69.2(±0.5) | 5.655 | 3.92 | 0.055 | 2.0 |
The mean pore size of M1 was determined to be ∼5 nm. This is sufficiently small to yield good performance in the DCMD application as evidenced by earlier works.41
The higher surface hydrophobicity and surface roughness play a significant role in the membrane wetting characteristics as determined by the LEPw experiment. The modified membranes have a greater pore size which suggests that the LEPw would be lower. However, our experiments yielded quite the opposite result. This confirms the effect of membrane surface hydrophobicity, which has a superlative role as compared to the ∼2 nm increase in the mean pore size. The M0 displayed the lowest LEPw (given in Table 3) was in agreement with the SEM images which displayed a large number of surface pore openings. The modified membranes exhibited a sufficiently denser top layer with interconnected pores. This also explains the LEPw results.
4.4 Mechanical properties of the dual-layered membrane
The mechanical properties of membranes were calculated based on strain–stress measurements and tensile strength, Young's modulus and elongation (%) results are tabulated in Fig. S2† and Table 4. The addition of PFOM hydrophobic fillers improved the mechanical properties of PVDF membranes. The incorporation of PFOM into the PVDF matrix improved the tensile strength and elongation (%) of the modified membranes. These results suggest that the existence of a flexible long aliphatic PFO chain, with strong melamine in PFOM fillers, reinforces the dual-layer polymer matrix with greater elasticity.41,52 In addition, the decreasing trend of Young's modulus also supports the flexibility of the modified membranes. Finally, the optimum content of the fillers was limited to 1 wt% and a further increase would negatively affect the mechanical properties of the membrane.| Membrane | Tensile strength (MPa) | Young's modulus (MPa) | % of elongation (%) |
|---|---|---|---|
| M0 | 7.9 | 3.9 | 2.0 |
| M0.5 | 8.2 | 2.6 | 3.1 |
| M1 | 9.6 | 2.7 | 3.5 |
| M2 | 8.0 | 3.1 | 2.6 |
4.5 Membrane performance in direct contact membrane distillation process
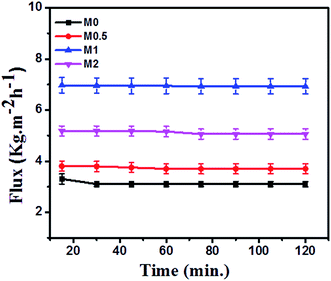
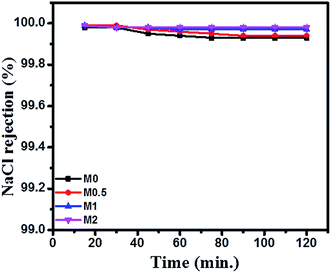
The DCMD performance of bare and PFOM modified PVDF membranes is displayed in Fig. 13 and 14. In general, the permeate flux is greater for membranes with higher porosity. However, this trend was not observed for the PFOM incorporated membranes. Hence, this indicates that apart from porosity, other factors such as membrane surface properties and tortuosity significantly influence the permeation properties of the membrane. From Fig. 13, it can be observed that M1 displayed the greatest flux as compared to M0 when tested with the simulated seawater. This phenomenon could be mainly explained as follows: the addition of optimum concentration (1 wt%) of hydrophobic PFOM to prepare the modified dual-layered membrane improves the membrane surface hydrophobicity. This hydrophobic porous top layer reduces the vapour diffusion resistance into the membrane surface.39 In addition, the hydrophilic bottom layer reduces the transport path length of water vapors, thereby allowing faster permeation rates.Finally, the top hydrophobic and bottom hydrophilic layers act as absorption and desorption sites for water vapor molecules, respectively. This observation is supported by membrane characterization features such as water contact angle and LEPw. During desalination process, for all membranes, the conductivity of permeate was constant ∼20 μS cm−1 during the entire course of the experiment. This demonstrated an excellent permeate quality with a salt rejection rate of 99.9% even after 120 min (Fig. 14).
To compare the performance of the PFOM incorporated dual-layered membrane, the permeate flux and salt rejection were also compared with existing recent research reports, as shown in Table 5.53–55 It was observed that the PFOM modified membrane exhibited considerably reasonable flux and high salt rejection performance. Though the incorporation of the fillers improved many desired characteristics (improved morphology, surface hydrophobicity, mechanical strength, roughness properties of membranes) of the membrane for MD process, they lowered the membrane porosity, which could affect the permeate flux. Further, the membrane efficiency was evaluated using synthetic salt-solution. This has to be further extended to actual sea-water to study the long-term stability of the membranes. These parameters are being evaluated, and will be presented in our future studies. However, our overall investigation demonstrates that PFOM hydrophobic filler has the potential to be employed as an effective surface modifying agent in the preparation of hydrophobic dual-layered membranes for desalination using DCMD.
| Membrane | MD config. | Flux (kg m−2 h−1) | Rejection of NaCl (%) | Contact angle (°) | Temperature (°C) | References | |
|---|---|---|---|---|---|---|---|
| Feed | Permeate | ||||||
| PVDF/rGO | AGMD | 7.0 | >99.9 | 59 | 70 | 20 | 53 |
| PVDF–SiO2/PVDF | DCMD | 6.8 | 99.9 | 139 | 27.5 | 15 | 54 |
| PVDF/clay | DCMD | 5.7 | >99.9 | 154 | 80 | 17 | 22 |
| PVDF/MWCNTs | DCMD | 9.5 × 10⁻³ | 100 | 94 | 82 | 22 | 19 |
| PVDF/APTS/GO | AGMD | 6.2 | 99.1 | 77 | 85 | 20 | 23 |
| PVDF/PVA | DCMD | 2.4–7.6 | 60–80 | — | 65 | 17 | 55 |
| Dual layered PVDF–PFOM/cellulose | DCMD | 6.9 | 99.9 | 112 | 60 | 20 | This work |
5. Conclusions
A new class of PFOM fillers embedded PVDF/cellulose dual-layered membranes with hydrophobic–hydrophilic channels were successfully fabricated for direct contact membrane distillation application. The EDX results revealed the presence of PFOM hydrophobic filler on the membrane surfaces. The SEM, mechanical strength, porosity and surface area results revealed that the optimum loading concentration of the hydrophobic filler, PFOM, was 1 wt% for membrane preparation. The surface of modified membranes remained hydrophobic as evidenced by the higher water contact angle, improved roughness and greater liquid entry pressure of water (LEPw). The modified membranes exhibited excellent water-vapour permeability for up to 120 min., when challenged with simulated sea-water (3.5% w/v of NaCl). The long-term rejection test did not exhibit any loss in membrane selectivity because the modified membranes retained 99.9% of the initial salt concentration for a feed temperature of 60 °C. Hence, it can be confirmed that the PFOM modified dual-layered membrane holds great potential to improve the performance of DCMD membranes which can be utilized for seawater desalination process.Conflicts of interest
There are no conflicts to declare.Acknowledgements
Science and Engineering Research Board (SERB), India is gratefully acknowledged for the financial support under National Post-Doctoral Fellowship Scheme (PDF/2017/000283) for this research work.References
- T. Distefano and S. Kelly, Ecol. Econ., 2017, 142, 130–147 CrossRef.
- NITI Aayog, Composite Water Resources Management Index for Indian States, http://pibphoto.nic.in/documents/rlink/2018/jun/p201861401.pdf, accessed June 2019 Search PubMed.
- S. Manju and N. Sagar, Renewable Sustainable Energy Rev., 2017, 70, 298–313 CrossRef.
- L. N. Nthunya, L. Gutierrez, S. Derese, E. N. Nxumalo, A. R. Verliefde, B. B. Mamba and S. D. Mhlanga, J. Chem. Technol. Biotechnol., 2019, 94, 2757–2771 CrossRef CAS.
- D. Hou, C. Ding, K. Li, D. Lin, D. Wang and J. Wang, Desalination, 2018, 428, 240–249 CrossRef CAS.
- L. N. Nthunya, L. Gutierrez, L. Lapeire, K. Verbeken, N. Zaouri, E. N. Nxumalo, B. B. Mamba, A. R. Verliefde and S. D. Mhlanga, Sep. Purif. Technol., 2019, 228, 115793 CrossRef CAS.
- P. Lin, M. Yang, Y. Li and J. Chen, J. Membr. Sci., 2015, 475, 511–520 CrossRef CAS.
- C. A. Quist-jensen, F. Macedonio, C. Conidi, A. Cassano, S. Aljlil and O. A. Alharbi, J. Food Eng., 2016, 187, 37–43 CrossRef CAS.
- H. Liu and J. Wang, J. Hazard. Mater., 2013, 261, 307–315 CrossRef CAS PubMed.
- L. N. Nthunya, L. Gutierrez, A. R. Verliefde and S. D. Mhlanga, J. Chem. Technol. Biotechnol., 2019, 94, 2826–2837 CrossRef CAS.
- H. Ramlow, R. A. F. Machado, A. C. K. Bierhalz and C. Marangoni, Environ. Technol., 2018, 1–13 CrossRef PubMed.
- J. Zuo, S. Bonyadi and T.-S. Chung, J. Membr. Sci., 2016, 497, 239–247 CrossRef CAS.
- K. C. Chong, S. O. Lai, K. M. Lee, W. J. Lau, A. F. Ismail and B. S. Ooi, Desalin. Water Treat., 2015, 54, 3218–3226 CrossRef CAS.
- R. Roshani, F. Ardeshiri and M. Peyravi, RSC Adv., 2018, 8, 23499–23515 RSC.
- F. Yang, J. E. Efome, D. Rana, T. Matsuura and C. Lan, ACS Appl. Mater. Interfaces, 2018, 10, 11251–11260 CrossRef CAS PubMed.
- L. N. Nthunya, L. Gutierrez, N. Khumalo, S. Derese, B. B. Mamba, A. R. Verliefde and S. D. Mhlanga, Colloids Surf., A, 2019, 575, 363–372 CrossRef CAS.
- K. Lu, J. Zuo and T. Chung, J. Membr. Sci., 2017, 539, 34–42 CrossRef CAS.
- Y. Song, Z. Wang, Q. Wang, B. Li and B. Zhong, J. Appl. Polym. Sci., 2016, 133, 43372, DOI:10.1002/app.43372.
- T. L. S. Silva, S. Morales-Torres, J. L. Figueiredo and A. M. T. Silva, Desalination, 2015, 357, 233–245 CrossRef CAS.
- Y. C. Woo, L. D. Tijing, W.-G. Shim, J.-S. Choi, S.-H. Kim, T. He, E. Drioli and H. K. Shon, J. Membr. Sci., 2016, 520, 99–110 CrossRef CAS.
- S. Ragunath, S. Roy and S. Mitra, Sep. Purif. Technol., 2018, 194, 249–255 CrossRef CAS.
- J. A. Prince, G. Singh, D. Rana, T. Matsuura, V. Anbharasi and T. S. Shanmugasundaram, J. Membr. Sci., 2012, 397–398, 80–86 CrossRef CAS.
- S. Leaper, A. Abdel-Karim, B. Faki, J. M. Luque-Alled, M. Alberto, A. Vijayaraghavan, S. M. Holmes, G. Szekely, M. I. Badawy, N. Shokri and P. Gorgojo, J. Membr. Sci., 2018, 554, 309–323 CrossRef CAS.
- N. Hamzah and C. P. Leo, Sep. Purif. Technol., 2016, 167, 79–87 CrossRef CAS.
- X. Li, M. C. García-Payo, M. Khayet, M. Wang and X. Wang, J. Membr. Sci., 2017, 542, 308–319 CrossRef CAS.
- D. Tong, X. Wang, M. Ali, C. Q. Lan, Y. Wang, E. Drioli, Z. Wang and Z. Cui, Sep. Purif. Technol., 2016, 157, 1–8 CrossRef CAS.
- E. Lee, A. Kyoungjin, T. He, Y. Chul and H. Kyong, J. Membr. Sci., 2016, 520, 145–154 CrossRef CAS.
- H.-C. Yang, W. Zhong, J. Hou, V. Chen and Z.-K. Xu, J. Membr. Sci., 2017, 523, 1–7 CrossRef CAS.
- A. Figoli, C. Ursino, F. Galiano, E. Di Nicolò, P. Campanelli, M. C. Carnevale and A. Criscuoli, J. Membr. Sci., 2017, 522, 192–201 CrossRef CAS.
- M. Qtaishat, D. Rana, M. Khayet and T. Matsuura, J. Membr. Sci., 2009, 327, 264–273 CrossRef CAS.
- Y. Wu, Q. Huang, C. Xiao, K. Chen, X. Li and N. Li, Desalination, 2014, 353, 118–124 CrossRef CAS.
- Y. Kong, X. Lin, Y. Wu, J. Chen and J. Xu, J. Appl. Polym. Sci., 1992, 46, 191–199 CrossRef CAS.
- Y. Wu, Y. Kong, X. Lin, W. Liu and J. Xu, J. Membr. Sci., 1992, 72, 189–196 CrossRef CAS.
- H. Dzinun, M. H. D. Othman, A. F. Ismail, M. H. Puteh, M. A. Rahman and J. Jaafar, Desalination, 2017, 403, 46–52 CrossRef CAS.
- S. S. Ray, S.-S. Chen, H.-T. Hsu, D.-T. Cao, H.-T. Nguyen and N. C. Nguyen, Sep. Purif. Technol., 2017, 186, 352–365 CrossRef CAS.
- M. Khayet and R. Wang, ACS Appl. Mater. Interfaces, 2018, 10, 24275–24287 CrossRef CAS PubMed.
- X. Lu, Y. Peng, L. Ge, R. Lin, Z. Zhu and S. Liu, J. Membr. Sci., 2016, 505, 61–69, DOI:10.1016/j.memsci.2015.12.042.
- L. Ren, F. Xia, V. Chen, J. Shao, R. Chen and Y. He, Desalination, 2017, 423, 1–11 CrossRef CAS.
- D. Zhao, J. Zuo, K. J. Lu and T. S. Chung, Desalination, 2017, 413, 119–126 CrossRef CAS.
- J. I. Tapia, E. Alvarado-Gómez and A. Encinas, Sep. Purif. Technol., 2019, 222, 221–229 CrossRef CAS.
- A. Jafari, M. Reza, S. Kebria, A. Rahimpour and G. Bakeri, Chem. Eng. Process., 2018, 126, 222–231, DOI:10.1016/j.cep.2018.03.010.
- T. L. S. Silva, S. Morales-torres, J. L. Figueiredo and A. M. T. Silva, Desalination, 2015, 357, 233–245 CrossRef CAS.
- H. Zhang, B. Li, D. Sun, X. Miao and Y. Gu, Desalination, 2018, 429, 33–43 CrossRef CAS.
- T. A. Agbaje, S. Al-Gharabli, M. O. Mavukkandy, J. Kujawa and H. A. Arafat, Desalination, 2018, 436, 69–80 CrossRef CAS.
- N. Jacob, A. Thanigaivelan, D. Rana and D. Mohan, Mater. Chem. Phys., 2017, 186, 146–158 CrossRef.
- T. Arumugham, R. G. Amimodu, N. J. Kaleekkal and D. Rana, J. Environ. Sci., 2019, 82, 57–69, DOI:10.1016/j.jes.2019.03.001.
- T. Arumugham, N. Jacob and D. Rana, Polym. Test., 2018, 72, 1–10 CrossRef CAS.
- D. W. Lachenmeier, E. Humpfer, F. Fang, B. Schütz, P. Dvortsak, C. Sproll and M. Spraul, J. Agric. Food Chem., 2009, 57, 7194–7199 CrossRef CAS PubMed.
- M. Khayet, M. C. García-Payo, L. García-Fernández and J. Contreras-Martínez, Desalination, 2018, 426, 174–184 CrossRef CAS.
- Z.-Q. Dong, X.-H. Ma, Z.-L. Xu and Z.-Y. Gu, RSC Adv., 2015, 5, 67962–67970 RSC.
- A. A. Khan, I. A. Khan, M. I. Siyal, C.-K. Lee and J.-O. Kim, Environ. Res., 2019, 170, 374–382 CrossRef CAS PubMed.
- S. S. Ray, S.-S. Chen, C. T. N. Dan, H.-T. Hsu, H.-M. Chang, N. Cong Nguyen and H.-T. Nguyen, RSC Adv., 2018, 8, 1808–1819 RSC.
- A. Abdel-Karim, J. M. Luque-Alled, S. Leaper, M. Alberto, X. Fan, A. Vijayaraghavan, T. A. Gad-Allah, A. S. El-Kalliny, G. Szekely, S. I. A. Ahmed, S. M. Holmes and P. Gorgojo, Desalination, 2019, 452, 196–207 CrossRef CAS.
- J. E. Efome, D. Rana, T. Matsuura and C. Q. Lan, Water Res., 2016, 89, 39–49 CrossRef CAS PubMed.
- J. Zhu, L. Jiang and T. Matsuura, Chem. Eng. Sci., 2015, 137, 79–90 CrossRef CAS.
Footnote |
| † Electronic supplementary information (ESI) available. See DOI: 10.1039/c9ra08945d |
| This journal is © The Royal Society of Chemistry 2019 |


