 Open Access Article
Concentration and pump power-mediated color tunability, optical heating and temperature sensing via TCLs of red emission in an Er3+/Yb3+/Li+ co-doped ZnGa2O4 phosphor
Monikaa,
Ram Sagar Yadav*b,
Amresh Bahadura and
Shyam Bahadur Rai *a
*a
aLaser & Spectroscopy Laboratory, Department of Physics, Institute of Science, Banaras Hindu University, Varanasi 221005, India. E-mail: sbrai49@yahoo.co.in
bDepartment of Zoology, Institute of Science, Banaras Hindu University, Varanasi 221005, India. E-mail: ramsagaryadav@gmail.com
First published on 3rd December 2019
Abstract
Intense red upconversion luminescence was observed in the Er3+/Yb3+/Li+ co-doped ZnGa2O4 phosphor synthesized through the solid state reaction method for the first time. The structural characterization showed a large crystalline nature and an increase in the particle size via Li+ doping. The absorption spectra showed a large number of peaks in the UV-vis-NIR regions due to the Er3+ and Yb3+ ions. The Er3+/Yb3+ co-doped ZnGa2O4 phosphor exhibited green, red and NIR upconversion emissions on excitation with 980 nm radiation. The intensity of the red emission was relatively larger than that of the other emissions. The luminescence intensity versus pump power measurements revealed the number of required photons for these emissions. The phosphor showed very interesting color tunability as a function of Er3+ ion concentration and incident pump power. The luminescence intensity of the Er3+/Yb3+ co-doped phosphor was enhanced more than two times via Li+ doping. The enhancement in the luminescence intensity was proposed to be due to the increase in the crystallinity and particle size of the phosphor. The lifetimes of the 4S3/2 and 4F9/2 levels also increased in the presence of Li+ ions. The variation in the fluorescence intensity ratio (FIR) of the thermally coupled levels (TCLs) of the red emission with incident pump power offered effective optical heating in the phosphor. The temperature-induced FIR using TCLs of red emission exhibited a larger value of temperature sensing sensitivity in the presence of Li+ ions, which was up to 14 × 10−4 K−1. Thus, the Er3+/Yb3+/Li+ co-doped ZnGa2O4 phosphor may be used in photonic, optical heating, and temperature sensing devices.
1. Introduction
Optical thermometry is based on the fluorescence intensity ratio (FIR) arising from thermally coupled levels. FIR occurs due to the variation in the upconversion emission intensities between the two thermally coupled levels (TCLs). TCLs are generally found in some of the rare earth ions.1–4 The rare earth ions exhibit abundant energy levels and result in interesting luminescence of narrow band widths due to the wide range of lifetimes, i.e., from few milliseconds (ms) to microseconds (μs).5–11 The rare earth-doped upconversion phosphor materials are very encouraging materials and have a large number of technological applications in various fields, such as light-emitting diodes (LEDs), induced optical heating, temperature sensing, chemo-dynamic and photo-dynamic therapy, cancer treatment, bio-thermal treatment, bio-imaging, and theranostics.12–19 Basically, upconversion is a non-linear optical process, and it is characterized by anti-Stokes emissions, in which two or more low-energy photons are added together and are converted into a high-energy photon.20–22 Er3+ is a rare earth ion, which has been employed as an activator extensively to study upconversion (UC) photoluminescence, UC-based induced optical heating, and temperature sensing sensitivity in different host materials. The Er3+ ion has suitable TCLs, which result in a good fit of FIR not only for induced optical heating but also for temperature sensing of phosphor materials.23–28In the UC photoluminescence of Er3+/Yb3+ co-doped phosphors, the Er3+ ion weakly absorbs an incident near infrared (NIR) 980 nm photon and gives poor UC emission intensity. However, its efficiency can be enriched significantly via the doping of Yb3+ ions. The Yb3+ ion having a large absorption cross-section for NIR light can efficiently absorb it and transfer its excitation energy to the Er3+ ion. It has been observed that the UC emission intensity of phosphor materials is also affected by the concentration of the activator ion. The change in the concentration of Er3+ ions not only improves the UC emission intensity to a certain extent but also leads to tune colors emitted by the phosphors.29–33 This type of observation was achieved by Suo et al. in Er3+/Yb3+ co-doped Ba5Gd8Zn4O21 phosphors.34 Initially, the Er3+ doped Ba5Gd8Zn4O21 phosphor emits pure green color. When the Yb3+ ion is added in the Er3+ doped Ba5Gd8Zn4O21 phosphor, the UC emission intensity of the phosphor is enhanced. They also observed color tunability from yellow to reddish yellow regions due to the change in the concentrations of Er3+ and Yb3+ ions. This occurs due to the shifting of the population of the ions from higher to lower excited states through non-radiative relaxations. Our group has also realized color tunability as a function of Er3+ ion concentration in different host matrices.7,20,28 In these works, green emission is dominant over red emission upon NIR excitation. Inspite of these, the color emitted by a phosphor can also be tuned by increasing the pump power of the 980 nm radiation. Gao et al. studied the effect of excitation power and observed color tunability in the NaYbF4:X3+ (X = Er, Ho, and Tm) microcrystal.35 They also observed a change in the color from green to red, followed by a yellow emission in the NaYbF4:Er3+ microcrystals. Recently, Cheng et al. studied the effect of concentration and pump power on the UC emission intensity of Er3+/Yb3+ co-doped ZnGa2O4 and ZnAl2O4 powder phosphors and obtained only an intense red emission.36 In the present case, we have studied the UC phenomenon in the Er3+/Yb3+ co-doped ZnGa2O4 phosphor and observed not only an intense red UC emission but also found efficient color tunability due to the change in the concentrations of Er3+ ion and pump power of 980 nm radiation.
Nowadays, researchers are encouraged to produce efficient sources of Er3+/Yb3+ co-doped phosphor materials by incorporating some additional ions, such as Li+, Mn2+, Mg2+, Zn2+, Ce3+, and Bi3+.37–41 They are known as surface modifiers and are helpful in improving the UC emission intensity by modifying the local crystal structure. Out of these ions, the Li+ ion has been widely incorporated in different combinations of Er3+/Yb3+ co-doped phosphor materials.42–45 It has been noted that the Li+ ion can easily enter into the sites of host lattices due to its smaller ionic radius and has been proved as a suitable surface modifier. Zhao et al. have reported Li+ ions as a doping element for improving the crystallinity and UC emission intensity in NaYF4:Tm3+/Yb3+ nanoparticles.46 The addition of Li+ ions is also found to increase the UC emission intensity of β-NaYF4:Er3+/Yb3+ microparticles.47 Chen et al. have incorporated Li+ ions in the Y2Ti2O7:Er3+/Yb3+ nanophosphor and deduced that the Li+ ion modifies the local crystal field around the Er3+ ion and improves the crystallinity. It also creates oxygen vacancies to maintain charge neutrality in the phosphor.44 These parameters contributed significantly to the improvement of UC emission intensity of the phosphor. The UC emission intensity of the Er3+/Yb3+ co-doped Y2O3 nanocrystals is also found to increase due to similar reasons by Li+ doping.45 The addition of Cr3+ ion in the Er3+/Yb3+ co-doped ZnGa2O4 phosphor led to the improvement of UC emission intensity and the energy transfer from Er3+ to Cr3+ ions leads to the emission of red color from the Cr3+ ion.48 However, the effect of Li+ ions on the UC emission intensity of Er3+/Yb3+ co-doped ZnGa2O4 phosphor has still not been studied, to the best of our knowledge.
The thermally coupled levels (TCLs) of rare earth ions are generally separated by a very small energy gap and they lie in the range of 100–2000 cm−1.3,14 The small energy gap is preferred as it can experience a slight change in the pump power and temperature.2,14 It has been mentioned earlier that UC emission originating from the TCLs varies non-linearly, as the incident pump power of the exciting source is changed. The non-linear variation in UC emission intensity gives rise to a FIR, which is a direct measure of the optical heating in the phosphor sample.13,28 The optical heating is generally used in the treatment of infected parts of human organs in which laser guided tools are utilized.15,19 Optical heating was observed by Du et al. in the Er3+/Yb3+ co-doped Na0.5Gd0.5MoO4 phosphor, which is a UC-based FIR technique.13 They have reported that when the pump power of the exciting source is changed, the population of ions is exchanged between the two TCLs. This can generate different values of UC emission intensities from the TCLs. The similar result was also achieved by our group in the Er3+/Yb3+ co-doped La2O3 phosphor.28 In this work, we have used TCLs of green emission for obtaining FIR. However, we have used the TCLs of red emission to find FIR in the present work. The optical heating from Er3+/Yb3+ ions in the ZnGa2O4 phosphor is also not investigated in the absence and presence of Li+ ions, to the best of our knowledge.
On the other hand, optical thermometry has been studied by various researchers in different host materials.1–4,49–52 The UC-based FIR is a versatile technique in the field of optical thermometry to realize a slight change in the temperature of the desired system without any contact.14 The UC emission intensity of the TCLs is also affected by changing the external temperature of the phosphor.1–4 A number of studies was carried out by researchers using Er3+/Yb3+ ions in different phosphor materials.23–28,50 These authors have found FIR by taking UC emission intensities of TCLs of green emission as a function of temperature. It is well known that the 2H11/2 and 4S3/2 levels of Er3+ ion are thermally coupled and they give rise to different values of UC emission intensities as a function of external temperature.23–28 However, the red emitting (4F9/2) level of Er3+ ion also has several Stark components and they are well separated from each other. They can be considered as TCLs and can be used to measure FIR. The Stark components of red emission lie within the range of TCLs (i.e., 165 cm−1).14 This can yield interesting induced optical heating and temperature sensing observations in the phosphor material. Temperature sensing based on TCLs of green emission has been widely explored.23–28 However, the impact of red emission is rarely reported for temperature sensing in the Er3+/Yb3+ co-doped phosphor.34 Moreover, Wang et al. studied temperature sensing in Ho3+/Yb3+ co-doped Ba2In2O5 phosphor by treating the Stark components of red emission (i.e., 653 and 661 nm) as TCLs, which are used for calculating the FIR.3 The temperature sensing characteristics in the Er3+/Yb3+ co-doped ZnGa2O4 phosphor have also not been investigated, to the best of our knowledge, and need a further study.
In order to get more UC emission intensity, a low phonon energy host is preferred. Zinc gallate (ZnGa2O4) has been used as a host due to its low phonon energy. The low phonon energy host generally decreases the non-radiative relaxations of the ions occurring in higher lying energy levels. Rare earth doped zinc gallate phosphors have been given much interest due to their wide applications in a variety of fields, such as lighting, field emission display devices (FEDs), and plasma display panels (PDPs).53–55 It contains an optical band gap of the order of 4.4 eV.56 ZnGa2O4 is known as a self-activated host and it emits blue luminescence without doping any activator ion.57 However, sharp and narrow band emissions are observed in the presence of rare earth ions, such as Er3+, Ho3+, and Eu3+ in ZnGa2O4 phosphors.58–61 This host is neutral under NIR illumination. When the Er3+/Yb3+ ions are co-doped in the ZnGa2O4 host, it gives intense red UC emission alongwith weak green emission.36,48 However, the color tunability, induced optical heating, and temperature sensing properties were not explored from Er3+/Yb3+ ions in the ZnGa2O4 phosphor.
In this work, we have selected ZnGa2O4 as a host due to its low phonon energy. The Er3+ and Yb3+ ions are co-doped in the ZnGa2O4 host, which act as acceptor and donor, respectively. The synthesized phosphors are characterized by X-ray diffraction (XRD), scanning electron microscopy (SEM) and energy dispersive X-ray spectroscopic (EDS) techniques to see their structural features. The lattice vibrations in the phosphors have been confirmed by monitoring the Fourier transform infrared (FTIR) spectra. The phosphor sample gives intense red UC emission upon 980 nm excitation. We have observed fine color tunability in the phosphor with different concentrations and incident pump powers. We tried to improve the UC emission intensity of the phosphor by Li+ doping for the first time. We have calculated FIR of the thermally coupled levels of Er3+ ion at different pump powers using two peaks of red emission, i.e., 4F9/2(I) and 4F9/2(II) at 648 and 655 nm wavelengths, respectively. The FIR (i.e., I648nm/I655nm) was also calculated at different external temperatures in the range of 300–600 K by keeping the pump power of the 980 nm excitation source at 1 W. It has been found that the plots between FIR versus pump power and external temperature reveal efficient induced optical heating and temperature sensing properties in the Er3+/Yb3+ and Er3+/Yb3+/Li3+ co-doped ZnGa2O4 phosphors. Thus, the possible applications of Er3+/Yb3+/Li+ co-doped ZnGa2O4 phosphor is suggested in the field of photonic, optical heating, and temperature sensing devices.
2. Experimental
2.1 Synthesis of the phosphor
The ZnGa2O4:xEr3+/3Yb3+ phosphors (where x = 0.3, 0.5, 0.7, 1.0, 1.5, and 1.8 mol%) were synthesized by a high temperature solid state reaction method. The host was prepared by using 47![[thin space (1/6-em)]](https://www.rsc.org/images/entities/char_2009.gif) :
:![[thin space (1/6-em)]](https://www.rsc.org/images/entities/char_2009.gif) 53 ratio of ZnO and Ga2O3 materials, respectively, as was reported earlier.57 Stoichiometric amounts of ZnO, Ga2O3, Yb2O3, and Er2O3 materials were weighed precisely. These materials were mixed using an agate mortar and pestle, and acetone was used as the mixing medium. This process was continued for 1 hour to form a homogeneous powder. The mixed powder was placed in a closed furnace maintained at 1200 °C for 5 hours. The similar process was exercised to synthesize (5 mol%) Li+ doped ZnGa2O4:0.7Er3+/3Yb3+ phosphor using Li2CO3 as the doping material. The material thus obtained was crushed and finally produced in the powder form. This is termed as phosphor material and has been used for further measurements at room temperature.
53 ratio of ZnO and Ga2O3 materials, respectively, as was reported earlier.57 Stoichiometric amounts of ZnO, Ga2O3, Yb2O3, and Er2O3 materials were weighed precisely. These materials were mixed using an agate mortar and pestle, and acetone was used as the mixing medium. This process was continued for 1 hour to form a homogeneous powder. The mixed powder was placed in a closed furnace maintained at 1200 °C for 5 hours. The similar process was exercised to synthesize (5 mol%) Li+ doped ZnGa2O4:0.7Er3+/3Yb3+ phosphor using Li2CO3 as the doping material. The material thus obtained was crushed and finally produced in the powder form. This is termed as phosphor material and has been used for further measurements at room temperature.
2.2 Characterization
The crystallinity and phase of the synthesized phosphors were confirmed by monitoring the X-ray diffraction (XRD) patterns using Cu Kα radiation (λ = 0.15406 nm) from a MiniFlex 600 (Rigaku, Japan) unit at a scan speed of 2° min−1. The surface morphology of the prepared samples was scanned by scanning electron microscopy (SEM) technique (Zeiss, Evo 18 Research unit). The existence of elements in the phosphor was verified by the energy dispersive X-ray spectroscopic (EDS) analysis. The absorption spectra of the phosphors have been monitored in the range of 200–1100 nm by a PerkinElmer Lambda-750 UV-vis-NIR (ultraviolet-visible-near infrared) spectrometer unit. The Fourier transform infrared (FTIR) spectra of the phosphor samples have been recorded in the range of 400–4000 cm−1 using a PerkinElmer IR spectrometer (I-Frontier unit) to see the lattice vibrations of different groups. The UC emission spectra of the phosphor samples have been monitored by using a radiation of 980 nm from a diode laser attached with a PMT (photomultiplier tube) and an iHR320 Horiba Jobin Yvon spectrometer. The lifetime of the 4S3/2 and 4F9/2 levels of Er3+ ion of the phosphors have been monitored by chopping the continuous beam of 980 nm wavelength and a 150 MHz digital oscilloscope (Model no. HM 1507, Hameg instruments). For temperature sensing, the phosphor sample was heated externally by a hot plate stirrer and the temperature of the phosphor sample was measured with the help of a thermo-couple attached with a digital thermometer adjacent to the phosphor sample.3. Results and discussion
3.1 Structural characterization
![[3 with combining macron]](https://www.rsc.org/images/entities/char_0033_0304.gif) m (227) with lattice parameters a = b = c = 8.334 Å and α = β = γ = 90°. The figure also shows that the phosphors are crystalline in both the cases. When a Li+ ion is doped at the site of Ga3+ ion in 0.7Er3+/3Yb3+ co-doped ZnGa2O4 phosphor and the XRD peaks are slightly shifted towards the lower 2θ angle side. It is well known that the ionic radii of the Ga3+ ion is 0.62 Å, while that of the Li+ ion is 0.76 Å. The lattice parameters are expected to increase due to doping of larger ionic radii of Li+ ions in the ZnGa2O4 phosphor. It is also clear from the figure that the full width at half maxima (FWHM) of the XRD peak of Li+ incorporated 0.7Er3+/3Yb3+ co-doped phosphor is slightly reduced compared to the pure phosphor. Once the FWHM is reduced via incorporation of Li+ ions in the pure phosphor, it leads to increase crystallinity of the phosphor sample.44
m (227) with lattice parameters a = b = c = 8.334 Å and α = β = γ = 90°. The figure also shows that the phosphors are crystalline in both the cases. When a Li+ ion is doped at the site of Ga3+ ion in 0.7Er3+/3Yb3+ co-doped ZnGa2O4 phosphor and the XRD peaks are slightly shifted towards the lower 2θ angle side. It is well known that the ionic radii of the Ga3+ ion is 0.62 Å, while that of the Li+ ion is 0.76 Å. The lattice parameters are expected to increase due to doping of larger ionic radii of Li+ ions in the ZnGa2O4 phosphor. It is also clear from the figure that the full width at half maxima (FWHM) of the XRD peak of Li+ incorporated 0.7Er3+/3Yb3+ co-doped phosphor is slightly reduced compared to the pure phosphor. Once the FWHM is reduced via incorporation of Li+ ions in the pure phosphor, it leads to increase crystallinity of the phosphor sample.44
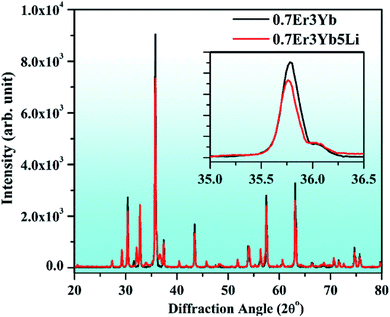 | ||
| Fig. 1 XRD patterns of 0.7Er3+/3Yb3+ and 0.7Er3+/3Yb3+/5Li+ co-doped ZnGa2O4 phosphors. The inset figure shows the zoomed XRD patterns in the 35.0–36.5° region. | ||
The observation of similar shifting was also achieved by our group in the Tb3+/Bi3+ co-doped Y2O3 phosphor. A shifting in the XRD peaks was observed towards the lower 2θ angle side due larger ionic radii of Bi3+ (0.96 Å) compared to Y3+ (0.90) ions.5 It has been also seen that the Bi3+ (0.96 Å) ion further leads to a shifting of the XRD peaks towards lower 2θ angle side in the YPO4 phosphor.62 In our case, the shifting in the XRD peaks towards lower 2θ angle side and the reduction in FWHM improves the crystallinity of the phosphor significantly.63 Thus, the Li+ ion increases the crystallinity of the 0.7Er3+/3Yb3+ co-doped ZnGa2O4 phosphor.44 This could be an encouraging step for obtaining large UC emission intensity in co-doped phosphor materials.
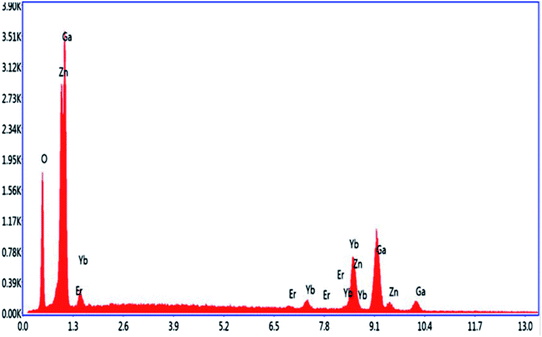
Energy dispersive X-ray spectroscopy (EDS) was used to detect the elements present in the phosphor materials. Fig. 3 shows the EDS spectrum of the Er3+/Yb3+/Li+ co-doped ZnGa2O4 phosphor. It is clear from the figure that the Zn, Ga, Er, Yb, and O elements are observed in the sample. It also signifies that the elements used during the synthesis are completely incorporated in the phosphor. Li element is not detected in the spectrum because it is a very light element and gets ionized during interaction with the electron beam in the SEM chamber.65
3.2 FTIR measurements
The FTIR spectra of pure 0.7Er3+, xEr3+/3Yb3+ (i.e., x = 0.3, 0.5, 0.7, 1.0, 1.5, and 1.8 mol%), and 0.7Er3+/3Yb3+/5Li+ doped and co-doped ZnGa2O4 phosphors are shown in Fig. 4. The spectra contain two vibrational bands centered at 440 and 573 cm−1, and these bands are ascribed to the stretching vibrations of Zn–O and Ga–O molecules, respectively.53 The impurity peaks, such as OH−, do not appear in the spectra as the phosphor samples were synthesized using high temperature solid state reaction method (at 1200 °C).7 The intensity of the vibrational bands varies with the increase in the concentration of the dopant ions. Since the phonon energy of the phosphor is small (i.e., 440 and 573 cm−1), it can increase the rate of radiative transitions in the phosphor. Therefore, it may lead to an improvement in the UC emission intensity of the phosphor samples.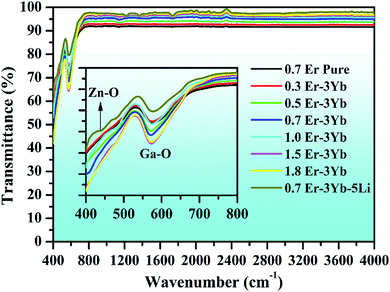 | ||
| Fig. 4 FTIR spectra of 0.7Er3+, xEr3+/3Yb3+ (i.e., x = 0.3, 0.5, 0.7, 1.0, 1.5, and 1.8 mol%), and 0.7Er3+/3Yb3+/5Li+ co-doped ZnGa2O4 phosphors. | ||
3.3 Optical characterization
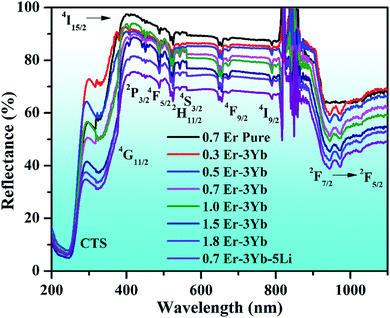 | ||
| Fig. 5 UV-vis-NIR spectra of 0.7Er3+, xEr3+/3Yb3+ (i.e., x = 0.3, 0.5, 0.7, 1.0, 1.5, and 1.8 mol%), and 0.7Er3+/3Yb3+/5Li+ co-doped ZnGa2O4 phosphors. | ||
When the Li+ ion is incorporated in the Er3+/Yb3+ co-doped phosphor, the intensity of the absorption bands is slightly improved. It is also noticed from the figure that there is an additional band observed in the 200–350 nm region. This is due to the charge transfer state (CTS) transitions of O2−–Ga3+ and O2−–Zn2+ ions at 254 and 325 nm wavelengths, respectively.53 This figure also shows that the intensity of the NIR band is also increased in the presence of Li+ ions. This verifies that the Yb3+ ion has better absorption cross section in this region. In fact, the Yb3+ ion absorbs NIR wavelength (i.e., 980 nm) efficiently and transfers its energy to the Er3+ ion, which can yield larger UC emission intensity.2,6,7
 | (i) |
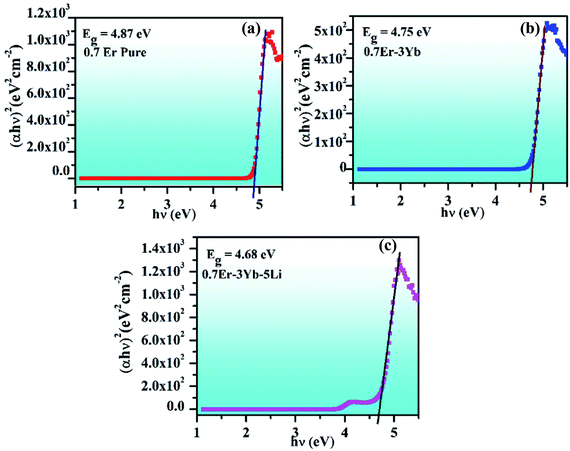 | ||
| Fig. 6 Plots between (αhν)2 versus hν for the (a) 0.7Er3+, (b) 0.7Er3+/3Yb3+, and (c) 0.7Er3+/3Yb3+/5Li+ doped and co-doped ZnGa2O4 phosphors. | ||
The presence of Li+ ions alongwith Er3+ and Yb3+ in the phosphor further reduces the value of the optical band gap to 4.68 eV (see Fig. 6(c)). It has been also observed by our group that the optical band gap of the La2O3 phosphor is reduced significantly in the presence of Bi3+ ion.7 Once the optical band gap is reduced, a large number of excited ions may be promoted to higher lying energy levels. As discussed earlier, Li+ doping also improved the crystallinity and the particle size of the phosphor. Therefore, the UC emission intensity of the phosphor is expected to be enhanced in the presence of Li+ ions due to these reasons.
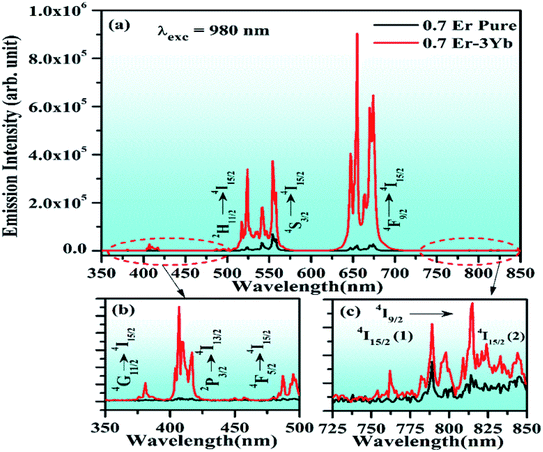
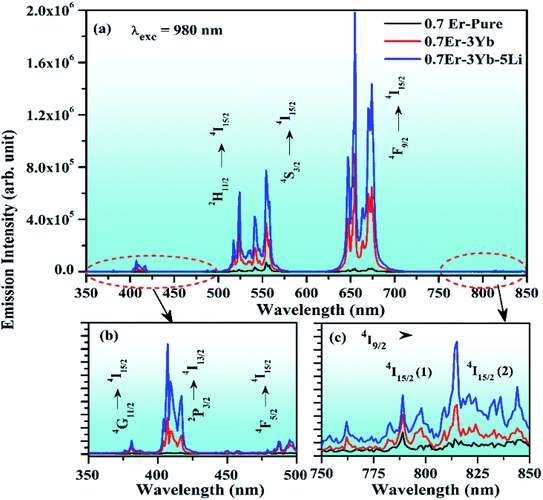
The phosphor gives intense red emission alongwith weak near UV, blue, green, and NIR emissions. However, some of the emission peaks are not clearly seen in the 0.7Er3+ doped phosphor. These peaks can be achieved via doping of the Yb3+ ion. When the Yb3+ ion is doped in the 0.7Er3+:ZnGa2O4 phosphor, the emission peaks in the near UV and blue regions are observed with significant UC emission intensity. This is due to efficient energy transfer from Yb3+ to Er3+ ions.28 The UC intensity of the 0.7Er3+ doped phosphor is enhanced up to 42 times for the red emission (at 655 nm) in the presence of Yb3+ ion. However, the enhancement factor is relatively small for the other emission peaks, i.e., 25, 23, 5, and 3 times for 407, 524, 554, and 814 nm, respectively. The occurrence of intense red UC emission is due to energy back transfer and cross relaxation among the Er3+ ions.30 Zhang et al. have also reported strong red emission due to cross relaxation in the Er3+/Yb3+ co-doped Y2O3 phosphor.32
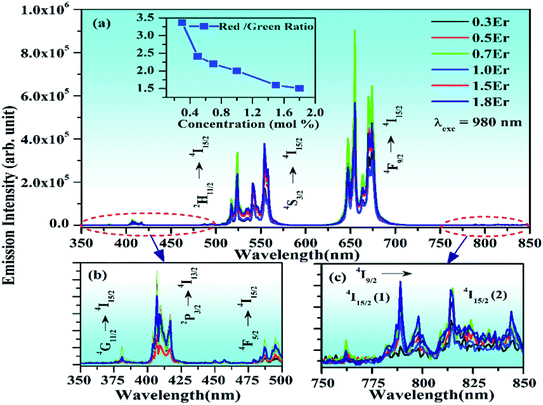
In order to optimize the UC emission intensity of the xEr3+/3Yb3+ co-doped ZnGa2O4 phosphors, the phosphor samples have been synthesized with different concentrations of Er3+ ions (i.e., x = 0.3, 0.5, 0.7, 1.0, 1.5, and 1.8 mol%). When the xEr3+/3Yb3+ co-doped phosphor samples are excited by 980 nm at 1 W, the UC emission intensity of the phosphor initially increases with increase in the concentration of Er3+ ions. It is found to increase up to 0.7 mol% concentration of Er3+ ions. When the concentration of Er3+ ions is further increased, the UC emission intensity decreases due to concentration quenching effect. Li et al. also observed optimum emission intensity at 0.7 mol% concentration of Er3+ ions in the Yb3+/Er3+ co-doped BaZrO3 ceramics and after this, they reported a decrease in the UC intensity.67 Our group has also found the optimum concentration of the Er3+ ion at 0.7 mol% in the Tm3+/Er3+/Yb3+ co-doped Y2O3–ZnO nano-composite.20
Generally, the concentration quenching occurs at higher concentrations of the dopant ions. In concentration quenching, the inter-ionic separation between the Er3+ ions seems to be closer than the critical separation and the excitation energy migrates to the energy killing sites; thereby, a decrease in the UC intensity is observed.20,67 The effect of concentration of Er3+ ion on the UC intensity of the xEr3+/3Yb3+ co-doped ZnGa2O4 phosphors (x = 0.3, 0.5, 0.7, 1.0, 1.5, and 1.8 mol%) is shown in Fig. 8(a–c). It is also clear from the figure that the UC emission intensity of the co-doped phosphor is optimum at 0.7 mol% concentration of the Er3+ ions. The color emitted by the phosphor leads to tune from greenish yellow to yellowish green color with the increase in the concentration of Er3+ ions, which is to be discussed in the following section. These emissions originate due to different excitation processes, such as ground state absorption (GSA), excited state absorption (ESA), energy transfer upconversion (ETU), cooperative energy transfer (CET), cross relaxation (CR), and back energy transfer (EBT). The inset in Fig. 8(a) shows the red to green (R/G) ratio for different concentrations of Er3+ ions. This ratio decreases regularly with increasing concentration and finally saturates at higher concentrations of Er3+ ions. A comparison of color tunability for different concentrations of Er3+ ions have been summarized in Table 1 in terms of CIE coordinates.
| Concentration (mol%) | CIE coordinates (x, y) | Pump power (W) for 0.7Er3+/3Yb3+ phosphor | CIE coordinates (x, y) |
|---|---|---|---|
| 0.7Er | 0.33, 0.62 | 0.30 W | 0.42, 0.41 |
| 0.3Er–Yb | 0.41, 0.55 | 0.50 W | 0.45, 0.51 |
| 0.5Er–Yb | 0.39, 0.58 | 0.70 W | 0.44, 0.53 |
| 0.7Er–Yb | 0.38, 0.59 | 0.90 W | 0.43, 0.54 |
| 1.0Er–Yb | 0.39, 0.57 | 1.10 W | 0.42, 0.55 |
| 1.5Er–Yb | 0.37, 0.60 | 1.30 W | 0.42, 0.56 |
| 1.8Er–Yb | 0.37, 0.60 | 1.50 W | 0.41, 0.57 |
| 0.7Er–Yb–Li | 0.39, 0.58 | 1.70 W | 0.40, 0.57 |
Fig. 9 shows the schematic energy level diagram of Er3+ and Yb3+ ions and the mechanisms involved in the UC emission processes, i.e., GSA, ESA, ETU, CET, CR, and EBT. When the single Er3+ doped ZnGa2O4 phosphor is excited by 980 nm radiation, the Er3+ ions absorb this radiation weakly in the ground level (4I15/2). Due to this, these ions are promoted to the 4I11/2 level of the Er3+ ion and this process is called ground state absorption (GSA). The ions in the 4I11/2 level further absorb another 980 nm photon and are promoted to the 4F7/2 level through excited state absorption (ESA). These ions are further promoted from 4F7/2 to 2P3/2 level via the absorption of another (third) 980 nm photon. On relaxation, these ions populate the 2H11/2, 4S3/2, 4F9/2, and 4I9/2 levels strongly due to non-radiative relaxations.23–28 As a result, they give radiative transitions at 380, 524, 554, (655, 674), and 814 nm wavelengths to different low-lying levels including the ground state (see Fig. 9). The emissions in the near UV and blue regions are not observed clearly as the upper energy levels corresponding to these emissions are weakly populated in the pure phosphor.
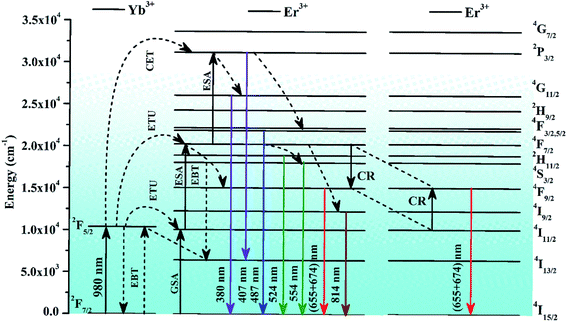 | ||
| Fig. 9 Schematic energy level diagram of Er3+ and Yb3+ ions, and the mechanisms involved in different transitions. | ||
When the Yb3+ ion is doped in the Er3+:ZnGa2O4 phosphor, it transfers its excitation energy to Er3+ ions through ETU (energy transfer upconversion) and CET (cooperative energy transfer) processes (see Fig. 9). It leads to the populations of ions in some of those energy levels in which the population was not achieved considerably, as was discussed in the pure case. Actually, when the Er3+/Yb3+ co-doped ZnGa2O4 phosphor is excited with 980 nm radiation, the Yb3+ ions are promoted from the ground (2F7/2) level to the excited (2F5/2) level through GSA. The ions in the 2F5/2 level relax to the ground level non-radiatively and transfer their excitation energy to different energy levels of the Er3+ ion, i.e., 4I11/2, 4F7/2, and 2P3/2 levels due to energy transfer upconversion (ETU) process. There is also an energy transfer from Yb3+ to Er3+ ions in the 4F7/2 level through cooperative energy transfer (CET) process. The ions in this level are further promoted to the 2P3/2 level through ESA. Finally, the 4G11/2 and 4F5/2 levels are populated via non-radiative relaxations alongwith other low-lying levels.7 The ions in 2P3/2, 4G11/2, and 4F5/2 levels produce radiative transitions at different wavelengths, such as 381, 407, and 487 nm, respectively. These transitions appear very weakly in the Er3+ doped phosphor (see Fig. 7). The Er3+/Yb3+ co-doped phosphor also gives radiative emissions at 524, 554, (655, 674), and 814 nm wavelengths upon 980 nm excitation.28
On the other hand, the intense red UC emission occurs due to energy back transfer (EBT) and cross relaxation (CR) between Er3+ and Yb3+ ions.30,32,34 In the EBT process, the energy transfer takes place from 4S3/2 to 4I13/2 levels of the Er3+ ions and 2F7/2 to 2F5/2 levels of the Yb3+ ions as Er3+ (4S3/2) + Yb3+ (2F7/2) → Er3+ (4I13/2) + Yb3+ (2F5/2). It populates the 2F5/2 level of the Yb3+ ion followed by depopulation of the 4S3/2 level of Er3+ ion. Once the population in the 4S3/2 level is reduced, the intensity of green emission at 554 nm decreases considerably. There is another reason for the decrease in the green emission intensity, which is due to cross relaxation (CR) process.30,68 It is well known that the energy separation between 4F7/2 and 4F9/2 levels of Er3+ ion is 5200 cm−1 while that between 4I11/2 and 4F9/2 levels is 5100 cm−1. This energy separation can easily generate CR between these levels. This promotes the large population of Er3+ ions in the 4F9/2 level as Er3+ (4F7/2) + Er3+ (4I11/2) → Er3+ (4F9/2) + Er3+ (4F9/2). As a result, a relatively larger intensity of red emission is observed compared to the green emission and it varies with the increase in the concentration of Er3+ ions.
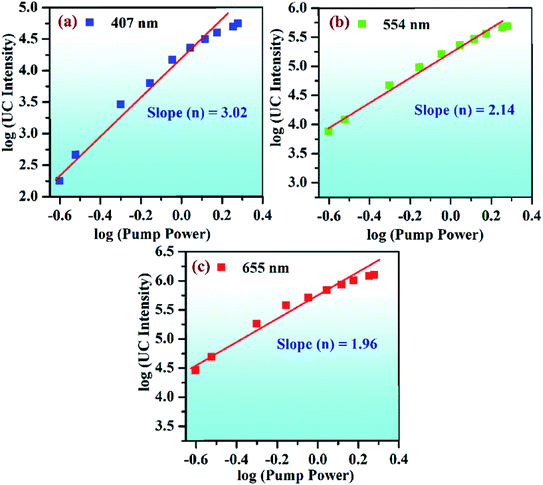
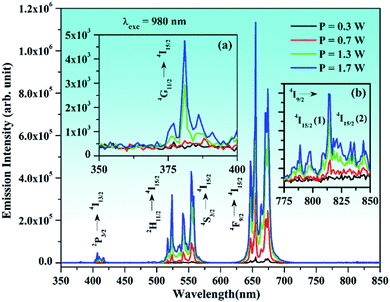
The UC emission intensity of the Er3+/Yb3+ co-doped phosphor was monitored at different pump powers, i.e., 0.3, 0.7, 1.3, and 1.7 W, and they are shown in Fig. 11. This facilitates to see the effect of incident pump powers on the UC emission intensity of the co-doped phosphor. It is clear from the figure that the UC emission intensity of 0.7Er3+/3Yb3+ co-doped phosphor increases continuously on increasing the pump power of NIR radiation (i.e., 980 nm). Initially, at 0.3 W pump power, the emissions in the near UV-blue and NIR regions are not observed. However, these emissions can be seen clearly when the pump power is increased to 0.7 W. The emission intensity is further increased at higher pump powers, i.e., 1.3 and 1.7 W.25,67 This is due to the fact that at lower pump power, the upper lying excited levels are not populated, while the population of the ions is effectively established in these levels at higher pump power.
Fig. 11(a) shows that emission in the near UV region begins to appear at higher pump powers (i.e., 1.7 W) as the upper lying energy levels are populated. However, in the NIR region, it arises even at relatively lower pump power (see Fig. 11(b)). The low-lying energy levels are generally populated even at lower pump power and give NIR emissions.
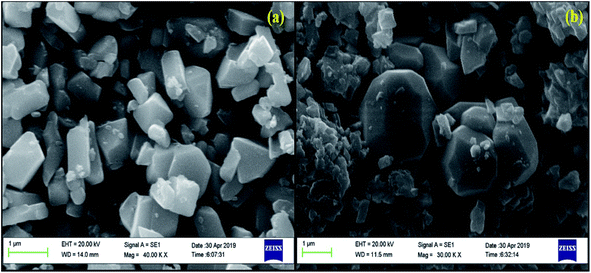
As was mentioned earlier, the addition of some surface modifiers greatly affects the intensity of different phosphor materials, e.g., Li+, Mn2+, Mg2+, Zn2+, Ce3+, and Bi3+.37–41 It has been observed earlier that they enhance the intensity of the materials by modifying the local crystal field around the activator ions.6,69 The modification in the local crystal field is achieved when larger ionic radii ion is incorporated at the sites of smaller ionic radii ion. It is expected that the incorporation of the larger sized ion creates an expansion in the crystal lattice parameters and thereby improves the intensity of the phosphor materials.5 A similar result has been obtained in our case in which the Li+ ion with larger ionic radii is substituted at the site of the Ga3+ ion in the host lattice. This reduces the FWHM of the XRD peaks, which confirms an increase in the crystallinity of the phosphor samples. The SEM micrographs also reveal an increase in the particle size in the presence of Li+ ions. These factors contributed significantly in enhancing the UC emission intensity.
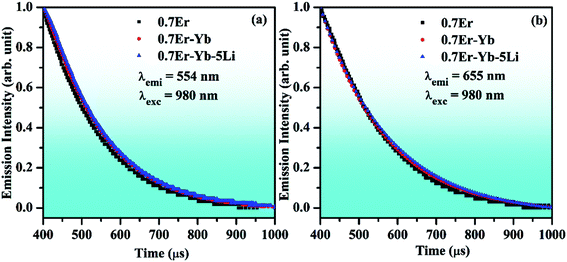
The incorporation of Li+ ions increases the absorption of vibrational bands of the host lattice. This indicates that the local crystal field has less surface defects.31 This was also confirmed from the XRD analysis, as the crystal structure becomes more crystalline in the presence of Li+ ions. It was also analyzed from the UV-vis-NIR spectra that the emission intensity of the NIR band is enhanced significantly in the presence of Li+ ions. It is also interesting to notice that the optical band gap of the phosphor is slightly reduced via Li+ doping. On the other hand, the lifetime of the emitting levels is increased considerably in the presence of Li+ ions.6 Chen et al. have studied the effect of Li+ ions in the red UC emission intensity of Er3+ ion and found manifold enhancement due to an increase in the crystallinity of the phosphor.44 The effect of the addition of Li+ ions was also studied by Huerta et al.; they found an increase in the red UC emission intensity, which occurs due to increase in the crystallinity of the phosphor.70 Liu et al. have also observed an intense red color due to energy back transfer and cross relaxation processes. They have obtained larger intensity in the presence of F− ion.71 The enhancement was also observed due to an increase in the crystallinity of the phosphor via F− doping. In our case, the increase in crystallinity and particle size, enhancement in absorption and reduction in optical band gap collectively improve the population of the excited ions in different higher energy levels, which results in an enhancement in the red UC emission intensity of the phosphor more than two times. Fig. 12(b) and (c) shows that the UC emission intensity of the phosphor was improved significantly in the near UV-blue and NIR regions in the presence of Li+ ions.
The CIE (Commission International de l'Eclairage) coordinates are a suitable way to specify the emitted color, which involve x and y parameters specifying the hue and saturation natures in two dimensions. The obtained CIE coordinates are indicated in the chromaticity diagram. Fig. 13(a) and (b) show the CIE diagrams of xEr3+/3Yb3+/5Li+ with different concentrations (i.e., x = 0.3, 0.5, 0.7, 1.0, 1.5, & 1.8 mol%) and that of 0.7Er3+/3Yb3+ co-doped ZnGa2O4 phosphors at different pump powers (i.e., 0.3, 0.5, 0.7, 0.9, 1.10, 1.30, 1.50, and 1.70 W) of the 980 nm excitation source. The color co-ordinates lie in the green region for the 0.7Er3+ doped phosphor; however, the emitted color of the 0.3Er3+/3Yb3+, 0.5Er3+/3Yb3+, 0.7Er3+/3Yb3+, 1.0Er3+/3Yb3+, 1.5Er3+/3Yb3+, and 1.8Er3+/3Yb3+ co-doped phosphors changes from yellow to greenish yellow regions. It suggests that the color of the phosphor is tunable on increasing the concentration of the Er3+ ion.34 The CIE coordinates thus calculated are summarized in Table 1 in which the CIE coordinates alter from (0.33, 0.62) to (0.37, 0.60). The table also confirms that the xEr3+/3Yb3+ co-doped phosphors show efficient color tunability with the concentration of the Er3+ ion. It is also interesting to note from Fig. 13(b) that color tunability is not only observed due to variation in the concentration of Er3+ ion but also on changing the incident pump powers of the 980 nm excitation source in the case of 0.7Er3+/3Yb3+ co-doped phosphor. As the pump power is increased, the color emitted by the phosphor was tuned from red to yellowish green color followed by yellow color. The color tunability was also observed by Gao et al. in the Er3+ doped compound as a function of different pump powers.35 Accordingly, the CIE coordinates of the phosphor are shifted from (0.42, 0.41) to (0.40, 0.57). The calculated CIE coordinates for different pump powers are further given in Table 1. Thus, the fine color tunability has been achieved due to variation in the Er3+ ion concentrations and pump powers in the Er3+/Yb3+ co-doped phosphor.
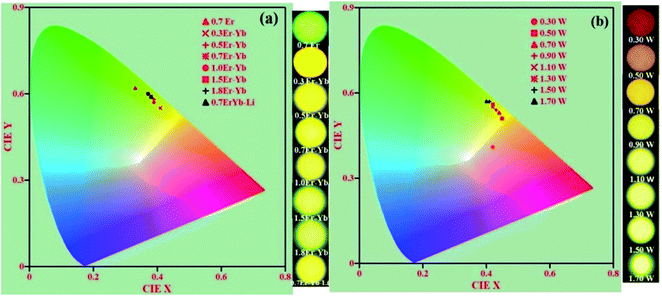 | ||
| Fig. 13 CIE diagrams of the Er3+/Yb3+/Li+ co-doped ZnGa2O4 phosphors with the variation in (a) concentrations of the Er3+ ions and (b) incident pump powers of the 980 nm radiation. | ||
The correlated color temperature (CCT) has been calculated by using McCAMY's formula via taking the values of CIE coordinates. The CCT relation is given as:72
| CCT = 449n3 + 3525n2 + 6823.3n + 5520.33 | (ii) |
| I = I0 exp(−t|τ) | (iii) |
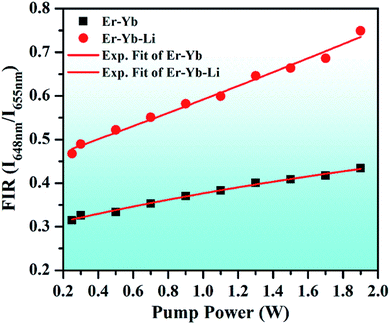 | ||
| Fig. 15 Variation of FIR (I648nm/I655nm) versus incident pump powers for the 0.7Er3+/Yb3+ and 0.7Er3+/Yb3+/Li+ co-doped ZnGa2O4 phosphors upon 980 nm excitation. | ||
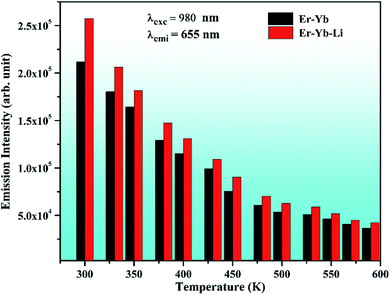
Actually, the red emission of the Er3+ ion has Stark components at 648 and 655 nm wavelengths. They are well separated by an energy gap of 165 cm−1 and can be used as TCLs (i.e., 4F9/2(I) and 4F9/2(II) levels). At lower pump power, the UC emission intensity of the 655 nm emission band is larger than that of the 648 nm emission band. Initially, the population of the excited ions is larger in the 4F9/2(II) level compared to the 4F9/2(I) level. This is responsible for larger UC intensity of the 655 nm emission band. When the incident pump power is further increased, the population of some of the ions is shifted towards the 4F9/2(I) level. This induces a variation in the UC emission intensities for the 648 and 655 nm wavelengths in both the cases. This gives rise to FIR (I648nm/I655nm), which increases exponentially with the increase in pump power. The 0.7Er3+/Yb3+/Li+ co-doped phosphor shows increasing FIR values even at higher pump powers. Thus, these phosphors may be used for fabricating optical heating devices.
 | (iv) |
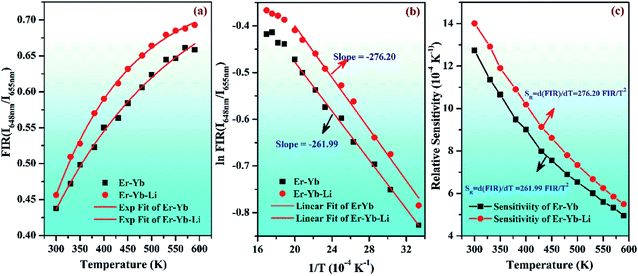
Fig. 17(b) shows a plot between log(FIR) and T−1 of red UC emission intensity in the range of 300–600 K for the 0.7Er3+/3Yb3+ and 0.7Er3+/3Yb3+/5Li+ co-doped ZnGa2O4 phosphors. The experimental data are found to vary non-linearly. The plot between logarithmic of FIR versus inverse of absolute temperature (T−1) was assumed to calculate the slope values and they were found to be 261.99 and 276.20 for the 0.7Er3+/3Yb3+ and 0.7Er3+/3Yb3+/5Li+ co-doped phosphors, respectively. The energy band gap (ΔE) has been evaluated by multiplying the slope values with k = 0.695 cm−1 K−1 and their values are found to be 182.08 and 191.96 cm−1 for the 0.7Er3+/3Yb3+ and 0.7Er3+/3Yb3+/5Li+ co-doped phosphors, respectively.
The values of the relative sensitivity (SR) and absolute sensitivity (SA) can be calculated with the help of following relations:
 | (v) |
 | (vi) |
In these relations, all the terms have their usual meanings. The terms, SR and SA are dependent on ΔEf. The calculated relative sensitivity (SR) as a function of different temperatures is shown in Fig. 17(c). The rate of change of FIR as a function of temperature is termed as sensitivity. The relative sensitivity decreases continuously with increasing the temperature within the measured temperature range, i.e., 300–600 K. The figure also shows that the relative sensitivity (SR) is maximum at 300 K in both the cases and their values are found to be 0.00127 and 0.00140 K−1 for the 0.7Er3+/Yb3+ and 0.7Er3+/Yb3+/Li+ co-doped ZnGa2O4 phosphors, respectively. Wang et al. have also obtained larger value of temperature sensing sensitivity in the Er3+/Yb3+ co-doped phosphor via doping of Ho3+ and Tm3+ ions.73 The absolute sensitivity (SA) has also been calculated using relation (vi) for the 0.7Er3+/Yb3+ and 0.7Er3+/Yb3+/Li+ co-doped ZnGa2O4 phosphors and their values were obtained as 0.00291 and 0.00307 K−1, respectively. Thus, the Li+ ion improves the value of relative sensitivity (SR) and absolute sensitivity (SA) in the 0.7Er3+/Yb3+ co-doped phosphor. The relative sensitivity obtained in our case has been compared with reported sensitivities by other values and they are summarized in Table 2. The table also reveals that the relative sensitivity observed in our case is very close to the value reported by others.
| Rare earths | Host | Temperature | Relative sensitivity (SR) (K−1) at temp. (K) | Ref. |
|---|---|---|---|---|
| Er3+, Yb3+ | BaMoO4 | 200–300 | 0.0015 (463) | 27 |
| Er3+, Yb3+ | Ba5Gd8Zn4O21 | 200–490 | 0.0031 (200) | 34 |
| Er3+, Yb3+, Eu3+ | Y2O3 | 301–403 | 0.0008 (427) | 74 |
| Er3+, Yb3+, Nd3+ | Y2SiO5 | 298–753 | 0.00095 (403) | 75 |
| Er3+, Yb3+ | ZnGa2O4 | 300–600 | 0.00127 (300) | Present work |
| Er3+, Yb3+, Li+ | ZnGa2O4 | 300–600 | 0.00140 (300) | Present work |
The term (ΔEf) is the fitting energy difference between the two TCLs. The error (δ) with respect to the actual experimental energy difference (ΔEm) gives an insight of its agreement with the fitting energy difference (ΔEf). The error (δ) can be expressed by the following relation:14
 | (vii) |
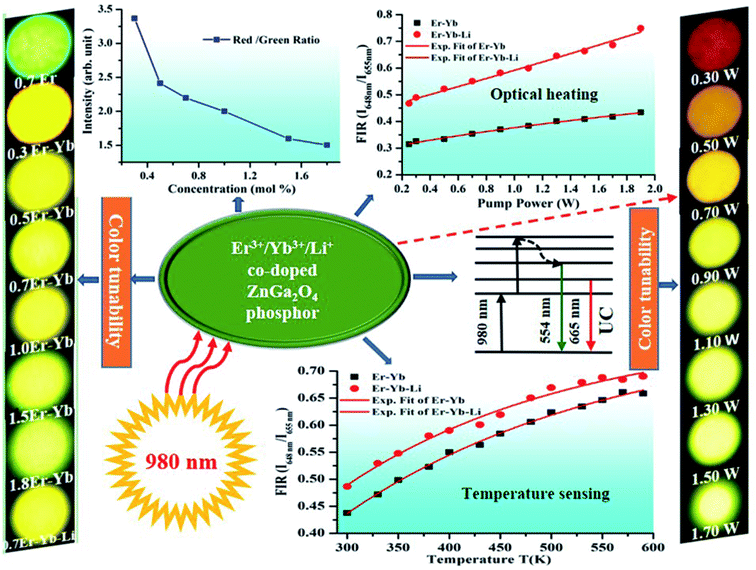
We have summarized the whole mechanisms by using a schematic model and it is shown in Fig. 18. The figure shows not only the color tunability with different concentrations and pump powers but also the red to green ratio for different concentrations of Er3+ ions, induced optical heating, and temperature sensing characteristics. This figure also shows the energy level diagram representing the upconversion (UC) emissions in green and red regions upon 980 nm excitation.
4. Conclusions
Upconversion luminescence has been studied in the Er3+/Yb3+/Li+ co-doped ZnGa2O4 phosphor. The structural characterization shows a better crystallinity in the presence of Li+ ions. The absorption spectra show a large number of peaks due to Er3+ and Yb3+ ions. The Er3+/Yb3+ co-doped phosphor gives an intense red UC emission on excitation with 980 nm. The luminescence intensity versus pump power dependent plot proves the requirement of two photons for this emission. The phosphor also shows color tunability due to change in Er3+ ion concentration and incident pump power. The presence of Li+ ions in the Er3+/Yb3+ co-doped phosphor enhances the UC emission intensity more than two times. The lifetime of the levels of Er3+ ions is also increased in the presence of Li+ ions. The enhancement in the intensity is due to an increase in the crystallinity and particles size of the phosphor. The pump power induced FIR results in better optical heating in the phosphors. The Er3+/Yb3+ and Er3+/Yb3+/Li+ co-doped ZnGa2O4 phosphors show efficient temperature sensing sensitivity and the sensitivity is as high as 14 × 10−4 K−1 in the presence of Li+ ions. Thus, the Er3+/Yb3+/Li+ co-doped ZnGa2O4 phosphor may be used in photonic, optical heating, and temperature sensing devices.Conflicts of interest
The authors declare that there is no conflict of interest in the present study.Acknowledgements
Ms Monika wishes to acknowledge Council of Scientific & Industrial Research (CSIR), India for financial assistance as Junior Research Fellow (Grant No. 09/013(0826)/2018-EMR-I). Dr A. Bahadur is thankful to DST-SERB, India for providing funds under the scheme “Empowerment and Equity Opportunities for Excellence in Science (File no. EEQ/2017/000757).References
- Q. Qiang and Y. Wang, New J. Chem., 2019, 43, 5011–5019 RSC.
- R. S. Yadav, S. J. Dhoble and S. B. Rai, Sens. Actuators, B, 2018, 273, 1425–1434 CrossRef CAS.
- X. Wang, Y. Wang, Y. Bu, X. Yan, J. Wang, P. Cai and H. J. Seo, Sci. Rep., 2017, 7, 43383 CrossRef PubMed.
- N. Rakov and G. S. Maciel, Sens. Actuators, B, 2012, 164, 96–100 CrossRef CAS.
- R. S. Yadav and S. B. Rai, J. Alloys Compd., 2017, 700, 228–237 CrossRef CAS.
- R. S. Yadav, R. V. Yadav, A. Bahadur and S. B. Rai, RSC Adv., 2016, 6, 51768–51776 RSC.
- R. S. Yadav, S. J. Dhoble and S. B. Rai, New J. Chem., 2018, 42, 7272–7282 RSC.
- S. P. Tiwari, S. K. Maurya, R. S. Yadav, A. Kumar, V. Kumar, M. F. Joubert and H. C. Swart, J. Vac. Sci. Technol., B: Nanotechnol. Microelectron.: Mater., Process., Meas., Phenom., 2018, 36, 060801 Search PubMed.
- S. Ye, F. Xiao, Y. X. Pan, Y. Y. Ma and Q. Y. Zhang, Mater. Sci. Eng., R, 2010, 71, 1–34 CrossRef.
- H. Dong, L. D. Sun and C. H. Yan, Chem. Soc. Rev., 2015, 44, 1608–1634 RSC.
- J. Xue, X. Wang, J. H. Jeong and X. Ya, Phys. Chem. Chem. Phys., 2018, 20, 11516–11541 RSC.
- M. Mondal, V. K. Rai and C. Srivastava, Chem. Eng. J., 2017, 327, 838–848 CrossRef CAS.
- P. Du, L. H. Luo, H. K. Park and J. S. Yu, Chem. Eng. J., 2016, 306, 840–848 CrossRef CAS.
- X. Wang, Q. Liu, Y. Bu, C. S. Liu, T. Liu and X. Yan, RSC Adv., 2015, 5, 86219–86236 RSC.
- S. Dong, J. Xu, T. Jia, M. Xu, C. Zhong, G. Yang, J. Li, D. Yang, F. He, S. Gai, P. Yang and J. Lin, Chem. Sci., 2019, 10, 4259–4271 RSC.
- Y. Zhang, S. Xu, X. Li, J. Zhang, J. Sun, H. Xia, R. Hua and B. Chen, Opt. Mater. Express, 2018, 8, 368–384 CrossRef CAS.
- R. S. Yadav, R. K. Verma, A. Bahadur and S. B. Rai, Spectrochim. Acta, Part A, 2015, 142, 324–330 CrossRef CAS PubMed.
- J. Zhou, Y. Sun, X. Du, L. Xiong, H. Hu and F. Li, Biomaterials, 2010, 31, 3287–3295 CrossRef CAS PubMed.
- X. Ai, C. J. H. Ho, J. Aw, A. B. E. Attia, J. Mu, Yu. Wang, X. Wang, Y. Wang, X. Liu, H. Chen, M. Gao, X. Chen, E. K. L. Yeow, G. Liu, M. Olivo and B. Xing, Nat. Commun., 2016, 7, 10432 CrossRef CAS PubMed.
- R. S. Yadav, R. K. Verma and S. B. Rai, J. Phys. D: Appl. Phys., 2013, 46, 275101 CrossRef.
- R. S. Yadav, R. K. Verma, A. Bahadur and S. B. Rai, Spectrochim. Acta, Part A, 2015, 137, 357–362 CrossRef CAS PubMed.
- R. S. Yadav and S. B. Rai, J. Lumin., 2017, 190, 171–178 CrossRef CAS.
- H. Wang, X. Yin, M. Xing, Y. Fu, Y. Tian, X. Feng, T. Jiang and X. Luo, J. Am. Ceram. Soc., 2018, 101, 865–873 CrossRef CAS.
- K. Pavani, J. Suresh Kumar, K. Srikanth, M. J. Soares, E. Pereira, A. J. Neves and M. P. F. Graça, Sci. Rep., 2017, 7, 17646 CrossRef CAS PubMed.
- G. Zhang, Q. Qiang, S. Du and Y. Wang, RSC Adv., 2018, 8, 9512–9518 RSC.
- Z. Wang, H. Jiao and Z. Fu, Inorg. Chem., 2018, 57, 8841–8849 CrossRef CAS PubMed.
- N. H. Belkhir, A. Toncelli, A. K. Parchur, E. Alvesc and R. Maalej, Sens. Actuators, B, 2017, 248, 769–776 CrossRef.
- R. S. Yadav, D. Kumar, A. K. Singh, E. Rai and S. B. Rai, RSC Adv., 2018, 8, 34699–34711 RSC.
- D. R. Kim, S. W. Park, B. K. Moon, S. H. Park, J. H. Jeong, H. Choi and J. H. Kim, RSC Adv., 2017, 7, 1464–1470 RSC.
- C. Mi, J. Wu, Y. Yang, B. Han and J. Wei, Sci. Rep., 2016, 6, 22545 CrossRef CAS PubMed.
- A. Maurya, R. S. Yadav, R. V. Yadav, A. Bahadur and S. B. Rai, RSC Adv., 2016, 6, 113469–113477 RSC.
- J. Zhang, Z. Hao, J. Li, X. Zhang, Y. Luo and G. Pan, Light: Sci. Appl., 2015, 4, e239 CrossRef CAS.
- Q. Xiao, Y. Zhang, H. Zhang, G. Dong, J. Han and J. Qiu, Sci. Rep., 2016, 6, 31327 CrossRef CAS PubMed.
- H. Suo, C. Guo and T. Li, J. Phys. Chem. C, 2016, 120, 2914–2924 CrossRef CAS.
- D. Gao, X. Zhang, Q. Pang, J. Zhao, G. Xiao and D. Tian, J. Mater. Chem. C, 2018, 6, 8011–8019 RSC.
- Y. Cheng, K. Sun and P. Ge, Optik, 2018, 170, 1–9 CrossRef CAS.
- J. H. Chung, J. H. Ryu, J. W. Eun, J. H. Lee, S. Y. Lee, T. H. Heo and K. B. Shim, Mater. Chem. Phys., 2012, 134, 695–699 CrossRef CAS.
- X. Gao, X. Liu, Q. Wen, X. Yang and S. Xiao, J. Appl. Phys., 2014, 116, 173105 CrossRef.
- L. Jiang, S. Xiao, X. Yang, J. Ding and K. Dong, Appl. Phys. B, 2012, 107, 477–481 CrossRef CAS.
- V. Singh, V. K. Rai, I.-J. Lee, I. Ledoux-Rak, K. Al-Shamery, J. Nordmann and M. Haase, Appl. Phys. B, 2012, 106, 223–228 CrossRef CAS.
- I. Kamińska, et al., RSC Adv., 2015, 5, 78361–78373 RSC.
- W. Yin, L. Zhao, L. Zhou, Z. Gu, X. Liu, G. Tian, S. Jin, L. Yan, W. Ren, G. Xing and Y. Zhao, Chem.–Eur. J., 2012, 18, 9239–9245 CrossRef CAS PubMed.
- D.-H. Kim, J. H. Ryu, J. H. Chung, K. B. Shim and S.-Y. Cho, J. Electrochem. Soc., 2011, 158, J345–J348 CrossRef CAS.
- Z. Chen, T. Chen, W. Gong, W. Xu, D. Wang and Q. Wang, J. Am. Ceram. Soc., 2013, 96, 1857–1862 CrossRef CAS.
- G. Chen, H. Liu, H. Liang, G. Somesfalean and Z. Zhang, J. Phys. Chem. C, 2008, 112, 12030–12036 CrossRef CAS.
- Y. Ding, X. Zhang, H. Gao, S. Xu, C. Wei and Y. Zhao, J. Alloys Compd., 2014, 599, 60–64 CrossRef CAS.
- C. Zhao, X. Kong, X. Liu, L. Tu, F. Wu, Y. Zhang, K. Liu, Q. Zeng and H. Zhang, Nanoscale, 2013, 5, 8084–8089 RSC.
- Y. Cheng, K. Sun and P. Ge, Opt. Mater., 2018, 83, 13–18 CrossRef CAS.
- M. Puddu, G. Mikutis, W. J. Stark and R. N. Grass, Small, 2016, 12, 452–456 CrossRef CAS PubMed.
- C. D. S. Brites, X. Xie, M. L. Debasu, X. Qin, R. Chen, W. Huang, J. Rocha, X. Liu and L. D. Carlos, Nat. Nanotechnol., 2016, 11, 851–856 CrossRef CAS PubMed.
- Y. Gao, F. Huang, H. Lin, J. Zhou, J. Xu and Y. Wang, Adv. Funct. Mater., 2016, 26, 3139–3145 CrossRef CAS.
- P. Cai, X. Wang and H. J. Seo, Phys. Chem. Chem. Phys., 2018, 20, 2028–2035 RSC.
- C. R. Garcia, J. Oliva, L. A. Diaz-Torres, E. Montes, G. Hirata, J. Bernal-Alvarado and C. Gomez-Solis, Ceram. Int., 2019, 45, 4972–4979 CrossRef CAS.
- J.-H. Lee, H.-J. Park, K. Yoo, B.-W. Kim, J. C. Lee and S. Park, J. Eur. Ceram. Soc., 2007, 27, 965–968 CrossRef CAS.
- W. Yang, J. Li, B. Liu, X. Zhang, C. Zhang, P. Niu and X. Jiang, Nanoscale, 2018, 10, 19039–19045 RSC.
- L. Zou, X. Xiang, M. Wei, F. Li and D. G. Evans, Inorg. Chem., 2008, 47(4), 1361–1369 CrossRef CAS PubMed.
- K.-H. Hsu, M.-R. Yang and K.-S. Chen, J. Mater. Sci., 1998, 9, 283–288 CAS.
- S.-H. Choe and M.-S. Jin, J. Korean Phys. Soc., 2008, 53, 3474–3478 CrossRef CAS.
- M. Vasile, P. Vlazan and N. M. Avram, J. Alloys Compd., 2010, 500, 185–189 CrossRef CAS.
- M. Vasile, P. Vlazan, P. Sfirloaga, I. Grozescu, N. M. Avram and E. Rusu, Phys. Scr., 2009, 135, 014046 CrossRef.
- M. Vasile, P. Vlazan, I. Grozescu and N. Avram, Optoelectron. Adv. Mater., Rapid Commun., 2009, 3, 1371–1374 CAS.
- Y. He, M. Zhao, Y. Song, G. Zhao and X. Ai, J. Lumin., 2011, 131, 1144–1148 CrossRef CAS.
- R. S. Yadav, R. V. Yadav, A. Bahadur, T. P. Yadav and S. B. Rai, Mater. Res. Express, 2016, 3, 036201 CrossRef.
- X. Wang, Y. Wang, J. Yu, Y. Bu and X. Yan, Opt. Express, 2018, 26, 21950–21959 CrossRef CAS PubMed.
- R. S. Yadav, Monika, E. Rai, L. P. Purohit and S. B. Rai, J. Lumin., 2020, 217, 116810 CrossRef.
- D. L. Wood and J. Tauc, Phys. Rev. B: Solid State, 1972, 5, 3144–3151 CrossRef.
- Y. Zhang, H. Li, L. Shao, Z. Htwe and P. Yuan, Opt. Mater. Express, 2017, 7, 3003–3010 CrossRef.
- W. Wei, Y. Zhang, R. Chen, J. Goggi, N. Ren, L. Huang, K. K. Bhakoo, H. Sun and T. T. Y. Tan, Chem. Mater., 2014, 26, 5183–5186 CrossRef CAS.
- D. Li, W. Qin, P. Zhang, L. Wang, M. Lan and P. Shi, Opt. Mater. Express, 2017, 7, 329–340 CrossRef CAS.
- E. F. Huerta, S. Carmona-Tellez, S. Gallardo-Hernandez, J. G. Cabanas-Moreno and C. Falcony, ECS J. Solid State Sci. Technol., 2016, 5, R129–R135 CrossRef CAS.
- S. Liu, S. Liu, M. Zhou, X. Ye, D. Hou and W. You, RSC Adv., 2017, 7, 36935–36948 RSC.
- M. Rai, G. Kaur, S. K. Singh and S. B. Rai, Dalton Trans., 2015, 44, 6184–6192 RSC.
- X. Wang, Y. Wang, J. M. Hueso and X. Yan, Sci. Rep., 2017, 7, 758 CrossRef PubMed.
- R. Dey, A. Pandey and V. K. Rai, Sens. Actuators, B, 2014, 190, 512–515 CrossRef CAS.
- N. Rakov and G. S. Maciel, Opt. Lett., 2014, 39, 3767–3769 CrossRef CAS PubMed.
| This journal is © The Royal Society of Chemistry 2019 |

