 Open Access Article
A new ratiometric fluorescence assay based on resonance energy transfer between biomass quantum dots and organic dye for the detection of sulfur dioxide derivatives†
Jingjin Zhao‡
 ab,
Yao Peng‡a,
Keqin Yanga,
Yunyun Chena,
Shulin Zhao
 *a and
Yi-Ming Liu
 *b
*b
aState Key Laboratory for the Chemistry and Molecular Engineering of Medicinal Resources, Guangxi Normal University, Guilin, 541004, China. E-mail: zhaoshulin001@163.com
bDepartment of Chemistry and Biochemistry, Jackson State University, 1400 Lynch St., Jackson, MS 39217, USA. E-mail: yiming.liu@msjsu.edu
First published on 17th December 2019
Abstract
Sulfur dioxide (SO2) is considered as the fourth gas signal molecule after nitric oxide (NO), carbon monoxide (CO) and hydrogen sulfide (H2S). It plays important roles in several physiological processes. Therefore, the design and synthesis of nanoprobes for the detection of SO2 derivatives in cells is of great significance. Herein, we report a new ratiometric fluorescence nanoprobe based on resonance energy transfer (RET) between biomass quantum dots (BQDs) and organic dye (DMI) for the detection of SO2 derivatives. The proposed ratiometric fluorescence assay allows the determination of HSO3− in the range of 1.0 to 225 μM with a detection limit of 0.5 μM. Importantly, the proposed ratiometric fluorescence nanoprobe exhibits a high photostability and good selectivity for HSO3− over other chemical species including H2S and biological mercaptans. Quantitation of HSO3− in cell lysates by using the nanoprobe is demonstrated.
1. Introduction
Sulfur dioxide (SO2) is an irritant gas and a major atmospheric pollutant. It is usually in the form of SO32− and HSO3− in solution.1,2 In vivo, SO2 is considered as the fourth gas signal molecule after nitric oxide (NO), carbon monoxide (CO) and hydrogen sulfide (H2S).3 SO2 can be produced in cytoplasm and mitochondria by enzymatic catalysis of sulfur-containing amino acids and oxidation of H2S.4 Endogenous SO2 has unique biological activity and plays an important role in a series of physiological and pathological processes, such as improving antioxidant capacity, regulating vascular structure and function, etc.5,6 On the other hand, studies have shown that abnormal production of endogenous SO2 derivatives is associated with certain diseases such as neurological disorders7 and lung cancer.8 Therefore, the development of analytical methods with good repeatability and sensitivity for the detection of SO2 derivatives in cells is of great significance.Current methods for the detection of HSO3− (a major form of SO2 existing in living systems) include electrochemical detection method,9 high performance liquid chromatography (HPLC),10 capillary electrophoresis,11 etc. These methods have limitations such as poor reproducibility, un-satisfactory assay sensitivity, or cumbersome operation. In recent years, fluorescence based methods have received attention due to their high sensitivity, good selectivity, and short analysis time. Several fluorescent probes for HSO3− detection were developed based on nucleophilic reactions with aldehydes, levulinic acid cracking and coordination interactions.12–18 However, these fluorescent probes are susceptible to interference from endogenous compounds such as biological mercaptans, proteases and esterases. In addition, it's well known that fluorescence assays based on changes in single-wavelength fluorescence intensity (increase or decrease) are affected by probe concentration, instrument stability, and background interference of the test system.19–21
Ratiometric fluorescence assay is more accurate than single-wavelength fluorescence intensity detection because it eliminates most of the interference caused by light bleaching, instrument instability, and sample matrix background by self-calibration on two emission bands. In recent years, many ratio fluorescence probes were developed for SO2 assay.22–31 However, most of these probes were designed based on the mechanism of intramolecular charge transfer (ICT). Such probes have shortcomings such as low fluorescence resolution, and being susceptible to the influence from other biological mercaptan. On the other hand, these organic small molecular fluorescent probes are prone to photobleaching when exposed to light, so their optical stability is not very good. Therefore, it is highly significant to develop stable, sensitive and specific ratiometric fluorescence assay for SO2 derivatives.
Biomass quantum dots (BQDs) are fluorescent carbon based nanomaterials prepared from biomass. They are easy to be prepared, easy to be functionalized, with good photostability, low cytotoxicity and good biocompatibility. Moreover, BQDs with different optical properties can be prepared from different biomass.32–34 In this work, we prepared a BQDs with green fluorescence emission from corn, and developed a ratiometric fluorescence assay based on resonance energy transfer (RET) between BQDs and organic dye for the detection of sulfur dioxide derivatives (HSO3−). The principle of the assay is outlined in Scheme 1. BQDs were prepared from corn by one-step hydrothermal method, and (E)-2-(4-(dimethylamino) styrene)-1,3,3-trimethyl-3H-indole-1-iodide (DMI) was synthesized by two-step nucleophilic reaction. Both BQDs and DMI obtained showed the fluorescence with maximum emission wavelengths at 518 nm and 595 nm, respectively. DMI had maximum absorption at 549 nm, which was overlapped with the emission spectrum of BQDs. When the two co-exist, fluorescence resonance energy transfer (FRET) occur, which results in the fluorescence intensity of BQDs at 518 nm decreases while that of DMI at 595 nm increases. In the presence of HSO3−, absorption of DMI at 549 nm is reduced because HSO3− reacts with DMI breaking up the conjugation of the double bonds in DMI, thus diminishing FRET efficiency. As a result, fluorescence emission by DMI is decreased at 595 nm, while fluorescence of BQDs is enhanced at 518 nm. Fluorescence intensity ratio of the system at 518 nm and 595 nm (F518/F595) is linearly proportional to the concentration of HSO3− within a certain range. Based on this working principle, a new ratiometric fluorescence method for HSO3− detection can be established.
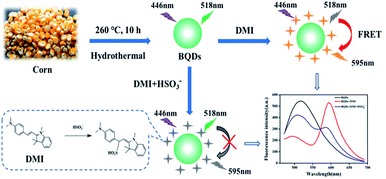 | ||
| Scheme 1 Schematic illustration of the proposed ratiometric fluorescence assay based on FRET between BQDs and organic dye (DMI) for the detection of SO2 derivatives. | ||
2. Experimental section
2.1 Materials and reagents
Corn was bought from a local vegetable market (Guilin, China). 2,3,3-trimethyl-3H-indole, 4-diaminobenzaldehyde, acetonitrile, anhydrous ethanol, iodine methane, NaNO2, KBr, NaCl, KI, Na2HPO4, NaNO3, NaHCO3, Na2CO3, Na2S, CH3COONa, cystine (Cys), glutathione (GSH), H2O2, ascorbic acid (AA) and NaHSO3 were purchased from Aladdin reagent company (Shanghai, China). Dulbecco's Modified Eagle Medium (DMEM) was purchased from Thermo Fisher instrument Co., Ltd. (Suzhou, China). Trypsin digestive fluid, fetal bovine serum (FBS), dimethyl sulfoxide (DMSO) and penicillin–streptomycin were purchased from Sigma-Aldrich Company (Saint Louis, MO, USA). The cell lines used in the study: HepG2, MCF-7 and 7702 were purchased from the Cell Bank of the typical Culture Storage Committee of the Chinese Academy of Sciences/Cell Resource Center of the Shanghai Institute of Life Sciences of the Chinese Academy of Sciences (Shanghai, China). Dialysis bag (MWCO = 1 kD, pore size: ca.1.0 nm) purchased from Shengong Bioengineering Co., Ltd. (Shanghai, China). All the other chemical reagents in the experiment were analysis pure, and the water used in the experiment was 18.2 MΩ cm ultrapure water.2.2 Apparatus
The Cary Eclipse fluorescence spectrometer (Agilent Technologies, Santa Clara, CA, USA) was used for recording the fluorescence spectrum. The Cary-60 UV-vis spectrophotometer (Agilent Technologies) was used for recording the UV-vis absorption spectrum. The PerkinElmer Fourier transform infrared (FTIR) spectrometer (PerkinElmer Inc./Thermo Fisher Scientific, Waltham, MA, USA) was used for characterization of the BQDs surface groups. The Rigaku X-ray powder diffractometer (Rigaku Corp., Tokyo, Japan) was used for X-ray diffraction (XRD) analysis. The Philips transmission electron microscope (Philips, Eindhoven, Netherlands) was used to characterize the particle size range of the BQDs. The ESCALAB™ X-ray photoelectron spectrometer (Thermo Fisher, Waltham, MA, USA) was used for elemental analysis of BQDs (XPS). Polytetrafluoroethylene reactor (50 mL, Jinan Henghua technology Co., Ltd.) was used for the synthesis of BQDs. FS-150N ultrasonic processor (Shanghai Biogen ultrasonic instrument Co., Ltd.) was used to prepare cell lysates.2.3 Synthesis of BQDs
Corn was washed with tap water and ultrapure water, and blow dry the surface. Then, 50 g corn was placed into a mortar, fully grind it and transfer it to the high-pressure reactor lined with polytetrafluoroethylene (volume: 50 mL), 20 mL ultrapure water was added into the high-pressure reactor. Place the high-pressure reactor in the SZCL-3B digital display intelligent temperature control magnetic stirrer for stirring and heating to 260 °C for 10 h for reaction, turn off the heating and continue stirring, and let it cool naturally to room temperature. The mixture in the reactor was filtered with 0.22 μm drainage membrane, and the filtrate was transferred to dialysis bag (MWCO = 1 kD, pore size: ca. 1.0 nm). After dialysis in ultrapure water for 12 h, green fluorescent BQDs were obtained.2.4 Synthesis of DMI
Typically, 3.2 g (20 mmol) 2,3,3-trimethyl-3H-indole and 5.68 g (40 mmol) iodine–methane were mixed and dissolved in 10 mL acetonitrile solution. The mixture solution was heated to 60 °C under the protection of argon, and stirred for 11 h under the reflux of cooling water. The heating was stopped, and after natural cooling to room temperature, the light pink precipitation was obtained. After filtration with qualitative filter paper, the precipitation was washed with ethyl acetate three times. The precipitation was then dried in a vacuum drying oven to obtain a light pink powder (5.8 g).The light pink powder 0.150 g (0.50 mmol) and 0.12 g (0.75 mmol) 4-(dimethylamine) benzaldehyde were mixed and dissolved in 10 mL ethanol, and placed in a three-necked flask, heated to 180 °C with argon protection, and the cooling water was reflated for 4.5 h to obtain the red solution. The solvent was removed from the rotary evaporator, and a purified organic small molecule compound was obtained by column chromatography (CH2Cl2/C2H5OH): (E)-2-(4-(dimethylamino) styryl)-1,3,3-trimethyl-3H-indol-1-ium iodide (DMI, 0.194 g). 1H NMR (400 MHz, CDCl3) δ 8.14 (d, J = 15.2 Hz, 2H), 7.49–7.43 (m, 3H), 7.34–7.30 (m, 1H), 6.82 (d, J = 8.8 Hz, 2H), 5.32 (s, 1H), 4.17 (s, 3H), 3.20 (s, 6H), 1.99 (s, 1H), 1.80 (s, 6H); 13C NMR (100 MHz, CDCl3) δ 179.0, 155.1, 154.8, 141.8, 141.6, 129.0, 127.6, 122.3, 122.2, 112.7, 112.5, 104.6, 53.4, 50.8, 40.4, 35.1, 27.5. The synthetic rout is shown in the following figure:
2.5 Preparation of cells lysates
Cells used in the study were HepG2, MCF-7 and 7702 cells. The cell lines were cultured in a DMEM culture medium containing 10% fetal bovine serum, 10 U mL−1 penicillin, 10 g mL−1 streptomycin, and incubated at 37 °C for 24 h in a 5% CO2 atmosphere. After digesting with trypsin, the culture medium was removed by centrifugation, and the cells were dispersed in the PBS buffer. This procedure was repeated three times. Then, the cells were resuspended in 1× PBS buffer. A 3 mL volume of above cell suspension was added into the centrifuge tube, and centrifuging for 5 min at a speed of 1000 rpm. Then, the PBS solution was abandoned, 200 μL 1× PBS buffer solutions were used to suspend the cells with a cell density of about 1.43 × 10⁶ cells per mL, and transfer into a 1.5 mL centrifuge tube. The centrifugal tube was put in ice water bath on the ultrasonic instrument, with 80 W ultrasonic power ultrasonic broken for 20 min. After ultrasonic fragmentation, ultrafiltration membranes with a molecular weight cutoff of 10 kDa were used to remove large molecular weight proteins and extract the filtrate was retained for analysis.2.6 Determination of HSO3− in cells lysate
Typically, 20 μL cell lysate was added into 150 μL BQDs-DMI mixture solution (1× PBS![[thin space (1/6-em)]](https://www.rsc.org/images/entities/char_2009.gif) :
:![[thin space (1/6-em)]](https://www.rsc.org/images/entities/char_2009.gif) C2H5OH = 7
C2H5OH = 7![[thin space (1/6-em)]](https://www.rsc.org/images/entities/char_2009.gif) :
:![[thin space (1/6-em)]](https://www.rsc.org/images/entities/char_2009.gif) 3, concentration of DMI is 80 μM), and added a certain amount of ultrapure water to a final volume of 200 μL. After mixing well, the solution was placed for 10 min at room temperature. Then, the fluorescence spectrum of the solution was measured on a fluorescence spectrometer with 446 nm excitation.
3, concentration of DMI is 80 μM), and added a certain amount of ultrapure water to a final volume of 200 μL. After mixing well, the solution was placed for 10 min at room temperature. Then, the fluorescence spectrum of the solution was measured on a fluorescence spectrometer with 446 nm excitation.
3. Results and discussion
3.1 Characterization of BCDs
The morphology, surface functional groups, structure and composition of the BQDs were investigated by transmission electron microscope (TEM), X-ray diffraction (XRD), Fourier transform infrared spectroscopy (FTIR) and X-ray photo-electric spectrometry (XPS), respectively. TEM of BQDs is shown in Fig. 1a. It can be seen from the figure that the prepared BQDs are spherical particles and evenly dispersed, indicating they are water-soluble. The particle size distribution is within the scope of 2.0 to 5.5 nm, average particle size is 3.5 nm (Fig. 1b), and high resolution TEM (HRTEM) (inset in Fig. 1a) shown a clear lattice stripes, lattice constant is 0.315 nm. This corresponds to graphite material (002), indicating that the BQDs consist of graphite-like structures. The crystal surface constant of BQDs is characterized by XRD, and the results are shown in Fig. S1 (ESI).† It can be seen from the figure that the BQDs show a wide diffraction peak at the position of 2θ = 23.43°. This diffraction peak corresponds to the amorphous carbon structure crystal plane (002).35 Functional groups of BQDs surface are characterized by FTIR, and the results are shown in Fig. S2 (ESI).† The peak at 1027 cm−1 corresponds to the stretching vibration peak of C–O bond, the peak at 1652 cm−1 corresponds to the stretching vibration peak of C![[double bond, length as m-dash]](https://www.rsc.org/images/entities/char_e001.gif) O, the peak at 2939 cm−1 belongs to the C–H bond, and the peak at 3367 cm−1 corresponds to the stretching vibration peak of O–H/N–H. The results show that on the surface of BQDs hydrophilic groups such as –COOH and –OH are present which lands BQDs with a good water solubility. The element composition and surface bonding of BQDs were characterized by XPS. The results indicated that the BQDs were composed of five elements C, N, O, S and P. The composition was: C 64.44%, N 11.80%, O 23.15%, S 0.268% and P 0.332%. According to the overall distribution diagram of element analysis (Fig. 1c), the C 1s characteristic peak appeared at the position of 284.9 eV, the N 1s characteristic peak appeared at the position of 399.7 eV, the O 1s characteristic peak appeared at the position of 531.5 eV, and the S 2p and P 2p characteristic peaks appeared at the position of 163.5 eV and 134.2 eV respectively. As can be seen from the high-resolution spectrum of C 1s (Fig. S3a, ESI†), the signal peak appears at 287.8 eV, 286.3 eV, 285.7 eV, 285 eV and 284.3 eV of C 1s, in which 287.8 eV is C
O, the peak at 2939 cm−1 belongs to the C–H bond, and the peak at 3367 cm−1 corresponds to the stretching vibration peak of O–H/N–H. The results show that on the surface of BQDs hydrophilic groups such as –COOH and –OH are present which lands BQDs with a good water solubility. The element composition and surface bonding of BQDs were characterized by XPS. The results indicated that the BQDs were composed of five elements C, N, O, S and P. The composition was: C 64.44%, N 11.80%, O 23.15%, S 0.268% and P 0.332%. According to the overall distribution diagram of element analysis (Fig. 1c), the C 1s characteristic peak appeared at the position of 284.9 eV, the N 1s characteristic peak appeared at the position of 399.7 eV, the O 1s characteristic peak appeared at the position of 531.5 eV, and the S 2p and P 2p characteristic peaks appeared at the position of 163.5 eV and 134.2 eV respectively. As can be seen from the high-resolution spectrum of C 1s (Fig. S3a, ESI†), the signal peak appears at 287.8 eV, 286.3 eV, 285.7 eV, 285 eV and 284.3 eV of C 1s, in which 287.8 eV is C![[double bond, length as m-dash]](https://www.rsc.org/images/entities/char_e001.gif) O bond. 286.3 eV is carbon sp3 hybrid C–O bond; 285.7 eV is carbon sp3 hybrid C–N bond; 285 eV is carbon sp2 hybrid C
O bond. 286.3 eV is carbon sp3 hybrid C–O bond; 285.7 eV is carbon sp3 hybrid C–N bond; 285 eV is carbon sp2 hybrid C![[double bond, length as m-dash]](https://www.rsc.org/images/entities/char_e001.gif) C bond; 284.3 eV is carbon sp3 hybrid C–C/C–H bond.36 High resolution spectrum of N 1s (Fig. S3b, ESI†) shows that the signal peaks at 400.03 eV and 399.38 eV are respectively the signal peaks of pyrrole N and pyrimidine N.37 It can be seen from the high-resolution spectrum of O 1s (Fig. S3c, ESI†) that the main bonding of O is O–H (533.3 eV), O–N (532.3 eV), C
C bond; 284.3 eV is carbon sp3 hybrid C–C/C–H bond.36 High resolution spectrum of N 1s (Fig. S3b, ESI†) shows that the signal peaks at 400.03 eV and 399.38 eV are respectively the signal peaks of pyrrole N and pyrimidine N.37 It can be seen from the high-resolution spectrum of O 1s (Fig. S3c, ESI†) that the main bonding of O is O–H (533.3 eV), O–N (532.3 eV), C![[double bond, length as m-dash]](https://www.rsc.org/images/entities/char_e001.gif) O (531.5 eV) and C–O (530.8 eV).38 Above results show that the surface of BQDs is rich in hydrophilic groups and has good water solubility, which is consistent with the infrared spectrum results.
O (531.5 eV) and C–O (530.8 eV).38 Above results show that the surface of BQDs is rich in hydrophilic groups and has good water solubility, which is consistent with the infrared spectrum results.
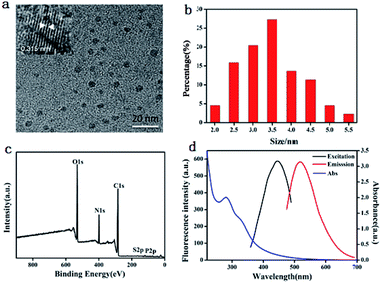 | ||
| Fig. 1 Characterization of BQDs prepared: (a) TEM and HRTEM images; (b) particle size distribution; (c) XPS spectrum; (d) UV-vis absorption and fluorescence spectra. | ||
3.2 Optical performance of the BQDs
To explore the optical properties of BQDs, UV-vis absorption and fluorescence spectra of BQDs were studied. The blue curve in Fig. 1d is the UV-vis absorption spectrum of BQDs, which has the maximum absorption peak at 280 nm. The black curve in Fig. 1d is the fluorescence excitation spectrum of BQDs, with the maximum excitation wavelength of 446 nm. Under the excitation of this wavelength light, the maximum emission peak of BQDs appears at 518 nm (red curve). In addition, the fluorescence emission of BQDs at different excitation wavelengths was investigated. The results are shown in Fig. S4 (ESI).† The fluorescence emission maximum of BQDs was red shifted with the increase of excitation wavelength, indicating that the fluorescence emission spectrum of the BQDs was excitation dependent. At the maximum excitation wavelength of 446 nm, the maximum emission wavelength was 518 nm.Using quinine sulfate as the reference, the QY of prepared BQDs was obtained to be 14.9%, which is much higher than that of many reported BQDs that were prepared using coffe grounds (3.8%),39 watermelon peel (6.7%)40 and sweet potatoes (2.8%)41 as precursor.
3.3 Stability of BQDs solution
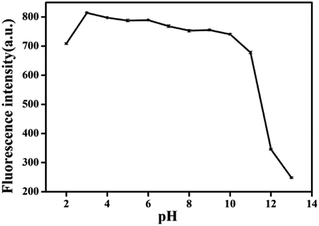
In order to evaluate the stability of BQDs solution, the effects of UV lamp exposure time and solution ion strength on the stability of BQDs were investigated. The fluorescence intensity of BQDs solution was basically unchanged (Fig. S5, ESI†) after exposure to UV lamp (365 nm) for 2 h, indicating that the BQDs solution had good light resistance and bleaching resistance. Fig. S6 (ESI†) shows the effect of ionic strength of the solution on the fluorescence intensity of BQDs. It was found that the fluorescence intensity of BQDs solution was basically unchanged in 0–2.5 M sodium chloride solution. The above results indicate that the BQDs have good anti-bleaching and anti-salt properties, and can be used as fluorescent probes to detect bioactive molecules in vivo and in vitro. The effect of solution pH value on the fluorescence intensity of BQDs was also investigated. As shown in Fig. 2, when the pH value is within the range of 2.0–3.0, the fluorescence intensity of BQDs solution increases with the increase of the pH value. When pH value is within the range of 10.0–13.0, fluorescence intensity decreases gradually with the increase of pH value of solution. When pH is within the range of 3.0–10.0, fluorescence intensity basically remains unchanged with the increase of pH value of the solution.3.4 Characterization of DMI
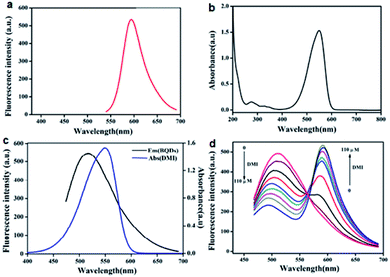
DMI was synthesized by a two-step nucleophilic reaction. The structure of DMI was characterized by mass spectrometry (MS), and the result is shown in Fig. S7 (ESI).† It can be seen from the figure that 305.07 m/z is the cationic MS peak from DMI, and the abundance of 305.7 m/z ion is very high, indicating that the purity of the synthesized DMI is very high. In addition, the compound was further identified by 1H NMR and 13C NMR, and the results are shown in Fig. S8 and S9 (ESI),† confirming DMI identity. The fluorescence spectrum and UV-visible absorption spectrum of DMI were studied. As shown in Fig. 3a, the maximum emission wavelength of DMI is at 595 nm. Fig. 3b shows the UV-visible absorption spectrum of DMI. It can be seen from the figure that DMI has the maximum absorption peak near 549 nm.3.5 FRET between BQDs and DMI
FRET between BQDs and DMI was investigated. The results show that the fluorescence emission spectrum of BQDs and the absorption spectrum of DMI overlap effectively (Fig. 3c), which suggests that when the two coexist FRET will occur. Moreover, with the increase of DMI concentration, the fluorescence intensity of BQDs gradually decreased, while that of DMI gradually increased (Fig. 3d). When HSO3− is present in the system, it reacts with DMI, which breaks up the conjugate double bond in DMI (Fig. S10, ESI†), reducing the absorption intensity of DMI (Fig. S11, ESI†) and thus resulting in a decrease in FRET efficiency and recovery of fluorescence emission of BQDs (Fig. S12, ESI†). The results demonstrate that this FRET system is capable of monitoring and quantifying in endogenous HSO3− through a ratiometric fluorescence response.3.6 Ratiometric fluorescence detection of HSO3−
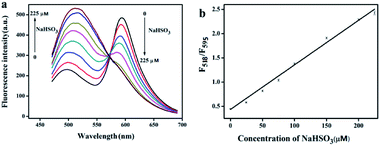
To evaluate the FRET system for ratiometric fluorescence assay of HSO3−, the response time of HSO3− to the system and the linear range of the response were investigated. The results are shown in Fig. S13 (ESI†) and 4. As can be seen from the figure, after adding HSO3− the ratio fluorescence intensity (F518/F595) of the system increases gradually with the extension of reaction time, and reaches a maximum after 10 min. With the increase of HSO3− concentration, fluorescence intensity of BQDs at 518 nm increases and fluorescence intensity of DMI at 595 nm decreases gradually. F595/F518 value and HSO3− concentration in the range of 1.0–225 μM show a good linear relationship with a linear regression equation: F518/F595 = 0.00919C + 0.4379 (where C is concentration of HSO3− in μM), R2 = 0.9919. The detection limit was estimated to be 0.5 μM (S/N = 3).3.7 Selectivity investigation
In order to assess the selectivity of the proposed assay, the effects of various anions, reactive oxygen species, reducing substances and biological mercaptan on the detection of HSO3− were investigated. The results are shown in Fig. 5. When Cl−, Br−, I−, NO2−, NO3−, HPO42−, CH3COO−, CO32−, HCO3−, H2O2, GSH, Cys, S2− and ascorbic acid (AA) were introduced into the system, the ratio fluorescence intensity of the system did not change significantly as compared with blank signal. When HSO3− was added to the system at the same concentration, the ratio fluorescence intensity of the system increased significantly. These results indicate that the assay has a very good selectivity for HSO3−.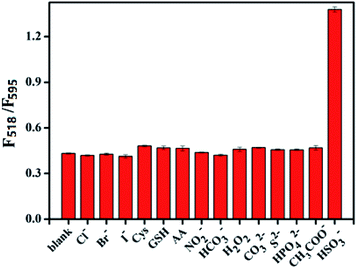 | ||
| Fig. 5 Specificity of the proposed ratiometric fluorescence assay based on FRET for HSO3− detection. Concentration = 100 μM for all species tested. | ||
3.8 The detection of HSO3− in cells lysates
To demonstrate the feasibility of the proposed method for the detection of HSO3− in real biological samples, we performed HSO3− assay with lysates of HepG2, 7702 and MCF-7 cells. Each sample was measured five times in parallel. HSO3− concentration in HepG2, 7702 and McF-7 cell lysates (1.43 × 10⁶ cells per mL) was found 36.8, 34.2 and 30.8 μM, respectively. RSDs of the five parallel assays for HepG2, 7702 and McF-7 cell lysates were 0.3%, 0.6% and 0.9%, respectively. The spike and recovery tests were carried out in cell lysates. The recovery was between 95–104% (Table 1), indicating that this method was well suited for the determination of HSO3− in cell lysates.| Sample (cell) | Found (μM) | Added (μM) | Found total (μM) | Recovery (%) |
|---|---|---|---|---|
| HepG2 | 3.68 | 5.0 | 8.65 | 99.4 |
| 10.0 | 13.37 | 96.9 | ||
| 20.0 | 23.59 | 99.6 | ||
| 5.0 | 8.51 | 101.8 | ||
| 7702 | 3.42 | 10.0 | 13.02 | 96.0 |
| 20.0 | 23.24 | 99.1 | ||
| 5.0 | 8.27 | 103.8 | ||
| MCF-7 | 3.08 | 10.0 | 13.42 | 103.4 |
| 20.0 | 23.22 | 95.7 |
4. Conclusions
A ratiometric fluorescence assay based on RET between BQDs and organic dye (DMI) was developed for the detection of sulfur dioxide derivatives. The proposed method was applied to the quantification of HSO3− in HepG2, 7702 and McF-7 cell lysates. The assay has several significant advantages. First, this assay is based on the principle of FRET with BQDs as the energy donor. It's well known that there is no photobleaching when BQDs is irradiated by the excitation light, which makes the FRET system very stable. Secondly, using ratio fluorescence analysis to detect the target eliminates the impacts of environmental changes and of the instability of the test instrument. Thirdly, this assay has a good selectivity. Many co-existing anions, reactive oxygen species, reducing substances and biological mercaptan in the biological samples have no interference with the detection of HSO3−. Considering these advantageous characteristics, we anticipate the proposed ratiometric fluorescence assay will be very useful for physiological and pathological studies of SO2.Conflicts of interest
There are no conflicts to declare.Acknowledgements
Financial support from the Natural Science Foundation of China (No. 201575031 to SZ), the U.S. National Institutes of Health (GM089557 to YML) and Natural Science Foundation of Guangxi Province (No. 2017GXNSFFA198014) as well as BAGUI Scholar Programs is gratefully acknowledged.References
- A. V. Leontiev and D. M. Rudkevich, J. Am. Chem. Soc., 2005, 127, 14126–14127 CrossRef CAS PubMed.
- D. P. Li, Z. Y. Wang, X. J. Cao, J. Cui, X. Wang, H. Z. Cui, J. Y. Miao and B. X. Zhao, Chem. Commun., 2016, 52, 2760–2763 RSC.
- Y. Liu, K. Li, K. X. Xie, L. L. Li, K. K. Yu, X. Wang and X. Q. Yu, Chem. Commun., 2016, 52, 3430–3433 RSC.
- T. Finkel and N. J. Holbrook, Nature, 2000, 408, 239–247 CrossRef CAS PubMed.
- M. H. Stipanuk and I. Ueki, J. Inherited Metab. Dis., 2011, 34, 17–32 CrossRef CAS PubMed.
- Z. Meng, Z. Yang, J. Li and Q. Zhang, Chemosphere, 2012, 89, 579–584 CrossRef CAS PubMed.
- G. Li and N. Sang, Ecotoxicol. Environ. Saf., 2009, 72, 236–241 CrossRef CAS PubMed.
- N. Sang, Y. Yun, H. Li, L. Hou, M. Han and G. Li, Toxicol. Sci., 2010, 114, 226–236 CrossRef CAS PubMed.
- D. R. Shankaran, N. Uehera and T. Kato, Sens. Actuators, B, 2002, 87, 442–447 CrossRef.
- R. F. McFeeters and A. O. Barish, J. Agric. Food Chem., 2003, 51, 1513–1517 CrossRef CAS PubMed.
- G. Jankovskiene, Z. Daunoravicius and A. Padarauskas, J. Chromatogr. A, 2001, 934, 67–73 CrossRef CAS PubMed.
- Y. Sun, P. Wang, J. Liu, J. Zhang and W. Guo, Analyst, 2012, 137, 3430–3433 RSC.
- H. Xie, F. Zeng, C. Yu and S. Wu, Polym. Chem., 2013, 4, 5416–5424 RSC.
- X. Yang, M. Zhao and G. Wang, Sens. Actuators, B, 2011, 152, 8–13 CrossRef CAS.
- Y. Yang, F. Huo, J. Zhang, Z. Xie, J. Chao, C. Yin, D. Liu, S. Jin and F. Cheng, Sens. Actuators, B, 2012, 166, 665–670 CrossRef.
- C. Yu, M. Luo, F. Zeng and S. Wu, Anal. Methods, 2012, 4, 2638–2640 RSC.
- M. Choi, J. Hwang, S. Eor and S. Chang, Org. Lett., 2010, 12, 5624–5627 CrossRef CAS PubMed.
- X. Gu, C. Liu, Y. Zhu and Y. J. Zhu, J. Agric. Food Chem., 2011, 59, 11935–11939 CrossRef CAS PubMed.
- X. H. Cheng, H. Z. Jia, J. Feng, J. G. Qin and Z. Li, Sens. Actuators, B, 2013, 184, 274–280 CrossRef CAS.
- W. Chen, Q. Fang, D. Yang, H. Zhang, X. Song and J. Foley, Anal. Chem., 2015, 87, 609–616 CrossRef CAS PubMed.
- S. Chen, P. Hou, J. Wang and X. Song, RSC Adv., 2012, 2, 10869–10873 RSC.
- M. Y. Wu, K. Li, C. Y. Li, J. T. Hou and X. Q. Yu, Chem. Commun., 2014, 50, 183–185 RSC.
- L. M. Zhu, J. C. Xu, Z. Sun, B. Q. Fu, C. Q. Qin, L. T. Zeng and X. C. Hu, Chem. Commun., 2015, 51, 1154–1156 RSC.
- H. Yu, L. B. Du, L. M. Guan, K. Zhang, Y. Y. Li, H. J. Zhu, M. T. Sun and S. H. Wang, Sens. Actuators, B, 2017, 247, 823–829 CrossRef CAS.
- J. B. Chao, X. L. Wang, Y. M. Liu, Y. B. Zhang, F. J. Huo, C. X. Yin, M. G. Zhao, J. Y. Sun and M. Xu, Sens. Actuators, B, 2018, 272, 195–202 CrossRef CAS.
- Y. Q. Zhang, D. K. Ma, Y. Zhuang, X. Zhang, W. Chen, L. L. Hong, Q. X. Yan, K. Yu and S. M. Huang, J. Mater. Chem., 2012, 22, 16714–16718 RSC.
- D. P. Li, Z. Y. Wang, X. J. Cao, J. Cui, X. Wang, H. Z. Cui, J. Y. Miao and B. X. Zhao, Chem. Commun., 2016, 52, 2760–2763 RSC.
- Y. Liu, K. Li, K. X. Xie, L. L. Li, K. K. Yu, X. Wang and X. Q. Yu, Chem. Commun., 2016, 52, 3430–3433 RSC.
- Y. Zhang, L. Guan, H. Yu, Y. Yan, L. Du, Y. Liu, M. Sun, D. Huang and S. Wang, Anal. Chem., 2016, 88, 4426–4431 CrossRef CAS PubMed.
- M. F. Huang, L. N. Chen, J. Y. Ning, W. L. Wu, X. D. Hec, J. Y. Miao and B. X. Zhao, Sens. Actuators, B, 2018, 261, 196–202 CrossRef CAS.
- J. Zhu, F. Qin, D. Zhang, J. Tang, W. Liu, W. Cao and Y. Ye, New J. Chem., 2019, 43, 16806–16811 RSC.
- S. Sahu, B. Behera, T. K. Maiti and S. Mohapatra, Chem. Commun., 2012, 48, 8835–8837 RSC.
- J. Wang, C. F. Wang and S. Chen, Angew. Chem., Int. Ed., 2012, 51, 1–6 CrossRef.
- J. Zhao, M. Huang, L. Zhang, M. Zou, D. Chen, H. Huang and S. Zhao, Anal. Chem., 2017, 89, 8044–8049 CrossRef CAS PubMed.
- A. Mewada, S. Pandey, S. Shinde, N. Mishra, G. Oza, M. Thakur, M. Sharon and M. Sharon, Mater. Sci. Eng., C, 2013, 33, 2914–2917 CrossRef CAS PubMed.
- W. J. Lu, X. J. Gong, M. Nan, Y. Liu, S. M. Shuang and C. Dong, Anal. Chim. Acta, 2015, 898, 116–127 CrossRef CAS PubMed.
- Y. Q. Dong, H. C. Pang, H. B. Yang, C. X. Guo, J. W. Shao, Y. W. Chi, C. M. Li and T. Yu, Angew. Chem., 2013, 125, 7954–7958 CrossRef.
- A. Prasannan and T. Imae, Ind. Eng. Chem. Res., 2013, 52, 15673–15678 CrossRef CAS.
- P. C. Hsu, Z. Y. Shih, C. H. Lee and H. T. Chang, Green Chem., 2012, 14, 917–920 RSC.
- J. Zhou, Z. Sheng, H. Han, M. Zou and C. Li, Mater. Lett., 2012, 66, 222–224 CrossRef CAS.
- W. Lu, X. Qin, A. M. Asiri, A. Q. Al-Youbi and X. J. Sun, Nanopart. Res., 2013, 15, 1344–1350 CrossRef.
Footnotes |
| † Electronic supplementary information (ESI) available. See DOI: 10.1039/c9ra09437g |
| ‡ These two authors contributed equally to this work. |
| This journal is © The Royal Society of Chemistry 2019 |


