 Open Access Article
Dual-microRNA-controlled double-amplified cascaded logic DNA circuits for accurate discrimination of cell subtypes†
Ke
Quan
,
Jing
Li
,
Jiaoli
Wang
,
Nuli
Xie
,
Qiaomei
Wei
,
Jinlu
Tang
,
Xiaohai
Yang
 ,
Kemin
Wang
 and
Jin
Huang
 *
*
State Key Laboratory of Chemo/Biosensing and Chemometrics, College of Chemistry and Chemical Engineering, Key Laboratory for Bio-Nanotechnology and Molecular Engineering of Hunan Province, Hunan University, Changsha, P. R. China. E-mail: jinhuang@hnu.edu.cn
First published on 19th November 2018
Abstract
Accurate discrimination between different cells at the molecular level is particularly important for disease diagnosis. Endogenous RNAs are such molecular candidates for cancer cell subtype identification. But the key is that there is often low abundance of RNAs in live cells, or some RNAs are often shared by multiple types of cells. Thus, we have designed dual-microRNA-controlled double-amplified cascaded logic DNA circuits for cancer cell subtype identification. The basic idea is to improve sensitivity by cascading DNAzyme and hybridization chain reaction (HCR), and improve accuracy by simultaneous detection of miR-122 and miR-21. The in-tube and in-cell experimental results show that the cascaded logic DNA circuits can work and serve to differentiate the liver cancer cells Huh7 from other normal cells and cancer cells. We anticipate that this design can be widely applied in facilitating basic biomedical research and accurate disease diagnosis.
Introduction
The development of reliable strategies to distinguish between different cells at the molecular level is particularly important for disease diagnosis, such as between cancer cells and normal cells, or various cancer cell subtypes. In the field of oncology, specific biomarkers are essential to precision medicine, in which they enable the determination of cancer in a relatively earlier stage.1 However, most biomarkers are often shared by multiple types of cells, or a marker overexpressed in diseased cells is also expressed at a low level in normal cells. Therefore, the single-biomarker-controlled system potentially results in off-target effects.2 Several DNA logic platforms have been recently demonstrated for specific cancer cell recognition. Tan et al. designed several DNA strand displacement cascade reactions combining DNA aptamers for multiple cancer cell-surface marker analysis.3,4 Ju et al. designed a DNA dual lock-and-key strategy to perform cell-subtype-specific recognition.5 All these methods are designed based on cell surface receptors. Besides, there are plenty of biomarkers in live cells. For example, Liu et al. presented modular AND gate circuits based on the CRISPR-Cas9 system for bladder cancer cell identification.6 Morel et al. developed a synthetic gene circuit acting on SSX1 and H2A1 proteins for cancer targeting.7 There is increasing evidence to suggest that various RNA molecules are able to serve as biomarkers for different cancers. In particular, intracellular microRNAs are emerging as non-invasive biomarkers for earlier cancer diagnosis.8–10 But the problem is that there is low abundance of microRNAs in live cells, or there is no strict correspondence between RNAs and specific cells.To solve these problems, we seek to design a dual-microRNA detection strategy to simultaneously improve sensitivity and accuracy. DNA circuits are able to combine several modules to perform multiple intelligent tasks based on their Watson–Crick base-pairing interaction and programmability.11–13 Their main advantages are that they are small enough and can work in a humid environment, such as working in blood vessels and live cells. In this paper, we engineered dual-microRNA-controlled double-amplified cascaded logic DNA circuits and applied them in live cells for cellular subtype identification. The basic idea is to improve sensitivity by cascading two kinds of amplification techniques, such as DNAzyme14–16 and hybridization chain reaction (HCR),17–22 and improve accuracy by microRNA-based “AND” logic gate control.
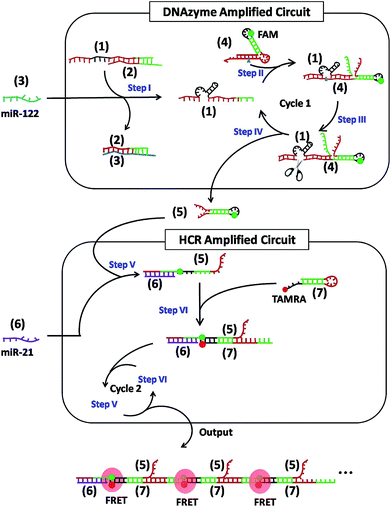
As shown in Scheme 1, the cascaded circuits are composed of two modules: a DNAzyme amplified circuit and a HCR amplified circuit. In detail, miR-122 (3) and miR-21 (6) were chosen as two input strands, respectively. The catalytic activity of the 8–17 DNAzyme23,24 (1) is first inhibited by partially hybridizing to an inhibitor strand (2) to form complex (1)/(2) with a short overhanging toehold. Upon adding the input strand (3), it hybridizes with (2) and eventually displaces (1) by a toehold-mediated strand-displacement reaction, leaving a waste complex (2)/(3) and a free DNAzyme (1) (Step I). The hairpin (4) uses a metastable dual stem-loop design (Fig. S1†). It consists of an outer stem and loop, which make up the DNAzyme substrate domain, and an inner stem and loop labeled with a fluorophore (FAM), which sequester a downstream activator sequence (Step II). The released DNAzyme (1) binds to the outer stem and loop of hairpin (4), linearizing the substrate domain and correctly positioning the cleavage site of (4) opposite to the catalytic core of the DNAzyme (Step III). The subsequent cleavage reaction frees the protected toehold in the outer loop of (4), eventually produces a hairpin (5), and simultaneously releases DNAzyme strand (1), which could get into the next cycle (Step IV). Upon adding another input strand (6), it first interacts with hairpin (5) to open the stem-loop structure (Step V). The newly exposed sticky end of (5) nucleates at the sticky end of hairpin (7) labeled with another fluorophore (TAMRA) and opens the hairpin to expose a sticky end that is identical in sequence to (6) (Step VI). In this way, the HCR occurs by alternating hybridization between (5) and (7), which yields long DNA concatemers carrying a large number of adjacent FAM and TAMRA, producing remarkable FRET signals (repeat Step V and Step VI).
Results and discussion
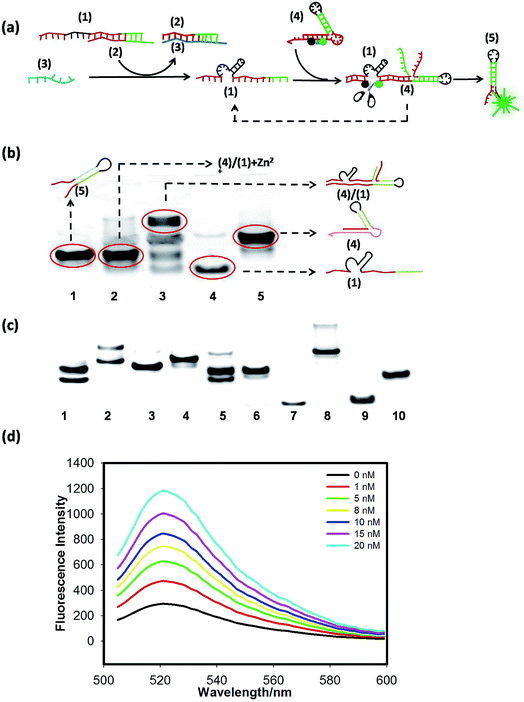
To confirm the feasibility of the cascaded circuits, we verified each module through gel electrophoresis and fluorescence-activable experiments. The scheme of the signal-activable DNAzyme amplified circuit is shown in Fig. 1(a), in which hairpin (4) is redesigned and FAM and BHQ are, respectively, labeled at the two sides of the cutting site of the DNAzyme substrate domain. Before cutting, the fluorescence of FAM is quenched by BHQ. Only when the target miR-122 (3) activates DNAzyme (1) to cut hairpin (4), are FAM and BHQ far away from each other, resulting in fluorescence recovery.We first verified that the 8–17 DNAzyme (1) has the ability to cut the linear substrate in the presence of Zn2+ by PAGE analysis (Fig. S2†). Then we used hairpin substrate (4) instead of the linear substrate to test whether DNAzyme (1) can still work in this case. Gel-electrophoresis analysis was performed to validate the working feasibility of the above DNAzyme amplified circuit, as shown in Fig. 1(b); lane 2 is the DNAzyme cutting product (after cutting), which shows an obvious shift compared with lane 3 (before cutting) and similar to lane 1 (5). The results suggest that the scheme in Fig. 1(a) is indeed feasible. As shown in Fig. 1(c), the band shift between lane 1 and lane 2 showed that (2) could effectively inhibit the activity of DNAzyme (1), only when the introduction of input strand (3) could free DNAzyme (1), resulting in the cleavage of hairpin (4). Comparing lane 1, lane 2, lane 3 and lane 4, we could see that the cleavage of hairpin (4) indeed produced strand (5). The last six lanes (lane 6–lane 10) suggested that (1) and (2) could form a duplex, and (3) added could hybridize with (2), and displace (1) from (2). Good sequestration efficiency was achieved by using 200 nM (2) (Fig. S3(a)†). Then we tested the selectivity of the DNAzyme circuit (Fig. S4†) and found that the fluorescence increase resulting from the 20 nM target was significantly larger than that from the single-base mutation target, which indicates that the DNAzyme circuit can effectively differentiate the fully matched target from the variant of single-base mismatch. Finally, the response of the signal-activable DNAzyme amplified circuit to different concentrations of the target miR-122 is shown in Fig. 1(d); the fluorescent signals increased with increasing miR-122 from 1 nM to 20 nM, in which the fluorescence intensity increased by about 4-fold, indicating that the miR-122 activates the cleavage reaction. By calculation based on the 3 times standard deviation rule, a limit of detection (LOD) of 100 pM was obtained.
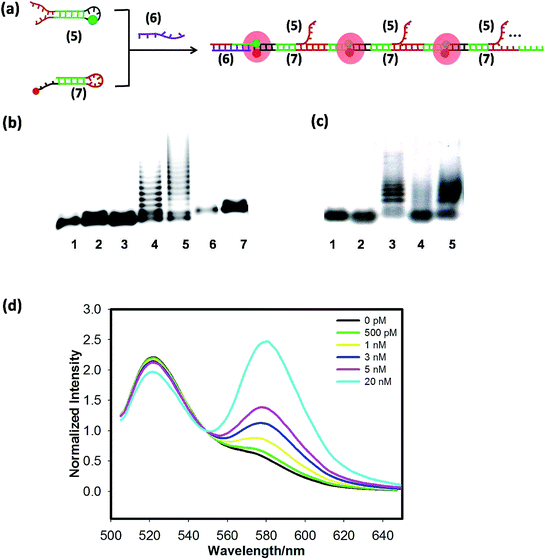
Next, the scheme of the FRET-based HCR amplified circuit is shown in Fig. 2(a), in which input strand (6) triggers the HCR between hairpins (5) and (7) to form long DNA concatemers carrying a large number of adjacent FAM and TAMRA, producing remarkable FRET signals. Gel-electrophoresis analysis was performed to support the HCR scheme, as shown in Fig. 2(b), many bright bands with different sizes are obtained for incubation with trigger (6) in lane 4 and lane 5. But we cannot find any new band in lane 1, lane 2 and lane 3. In addition, the average molecular weight of the resulting polymers is inversely related to the trigger (6) concentration. The reason is that amplification of the trigger binding event continues until the supply of (5) or (7) is exhausted. In other words, the lower the concentration of the trigger, the longer the HCR product is. Subsequently, we tested the whole DNAzyme-HCR cascaded circuits through electrophoresis analysis. The result of lane 7 in Fig. 2(b) suggests that if (4) cannot be cut to produce (5), the HCR cannot happen even in the presence of (6) and (7). Also, the results of lane 4 and lane 5 in Fig. 2(c) indicate that only when hairpin (4) was cut, and trigger (6) was present, could the HCR reaction successfully happen. An obvious improvement of signal-to-background ratio could be obtained by altering the concentration of (7)![[thin space (1/6-em)]](https://www.rsc.org/images/entities/char_2009.gif) :
:![[thin space (1/6-em)]](https://www.rsc.org/images/entities/char_2009.gif) (5) to the ratio of 2
(5) to the ratio of 2![[thin space (1/6-em)]](https://www.rsc.org/images/entities/char_2009.gif) :
:![[thin space (1/6-em)]](https://www.rsc.org/images/entities/char_2009.gif) 1 as shown in Fig. S3(b).† Then we tested the selectivity of the FRET-based HCR (Fig. S5†) and found that the sequence fragment single-base mutation target shows low FRET signals, analogous to the hairpins only. Finally, the FRET spectra of the HCR as a function of various concentrations of the trigger miR-21 are shown in Fig. 2(d); the TAMRA fluorescence increased and the FAM fluorescence decreased with increasing miR-122 from 500 pM to 20 nM, indicating that the miR-21 triggers the HCR. The LOD was calculated to be 200 pM. From the above results, both the DNAzyme and HCR could offer efficient signal amplification and enable ultrasensitive fluorescence activation of target microRNAs with a picomolar detection limit.
1 as shown in Fig. S3(b).† Then we tested the selectivity of the FRET-based HCR (Fig. S5†) and found that the sequence fragment single-base mutation target shows low FRET signals, analogous to the hairpins only. Finally, the FRET spectra of the HCR as a function of various concentrations of the trigger miR-21 are shown in Fig. 2(d); the TAMRA fluorescence increased and the FAM fluorescence decreased with increasing miR-122 from 500 pM to 20 nM, indicating that the miR-21 triggers the HCR. The LOD was calculated to be 200 pM. From the above results, both the DNAzyme and HCR could offer efficient signal amplification and enable ultrasensitive fluorescence activation of target microRNAs with a picomolar detection limit.
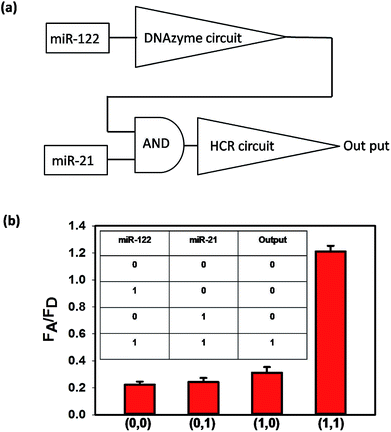
If a cell is identified as a liver cancer cell, it should have two characteristics: one represents the liver cell and the other denotes the cancer cell. According to the literature, miR-122 is a liver-specific microRNA with suggested roles in cholesterol, fatty acid and lipid metabolism,25 and miR-21 is demonstrated as an “oncomir” and widely found in cancer cells.26 When the expression levels of the two microRNAs are high, the cells can be identified as liver cancer cells. As shown in Scheme 1, only when both miR-122 (3) and miR-21 (6) exist, could the output FRET signal be detected, which is thus equivalent to an AND logical gate. We first verified the logical operation in buffer. The flow diagram of the AND logical gate is shown in Fig. 3(a), where miR-122 and miR-21 were essential to initiate the cascaded circuits to give an output signal. As shown in Fig. 3(b), the FRET signals were obtained only when both miR-122 and miR-21 existed. Then the sensitivity of the whole cascade circuits was investigated. As shown in Fig. S6,† the FRET signals increased even when both the concentrations of miR-122 and miR-21 were as low as 500 pM. To investigate the intracellular microRNA amplified detection and accurate cancer cell subtype identification, we chose Huh7 (human hepatoma cells) as the positive cells, and HeLa (human cervical cancer cells) and HEK293T (human renal epithelial cells) were selected as negative cells. HEK293T cells lack both miR-21 and miR-122, and HeLa cells lack miR-122, while Huh7 cells express high levels of miR-21 and miR-122.27
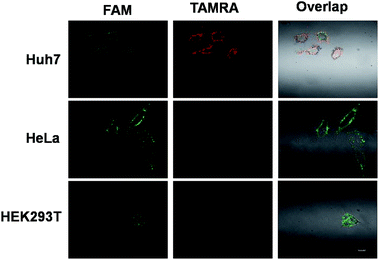
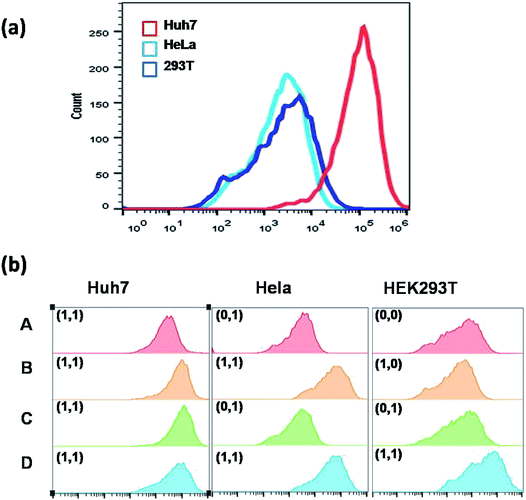
Above all, Fig. S4† outlines the logical gate operation in the three cell lines with different expression levels of target microRNAs. The fluorescence colocalization images (Fig. S5†) of Huh7 cells suggest that the DNA probes can enter the live cells by lipofectamine transfection and are distributed in the cytoplasm, ensuring the chance to approach the cytoplasmic microRNAs. Fig. S6† shows that the FRET signals in Huh7 cells gradually increase with incubation time up to 8 hours, but the FRET signals in HeLa cells are very low at all times under the same conditions. This suggests that the 8 hour-incubation time should be appropriate to be adopted in the following experiments. Subsequently, three types of cell lines were selected to study the specificity. Fig. 4 shows that strong red fluorescence in Huh7 was observed, and almost no red fluorescence in HeLa and HEK293T was detected. The results of which were consistent with the results of the conventional biological standard method qPCR (Fig. S10 and S11†). Here, the inhomogeneous and punctate intracellular fluorescence was attributed to the distribution of miR-122 and miR-21 in the cytoplasm, which was infected by the inhomogeneous cellular environment. These results were also confirmed by the flow cytometry assay (Fig. 5(a)), suggesting the excellent specificity of the cascaded DNA circuits for miR-122 and miR-21 in their respective target cells.
To further prove that the red signal is indeed caused by the intracellular miR-122 and miR-21, we did flow cytometric analysis by artificially changing the intracellular expression level of miR-122 and miR-21. The three cell lines were analyzed under different conditions in parallel, which were separated into four groups, including A, B, C and D. Among these, group A is an untreated group, which can serve as a control; group B means the cells transfected with miR-122; group C represents the cells transfected with miR-21; group D denotes the cells transfected with both miR-122 and miR-21. The results in Fig. 5(b) show that the red fluorescence signals were also observed in HeLa cells and HEK293T cells through transfection with miR-122, or both miR-122 and miR-21, respectively. In the control group, no red signal could be originally detected in HeLa cells and HEK293T cells. It is worth mentioning that the red fluorescence signals of B, C and D were higher than that of A in Huh7, which might be due to the increasing concentrations of miR-122 or miR-21 additionally. These results were also confirmed by fluorescence imaging analysis in Fig. S12 and S13.† On the contrary, if the anti-miR-21 or anti-miR-122 was transfected into Huh7 cells, the corresponding microRNAs would be inhibited, resulting in no red fluorescence signal detected in Huh7 cells. Fig. S14† shows that through antagomir treatment with accurate complimentary copies of the miR-21 or miR-122 sequence, the DNA circuits were indeed deactivated. These experiments confirmed that the dual-microRNA-controlled double-amplified cascaded logic DNA circuits could work and serve to identify the cancer cell subtype accurately through logically sensing two kinds of microRNAs.
Conclusions
In summary, we have constructed dual-microRNA-controlled double-amplified cascaded logic DNA circuits and applied them to precisely identify liver cancer cells. At least five advantages of our method have been demonstrated: (1) the dual-microRNA-controlled strategy provides an impressive improvement over the single-input-controlled system by increasing specificity and inhibiting off-target effects; (2) the double-amplified assay offers efficient signal amplification and enables ultrasensitive fluorescence activation of target microRNAs with a picomolar detection limit; (3) the ratiometric signal generation in FRET can minimize the effect of system fluctuations; (4) the reaction conditions of DNAzyme and HCR are very mild, which makes it possible for application in live cells; (5) the double-controlled double-amplified idea is general and scalable, which may allow us to realize even more complex tasks by further integrating diverse biomarkers, other Boolean logic operations, and other DNA-based modules, eventually facilitating accurate disease diagnosis and even effective therapy.Experimental section
Chemicals and materials
Lipofectamine 3000 was obtained from Invitrogen (Thermo Fisher Scientific, USA). 6× loading buffer and SYBR Gold were purchased from TaKaRa Biotechnology Co., Ltd (Dalian, China). All the cells we used were obtained from the Cell Bank of the Committee on Type Culture Collection of the Chinese Academy of Sciences (Shanghai, China). All other chemicals were of analytical grade and used without pretreatment, unless mentioned otherwise. All aqueous solutions were prepared using ultrapure water (≥18 MΩ, Milli-Q water purification system, Millipore). Hairpins (4) and (7) were synthesized by TaKaRa Biotechnology Co., Ltd (Dalian, China). All other DNA and RNA strands were synthesized and HPLC purified by Sangon Biotechnology Co. Ltd. (Shanghai, China), and the sequences are listed in Table S1.†Apparatus
The gel electrophoresis was imaged on an Azure c600 (Azure Biosystems, USA). Fluorescence spectra were measured on an F-7000 spectrofluorophotometer (HITACHI, Japan). The confocal microscope measurements were recorded using an A1RMP two-photon laser confocal microscope (Nikon, Japan). The cells were incubated by using a Thermo FORMA 3111 CO2 incubator (ThermoFisher, USA). All buffer pH measurements were performed with an Orion 3 Star pH meter (Thermo Scientific, USA). Centrifugation was performed with a Beckman Coulter Allegra 25R centrifuge (Brea, CA, USA). Flow cytometric analysis was performed on a Coulter FC-500 flow cytometer (Beckman-Coulter, USA) by counting 10![[thin space (1/6-em)]](https://www.rsc.org/images/entities/char_2009.gif) 000 events.
000 events.
Gel electrophoresis
Hairpins (4), (5), and (7) and the (1)/(2) complex were heated to 95 °C for 5 min and then allowed to cool to room temperature for at least 2 hours before use. All of the concentrations of (1), (2), (4), (5), (7), and (8) were 2 μM if used. For agarose gel electrophoresis, a sample containing 10 μL of each reaction product, 2 μL 6× loading buffer, and 2 μL of SYBR Gold was subjected to 2% agarose gel electrophoresis for 50 min at 90 V in TAE buffer. For native polyacrylamide gel electrophoresis (PAGE), the DNA solution was mixed with loading buffer and 1× SYBR Gold, and then run on a 12% native polyacrylamide gel. The electrophoresis was conducted in 1× TAE buffer at a constant voltage of 100 V for 2 h.Fluorescence experiments
All the assays were prepared in 50 mM Tris buffer containing 150 mM NaCl and 50 μM ZnCl2, pH 7.5 at 37 °C. Hairpins (4), (5), and (7) and the (1)/(2) complex were heated to 95 °C for 5 min and then allowed to cool to room temperature for at least 2 hours before use. The excitation and emission wavelengths of TAMRA are 543 nm and 576 nm, respectively. For the detection of miR-122 in the signal-activable DNAzyme module, 5 μL of the 100 nM (1)/200 nM (2) complex was mixed with 100 nM (4) in a 90 μL Tris–HCl buffer solution, and then 5 μL of miR-122 at a certain concentration was added to initiate the DNAzyme cleavage reaction for 3 h. Fluorescence measurements were carried out with excitation at 488 nm and emission at 521 nm. For the detection of miR-21 in the FRET-based HCR module, 100 nM (5) and 200 nM (7) were mixed in a 90 μL Tris–HCl buffer solution, and 5 μL of miR-21 at a certain concentration was then added to initiate the HCR reaction for 2 h. Fluorescence measurements were carried out with excitation at 488 nm and emission at both 521 nm and 576 nm. For the cascaded circuits, the 100 nM (1)/200 nM (2) complex, 100 nM (4) and 200 nM (7) were mixed with various concentrations of miR-122 and miR-21 in Tris–HCl buffer solution. The fluorescence kinetics analysis was carried out by recording the intensity of both 521 nm and 576 nm at 20 min intervals. The fluorescence A/D ratios at different time points (the value of TAMRA fluorescence intensity at 576 nm/FAM fluorescence intensity at 521 nm) were normalized by taking the A/D ratio at 550 nm as 1.0.Cell culture and transfection
The Huh7, HeLa, HEK293T cells were cultivated in Dulbecco's Modified Eagle's Medium (DMEM) supplemented with 10% fetal calf serum, 100 μg mL−1 penicillin, and 100 μg mL−1 streptomycin at 37 °C in a humidified 5% CO2-containing atmosphere. The cells were grown to 80% confluence for 24 h before transfection with probes. The cell density was determined using a hemocytometer. Transfection assays were performed according to the manufacturer's protocol. Briefly, when using 35 mm glass dishes or 6-well plates, transfection was carried out using 3 μL lipofectamine 3000 and certain concentrations of probes in 300 μL of Opti-Mem, then diluted to 1000 μL with DMEM and incubated at 37 °C for 8 h.Confocal laser scanning microscopy (CLSM) experiments
Various cells were seeded in a 35 mm confocal dish and allowed to grow for 24 h. After washing three times with D-hanks, 100 μL of fresh medium with 500 μM Zn2+ was first incubated with the cells for 0.5 h. After discarding the medium, the cells were transfected and incubated with the 100 nM (1)/200 nM (2) complex, 100 nM (4) and 200 nM (7) in a 1 mL volume of culture medium containing 10% FBS for 8 h or various times (for time optimization). After incubation, the cells were washed twice with 1 mL of D-PBS and subjected to confocal microscope imaging. For the CLSM experiments after treatment with antisense inhibitor oligodeoxyribonucleotides, the cells were first transfected and incubated with 200 nM anti-miR-122 or anti-miR-21 for 2 h. The fluorescence images were taken under a 60× oil-immersion objective and an Ar+ laser (488 nm) as an excitation source. The FAM fluorescence image was recorded in a green channel with a 505 nm (±10 nm) bandpass filter and the TAMRA fluorescence image was recorded in a red channel with a 560 nm (±10 nm) bandpass filter.Cell co-localization assays
The Huh7 cells were seeded in a 35 mm confocal dish and incubated for 24 h. After washing three times with D-hanks, 100 μL of fresh medium with 500 μM Zn2+ was first incubated with the cells for 0.5 h. After discarding the medium, the cells were transfected and incubated with the 100 nM (1)/200 nM (2) complex, 100 nM (4) and 200 nM (7) in a 1 mL volume of culture medium containing 10% FBS for 8 h. After additional washing with PBS, the cells were treated with 5 μg mL−1 Hoechst-33342 for 10 min. After incubation, the cells were washed twice with 1 mL of D-PBS and subjected to confocal microscope imaging. Excitation of Hoechst was carried out at λ = 405 nm and emissions were collected in the blue channel. The excitation of FAM was carried out at λ = 488 nm and the emissions of FAM and TAMRA were recorded in green and red channels, respectively.Reverse transcriptase-PCR analysis
The cells were cultivated in DMEM medium in a 6-well plate for 24 h. These cells were transfected and incubated with the 100 nM (1)/200 nM (2) complex, 100 nM (4) and 200 nM (7) in a 1 mL volume of culture medium containing 10% FBS for 8 h, then washed with D-hanks, trypsinized and lastly harvested. Total RNA was extracted using 107 cells of each kind with Trizol reagent according to the kit protocol. Each RNA sample (5 ng) was reverse transcribed using Revertaid Premium Reverse Transcriptase (Thermo Scientific) in a 15 μL reaction volume for 10 min at 25 °C, 30 min at 50 °C, 5 min at 85 °C, and then placed on ice. Real-time PCR following reverse transcription was carried out with SG Fast qPCR Master Mix (2X) (BBI) on a Stepone plus qRT-PCR system (ABI). Specifically, one-tenth of the RT product was used in a 20 μL PCR system. The reactions were incubated in a 96-well plate at 95 °C for 3 min, followed by 45 cycles of 95 °C for 7 s, 57 °C for 10 s and then 72 °C for 10 s. U6 was used as an internal control for miRNA detection. The relative expression level can be estimated by the values of 2−(ΔΔCt). All reactions were performed in triplicate.Flow cytometry assays
Huh7 cells and the other two negative cells were grown to 80% in 6-well plates under the above-described conditions. The cells were washed with D-hanks, then transfected and incubated in fresh medium with the 100 nM (1)/200 nM (2) complex, 100 nM (4) and 200 nM (7) or extra adding 100 nM synthetic miRNA for artificially changing the intracellular expression level of miR-122 and miR-21 experiments. After 8 h incubation, the cells were washed with PBS, trypsinized and lastly harvested. Then the samples were analyzed with a flow cytometer by counting 10![[thin space (1/6-em)]](https://www.rsc.org/images/entities/char_2009.gif) 000 events at λ = 488 nm and collected at the FL2 channel with a 575 nm (±10) bandpass.
000 events at λ = 488 nm and collected at the FL2 channel with a 575 nm (±10) bandpass.
Conflicts of interest
There are no conflicts to declare.Acknowledgements
This work was supported by the National Natural Science Foundation of China (21735002 and 21874036), the National Natural Science Foundation of Hunan Province (2017JJ2039), the Hunan Provincial Innovation Foundation for Postgraduate (521293377), and the Fundamental Research Funds for the Central Universities.Notes and references
- S. Bhattacharya and T. J. Mariani, Biochem. Soc. Trans., 2009, 37, 855 CrossRef CAS PubMed.
- C. C. Kloss, M. Condomines, M. Cartellieri, M. Machmann and M. Sadelain, Nat. Biotechnol., 2013, 31, 71 CrossRef CAS PubMed.
- M. You, L. Peng, L. Zhang, L. Qiu, C. Cui and W. Tan, J. Am. Chem. Soc., 2014, 136, 1256 CrossRef CAS PubMed.
- M. You, G. Z. Zhu, T. Chen, M. J. Donovan and W. Tan, J. Am. Chem. Soc., 2015, 137, 667 CrossRef CAS PubMed.
- K. Ren, Y. Liu, J. Wu, Y. Zhang, J. Zhu, M. Yang and H. Ju, Nat. Commun., 2017, 7, 13580 CrossRef PubMed.
- Y. Liu, Y. Zeng, L. Liu, C. Zhuang, X. Fu, W. Huang and Z. Cai, Nat. Commun., 2014, 5, 5393 CrossRef CAS PubMed.
- M. Morel, R. Shtrahman, V. Rotter, L. Nissim and R. H. Bar-Ziv, Proc. Natl. Acad. Sci. U. S. A., 2016, 113, 8133 CrossRef CAS PubMed.
- D. Sidransky, Science, 1997, 278, 1054 CrossRef CAS PubMed.
- H. D. Schwarzenbach, S. B. Hoon and K. Pantel, Nat. Rev. Cancer, 2011, 11, 426 CrossRef CAS PubMed.
- X. Xi, T. Li, Y. Huang, J. Sun, Y. Zhu, Y. Yang and Z. J. Lu, Non-Coding RNA, 2017, 3, 9 CrossRef PubMed.
- G. Seelig, D. Soloveichik, D. Y. Zhang and E. Winfree, Science, 2006, 314, 1585 CrossRef CAS PubMed.
- F. Wang, C. H. Lu and I. Willner, Chem. Rev., 2014, 114, 2881 CrossRef CAS PubMed.
- C. Jung and A. D. Ellington, Acc. Chem. Res., 2014, 47, 1825 CrossRef CAS PubMed.
- Y. Yang, J. Huang, X. Yang, K. Quan, H. Wang, L. Ying, N. Xie, M. Ou and K. Wang, Anal. Chem., 2016, 88, 5981 CrossRef CAS PubMed.
- Y. Yang, J. Huang, X. Yang, X. He, K. Quan, N. Xie, M. Ou and K. Wang, Anal. Chem., 2017, 89, 5850 CrossRef CAS PubMed.
- Y. Wu, J. Huang, X. Yang, Y. Yang, K. Quan, N. Xie, J. Li, C. Ma and K. Wang, Anal. Chem., 2017, 89, 8377 CrossRef CAS PubMed.
- R. M. Dirks and N. A. Pierce, Proc. Natl. Acad. Sci. U. S. A., 2004, 101, 15275 CrossRef CAS PubMed.
- J. Huang, Y. Wu, Y. Chen, Z. Zhu, X. Yang, C. Yang, K. Wang and W. Tan, Angew. Chem., Int. Ed., 2011, 50, 401 CrossRef CAS PubMed.
- P. Liu, X. Yang, S. Sun, Q. Wang, K. Wang, J. Huang, J. Liu and L. He, Anal. Chem., 2013, 85, 7689 CrossRef CAS PubMed.
- J. Huang, H. Wang, X. Yang, K. Quan, Y. Yang, L. Ying, N. Xie, M. Ou and K. Wang, Chem. Sci., 2016, 7, 3829 RSC.
- J. Wei, X. Gong, Q. Wang, M. Pan, X. Liu, J. Liu, F. Xia and F. Wang, Chem. Sci., 2018, 9, 52 RSC.
- H. Wang, C. Li, X. Liu, X. Zhou and F. Wang, Chem. Sci., 2018, 9, 5842 RSC.
- J. Li and Y. Lu, J. Am. Chem. Soc., 2000, 122, 10466 CrossRef CAS.
- J. Liu and Y. Lu, J. Am. Chem. Soc., 2003, 75, 6666 CAS.
- C. M. Yu, L. H. Qian, M. Uttamchandani, L. Li and S. Q. Yao, Angew. Chem., Int. Ed., 2015, 54, 10574 CrossRef CAS PubMed.
- P. P. Medina, M. Nolde and F. J. Slack, Nature, 2010, 467, 86 CrossRef CAS PubMed.
- J. Hemphill and A. Deiters, J. Am. Chem. Soc., 2013, 135, 10512 CrossRef CAS PubMed.
Footnote |
| † Electronic supplementary information (ESI) available. See DOI: 10.1039/c8sc04887h |
| This journal is © The Royal Society of Chemistry 2019 |

