 Open Access Article
Gold–carbonyl group interactions in the electrochemistry of anthraquinone thiols self-assembled on Au(111)-surfaces
Michal
Wagner
 *,
Katrine
Qvortrup
 ,
Katja E.
Grier
,
Mikkel R.
Ottosen
,
Jonas O.
Petersen
,
David
Tanner
,
Katja E.
Grier
,
Mikkel R.
Ottosen
,
Jonas O.
Petersen
,
David
Tanner
 ,
Jens
Ulstrup
 and
Jingdong
Zhang

Department of Chemistry, Technical University of Denmark, Kemitorvet, Building 207, 2800 Kgs. Lyngby, Denmark. E-mail: michal.wagner83@gmail.com
First published on 4th March 2019
Abstract
New anthraquinone derivatives with either a single or two thiol groups (AQ1 and AQ2) were synthesized and immobilized in self-assembled monolayers (SAMs) on Au(111) electrodes via Au–S bonds. The resultant AQ1- and AQ2-SAMs were studied by cyclic voltammetry (CV) and electrochemical impedance spectroscopy (EIS), which enabled mapping of the gold–carbonyl group interactions and other dynamics in the Au–S bound molecular framework. Understanding of these interactions is important for research on thiol-coated gold nanoclusters, since (I) anthraquinone derivatives are a major compound family for providing desired redox functionality in multifarious assays or devices, and (II) the gold–carbonyl interactions can strongly affect anthraquinone electrochemistry. Based on equivalent circuit analysis, it was found that there is a significant rise in polarization resistance (related to SAM structural reorganization) at potentials that can be attributed to the quinone/semi-quinone interconversion. The equivalent circuit model was validated by calculation of pseudocapacitance for quinone-to-hydroquinone interconversion, in good agreement with the values derived from CV. The EIS and CV patterns obtained provide consistent evidence for two different ECEC (i.e. proton-controlled ET steps, PCET) pathways in AQ1- and AQ2-SAMs. Notably, it was found that the formal reorganization (free) energies obtained for the elementary PCET steps are unexpectedly small for both SAMs studied. This anomaly suggests high layer rigidity and recumbent molecular orientation on gold surfaces, especially for the AQ2-SAMs. The results strongly indicate that gold–carbonyl group interactions can be controlled by favorable structural organization of anthraquinone-based molecules on gold surfaces.
Introduction
There is presently a great interest in gold nanoclusters, i.e. gold in sub-nanoparticle size in a variety of shapes.1 These span polyhedral structures containing from a few to hundreds of gold atoms. Gold nanoclusters are intensively investigated due to their potential exploitation e.g. as catalysts2 and to single-electron charging and other quantum effects.3,4 One of the “traditional” methods of gold nanoparticle synthesis and stabilization is the use of coating compounds terminated with thiol groups, which is comprehensively exploited in the creation of gold nanoclusters.1 The organization of dithiol-type compounds on gold nanoclusters in comparison to compounds with only a single thiol group is further important from fundamental points of view. The interaction and surface distribution of added functional groups is of particular interest,1 which would be different for mono- and dithiol compounds. Additional functionalization provides other useful approaches for fine-tuning of gold nanocluster properties, and for controlled aggregation of the functionalized Au-clusters into new “smart” materials.1,4One feasible step towards assessing such interactions is the use of anthraquinone derivatives. Anthraquinones with two thiol linkers are attractive for molecular electronics,5 due to their molecular redox functionalities, and ease of tuning properties by adding functional groups through well-established organic syntheses.6–8 The putative application of anthraquinone thiol derivatives as molecular linkers or redox probes also relates to the great importance of quinone electrochemistry in bioenergetics.9 Future devices based on hybrids of anthraquinone thiols with gold nanoclusters could therefore potentially be utilized e.g. in investigation of electron transfer (ET) kinetics in electrochemical systems based on redox enzymes.10,11 The quinone-to-hydroquinone conversion process also depends strongly on pH, since each ET step is accompanied by proton transfer (PT).12–14 Besides the proton concentration and the surrounding medium, the electrochemical conversion of carbonyl groups can also be affected by the nature of the gold surfaces.15 In-depth understanding of these interactions in the context of anthraquinone-gold systems is thus highly important.
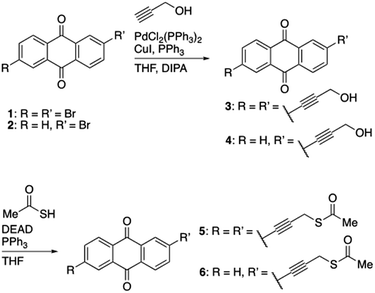
In this report we present a study of the electrochemical properties of self-assembled molecular monolayers (SAMs) of in-house synthesized mono- and dithiol anthraquinone derivatives (denoted as AQ1- and AQ2-SAMs, Scheme 1) assembled on Au(111) electrode surfaces. Deposition of the compounds on a single-crystal (i.e. atomically flat) gold surface enabled first the recording of interfacial faradaic processes of both the carbonyl group and the surface Au–S linking units.
Secondly, electrochemical features related to structural reorganization events in the whole AQ-SAMs could be recorded. The assignment of these features to specific reactions is based on cyclic voltammetry (CV) and electrochemical impedance spectroscopy (EIS). Particularly, the EIS data combined with equivalent circuit analysis allowed us to assess at the same time changes in pseudocapacitance and polarization resistance (Rp). The calculated pseudocapacitances based on equivalent circuit analysis are consistent with those that correspond to faradaic process as obtained from CV, thus supporting the proposed model. A significant change in Rp is an indicator of structural reorganization in the layer subjected to electric fields.16
An overall electrochemical assessment of gold–carbonyl group interactions framed within the quinone-to-hydroquinone interconversion process is provided. We particularly focus on the carbonyl group proximity to gold which triggers specific structural SAM reorganization, as well as solvent and intramolecular reorganization that accompanies the “elementary” PCET steps. Very notably the latter was found to be unexpectedly small and much smaller than reorganization free energies commonly encountered for electrochemical ET processes. As noted, the understanding of gold–carbonyl interactions is also more broadly important for future electrochemical investigations of anthraquinone compounds assembled on gold nanoclusters.
Results and discussion
CV of the quinone group
Cyclic voltammograms of AQ2 SAMs show two reversible electrochemical reactions (referred to as reactions (1) and (2)), Fig. 1A. Both reactions depend on pH, and their formal potentials shift with pH (ca. 60 mV pH−1) following the Nernst equation for a one-electron-one-proton (PCET) process, Fig. 1B. Since the overall quinone/hydroquinone conversion in aqueous buffer is a 2-proton/2-electron process,13 the observed one-electron-one-proton features must be part of a two-step process each step with a PCET-type mechanism.17 Reaction (2) is therefore likely to be related to the formation of semi-quinones, and reaction (1) to the fully reduced AQ2 hydroquinone state. The peak related to semi-quinone formation has in fact been observed for quinone films at high pH,18 or in CV of freely mobile quinones in unbuffered solutions.14 On the other hand, reaction (2) for anthraquinone derivative SAMs in buffered solutions at moderate pH should not be observed. This is the case with our reference compound (AQ1-SAM), insert in Fig. 6. This feature therefore not only depends on the proton concentration, but is also likely to depend on the particular organization of the attached quinones at the surface. The latter is in turn controlled by molecular interactions within the layer and by specific interactions with the electrode surface. Significantly different peak capacitances for reactions (1) and (2) are therefore observed, which we address further below using frequency response analysis.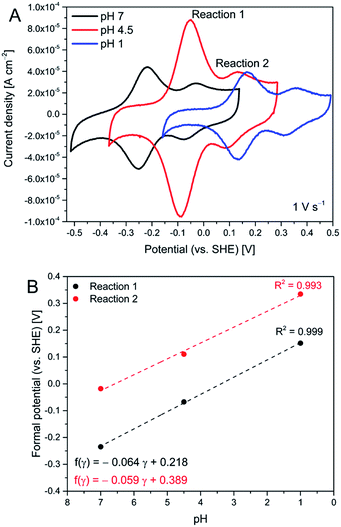 | ||
| Fig. 1 Representative cyclic voltammograms of AQ2-SAMs at different pH (A), and corresponding Pourbaix diagrams for reactions (1) and (2) (B). | ||
Reductive desorption of the Au–thiol surface bond
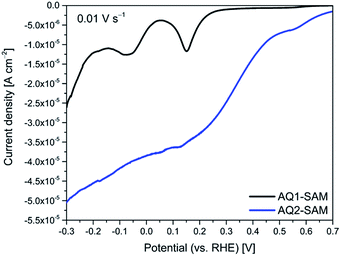
Different structural organization of the AQ1- and AQ2-SAMs is expected, as AQ1 binds only via a single Au–S bond, while AQ2 can bind either by a single or two Au–S bonds. AQ2 is therefore expected to form a structurally more rigid surface layer than AQ1. Pronounced differences between the AQ1- and AQ2-SAMs on Au(111) electrodes is in fact substantiated by reductive desorption voltammograms recorded for 0.1 M NaOH, Fig. 2. AQ1-SAMs exhibit a single dominating sharp feature at ca. 0.15 V (actual desorption) and a satellite feature at ca. −0.10 V (arising due to electrode roughness), according with typical voltammograms for desorption of alkanethiol monolayers.19 AQ2-SAMs exhibit less well-defined features, likely to originate from e.g. sequential desorption or more constrained angular degrees of freedom, both arising from the prevalence of two binding sites. The estimated surface coverages (mol cm−2) from reductive desorption of AQ1- and AQ2-SAMs are ca. 6.8 × 10⁻¹⁰ and 7.4 × 10⁻¹⁰, respectively, assuming single-ET for AQ1 and two-ET for AQ2 in the desorption processes. This supports that there are in fact two binding sites for AQ2, but only a single binding site for AQ1. The estimated surface coverages are close to the expected coverage of a dense monolayer (with interchain spacing of ≈5 Å) of 7.76 × 10⁻¹⁰ mol cm−2 on a (111)-facet.20AQ-SAMs surface imaging
Scanning tunnelling microscopy (STM) in both the ex situ and the electrochemical in situ modes were undertaken. High-resolution images could be recorded, but their interpretation remains presently elusive. As can be seen from Fig. S1,† cluster formation was consistently observed, resulting in significantly disordered adlayers. Such structures can strongly affect tunnelling current pathways in different ex situ and in situ STM tip/target molecule/gold surface systems. However, below 150–200 Å, the resolution was not sufficient to distinguish single-molecule features or surface orientation of the anthraquinone thiols. This could be attributed to a persistent tendency of anthraquinone thiol derivatives for π-stacking competing with Au–S surface bonding. The synthetized molecules have relatively short side chains, and strong π–π interactions are to be expected. We therefore focused further attention on electrochemical kinetic and frequency response analysis in the assessment of gold–carbonyl group interactions.Frequency response analysis
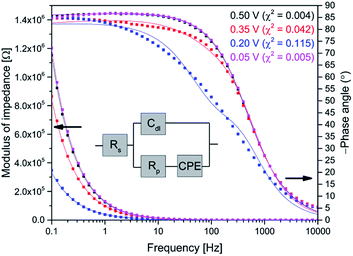
EIS for AQ1- and AQ2-SAMs was recorded to obtain insight in the nature of reaction (2) and its relation to reaction (1). The EIS experiments were designed to complement optimally the CV data. An example of AQ2-SAM frequency response and equivalent circuit is shown in Fig. 3. The equivalent circuit is analogous to the typical circuit used to describe faradaic impedance of strongly adsorbed molecular entities.12 The capacitive element related to the faradaic process was modified by utilizing a constant phase element (CPE). This small modification enabled a far more flexible fit to the wide potential range than utilization solely of a capacitor.Additionally, the use of a CPE offers insight into the roughness of the surface.21 The complex CPE admittance Y(ω) can be described by the equation:22
 | (1) |
 | (2) |
The Cr values (after correction for Cdl as noted) can be directly used for the validation of the applied equivalent circuit. As seen from Fig. 4, the calculated specific capacitances for reaction (1) are quite similar to the values derived from CV, thus justifying the application of the proposed equivalent circuit for the description of faradaic impedance of adsorbed anthraquinone thiols.
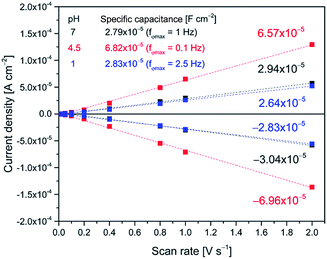 | ||
| Fig. 4 Validation of the applied equivalent circuit (inset in Fig. 3) by comparison of specific capacitance calculated from CPE (i.e. Cr) with the values obtained from CV (i.e. the slopes of the fitted lines). The experimental values (from EIS and CV studies of AQ2-SAMs) correspond to reaction (1). | ||
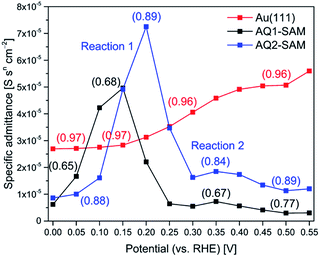
Fig. 5 shows potential induced changes in CPE admittance (and thus in Cr). There is a significant admittance rise in reaction (1) for both AQ1- and AQ2-SAMs (0.15–0.20 V), and a much smaller change for reaction (2) (ca. 0.35 V). These changes are consistent with the CV features obtained (inset in Fig. 6). As noted, n gives a rough estimate of the adlayer deformation. The particular numerical values of this parameter are shown in the brackets for selected potentials, Fig. 5. The change in n with applied potential for AQ2-SAMs, is only significant for reaction (2) suggesting a major structural reorganization in a narrow potential range. The n values for AQ1-SAMs are significantly lower than for both bare and AQ2-coated Au(111) electrodes, making similar assessment challenging. This finding might be indicative of more complex intermolecular interactions in the AQ1 adlayers.
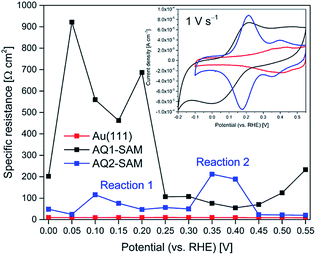 | ||
| Fig. 6 Representative Rp variation as a function of applied potential (pH 4.5) for bare Au(111) (red), AQ1-SAM (black) and AQ2-SAM (blue). Inset: corresponding cyclic voltammograms. | ||
The plot of Rp against applied potential implies that two different EC (ET/PT) reaction pathways specific for AQ1- and AQ2-SAMs operate, Fig. 6. The kinetics for freely mobile anthraquinone-type compounds was found to proceed by EECC (pH ≈ 10), ECEC (at pH 7–4) and CECE (pH 1 and below) mechanisms (where E is ET and C is PT in the sequence).13 We could not obtain sufficient electroactivity above pH 7 for the SAMs here, and the highest electroactivity was found at pH ≈ 4.5. The latter finding is reflected in the observed pH dependence of the current densities for both reactions (1) and (2), being similar at pH 7 and pH 1, but notably higher at pH 4.5. The apparent pKa of the first protonation step is around 4 for the ECEC mechanism.13 The maximum current density can therefore be associated with the maximum concentration of semiquinone at pH 4.5 compared to pH 7. In the case of pH 1, the apparent pKa of the first protonation step is estimated to be below 1 for the CECE mechanism.13 It can then be suggested that the gold–carbonyl group interactions may interfere more strongly with the first CE step than with the corresponding EC step, resulting in the different current densities at pH 4.5 and pH 1.
Since the ECEC mechanism likely prevails at pH 4.5, and the relaxation between the ET and the PT steps is fast, the two distinct reorganization events in the AQ1-SAM structure (separated by ca. 0.15 V) can be assigned to two consecutive EC steps, resulting in a single broad CV redox wave. The assigned EC steps (i.e. reactions (1) and (2)) of AQ2-SAMs are separated by a larger potential difference of ca. 0.25 V. The change in Rp associated with reaction (2) is significantly higher than for reaction (1), although the change in admittance and pseudocapacitance for reaction (2) is still very small.
Electrochemical kinetics analysis
We attempted first to estimate the interfacial electrochemical ET rate constants (kox/kred) for AQ1- and AQ2-SAMs by a Laviron analysis and the Butler–Volmer limit of the current/overpotential (i/η) correlation, Fig. 7: | (3) |
 | (4) |
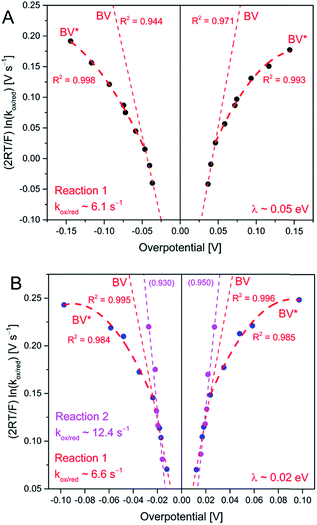 | ||
| Fig. 7 Tafel plots for AQ1- (A) and AQ2-SAMs (B), from CV (up to 20 V s−1 scan rate) at pH 4.5. The fitting at low overpotentials is based on eqn (3) and (4) (BV), and the estimation of the reorganization energy is based on fitting of Eg 5 at higher overpotentials (BV*). | ||
In accordance with electrochemical molecular charge transfer concepts and theoretical concepts and formalism introduced by Marcus, Hush, Gerischer, and particularly by Levich, Dogonadze, Kuznetsov and associates,25–31 the latter correlation can be represented as:
 | (5) |
The summary of this analysis is given in Fig. 7. Slightly asymmetric Tafel plots for AQ1-SAM were obtained, in contrast to AQ2-SAM, suggesting that the layer of the latter is less prone to molecular structural changes in the PCET steps. Notably, λ was found to be only ca. 0.05 eV for the AQ1-SAM and 0.02 eV for the AQ2-SAM. λ for reaction (2) could not be determined, due to difficulties in reaching the current plateau region, even at high scan rates.
The difference in apparent λ could indicate that the carbonyl groups are closer to the electrode surface for AQ2-SAMs than for AQ1-SAMs, which is supported by the specific faradaic resistance (Ω cm2) of ca. 6.1 × 10⁵ for the AQ1-SAM and 3.5 × 10⁴ for the AQ2-SAM (Fig. S3†). The values of λ obtained are, however, very small and correspond to almost step-like transition from the Butler–Volmer to the activationless overpotential region. More importantly, the emerging limiting slopes at small overpotentials which represent the electrochemical transfer coefficient, α are quite different from the input values in the Laviron forms (e.g. 1.6 vs. 0.7, Fig. S4 and S5†). These observations prompt alternative considerations given below.
Consistent use of the Laviron and Butler–Volmer formalism rests on the notion of strong electronic-vibrational coupling and large reorganization free energies, λ ≫ kBT. The observed current rise from thermal to activationless behavior is far too abrupt to be compatible with the broadly observed much smaller curvature in both simple electrochemical processes and ET processes in homogeneous solution. To account for step-like i/η behavior the notion of weak electronic-vibrational coupling can instead be proposed. In this limit the i/η correlation is dominated by the step-like Fermi function in the electrochemical rate constant rather than by the Gaussian molecular vibrational energy density form as in “normal” electrochemical ET processes. This difference can be illustrated by more detailed rate constant forms that incorporate contributions from all electronic levels of the metal electrode and not only from levels around the Fermi energy. The current density, here cathodic is:27–31
 | (6) |
 | (7) |
 | (8) |
The Gaussian width is Δ = 2√λkBT ≈ 0.2–0.3 eV for λ = 0.5–1.0 eV as in “normal” strong-coupling electrochemical ET. This limit implies that the current varies from quadratic to activationless overpotential dependence over a range of ≥0.5 V. Since the Gaussian width 2√λkBT significantly exceeds the “width” of the Fermi function the current monitors essentially the Gaussian vibrational energy density up to overpotentials around λ. In the opposite limit of weak coupling, the Gaussian width approaches the “width” of the Fermi function, say Δ = 2√λkBT ≈ 0.04–0.07 eV or (1–2) × kBT for λ = 0.02–0.05 eV, Fig. 7. In the limit of very weak coupling g(ε − εF; η) would assume a Lorentzian form.31 Current is not recorded in these limits, until the overpotential has taken the maximum of the, now very narrow Gaussian or Lorentzian g(ε − εF; η) function up to the Fermi level, with a very narrow η-range changing the current from “normal” to activationless behavior. What is recorded in the i/η correlations then, is essentially the Fermi function f(ε − εF) and not the vibrational “bandshape” g(ε − εF; η). Fig. 8 illustrates the difference between the strong- and weak-coupling limits.
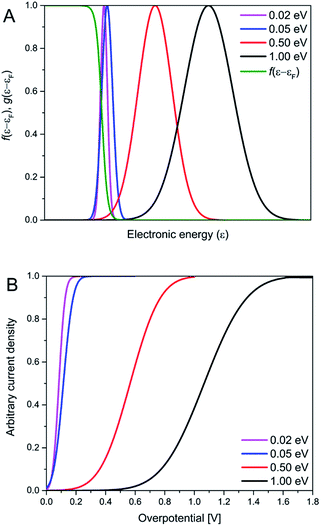 | ||
| Fig. 8 The dependence of normalized transition probability (with respect to η = 0 V) and the Fermi function on the electronic energy (A), together with calculated normalized i/η relationship (B), for selected λ-values. The transition probability was calculated using Eg 8, and the i/η relationships using a reformulation of eqn (6) (eqn S2†). | ||
Kuznetsov has provided a quantitative formalism in the weak-coupling limit both for ET in homogeneous solution and electrochemical ET processes.32 A detailed formalism for analogous optical electronic transitions, for which the weak-coupling Lorentzian bandshape limit is much more common, is also available.33 It thus appears that the i/η correlations obtained accord formally with weak electronic-vibrational coupling but poorly with the much more commonly encountered limit of strong electronic-vibrational coupling. The question regarding physical reasons, why the coupling should be weak particularly for the thiol-derived anthraquinones bound to the Au(111)-electrode surfaces via strong Au–S chemisorption then arises.
Based on the results from CV and EIS, it can be suggested that the significant structural reorganization in AQ2-SAMs in reaction (2) can be attributed to the impeding effect of gold–carbonyl group interaction on the semi-quinone formation. This is different from the nuclear reorganization in the elementary faradaic processes and resembles autoinhibition in electrochemical systems where a mercury electrode surface is saturated with target adsorbate compounds.34,35 Together with the unexpected voltammetric behavior in the i/η pattern for both AQ1- and AQ2-SAMs (Fig. 7), with a sharp ((1–2) × kBT) transition between “normal” and activationless i/η behavior, the major findings of our study can then be summarized as:
(I) The anthraquinone molecules in the AQ2-SAMs are in close proximity to the electrode surface leading to strong gold–carbonyl group interaction, in contrast to anthraquinone molecules in the AQ1 adlayers.
(II) Gold–carbonyl interactions create an energy barrier, leading to a split CV redox wave (denoted as reactions (1) and (2)) and a narrowing of the peak attributed to reaction (1) (inset in Fig. 6).
(III) The strong gold–carbonyl group interactions in the AQ2-SAMs are supported by the Nernstian pH dependence of both reactions (1) and (2) (Fig. 1), as well by the significant difference in the Rp-potential dependence between AQ1- and AQ2-SAMs (Fig. 6).
(IV) The clear Rp changes can be interpreted as structural reorganization events in the AQ-SAMs.
(V) Structural reorganization in reaction (2) is significantly more pronounced than in reaction (1) (Fig. 6).
(VI) Pseudocapacitance for reaction (2) is almost negligible compared to reaction (1) (Fig. 5).
(VII) A very small environmental reorganization (free) energy accompanies the PCET processes in both AQ1- and AQ2-SAMs (Fig. 7 and 8).
Regarding point (V), it might be speculated that prior to reaction (2), anthraquinone molecules in the AQ2-SAM interact with gold either via a single or both carbonyl groups. These binding modes could result in SAMs composed of specific differently organized domains (hypothetical State 1). The STM data offer some support for such a view, Fig. S1† After completion of reaction (2), the resulting semi-quinones maintain interaction with gold via a single remaining carbonyl group (hypothetical State 2). The structural reorganization from State 2 into fully reduced AQ2-SAM might be lower in reaction (1) than in reaction (2), since the molecular orientation in State 1 is more random than in State 2.
Point VI suggests that the appearance of reaction (2) in the cyclic voltammograms of AQ2-SAMs is of complex nature. As a comparison, intermolecular interaction of sulfonated anthraquinones gives narrow spike-like CV features.34 This is in contrast to the observed broad reaction (2) CV features of AQ2-SAMs, and probably associated with greater disorder of State 1 in the AQ2-SAM, than in layers composed of loosely adsorbed anthraquinones at mercury electrodes.34 Correspondingly the transition from State 1 to State 2 could result in a decrease of AQ2-SAM compactness, which might rationalize that the observed apparent rate for reaction (2) is about twice higher than for reaction (1) (Fig. 7B).
The notable observation in point VII remains open. AQ2 layers are expected to be more rigid than AQ1 layers, due to single Au–S binding for AQ1 and binding by either a single or two Au–S bonds for AQ2, reflected in around twofold higher apparent λ and about an order of magnitude higher faradaic resistance for AQ1 than for AQ2. On the other hand, the apparent λ-value for AQ1-SAMs is also “unexpectedly small”. Furthermore, the ET distances for both AQ1 and AQ2 SAMs are small (i.e. below 1 nm), and the possibly of planar (or close to planar) molecular orientation could indeed result in small reorganization energies. It can therefore be proposed that overall AQ-SAMs rigidity and close proximity of anthraquinone molecules to the electrode surface would result in the small λ observed.
“Small” apparent λ-values for “simple” electrochemical ET processes are known for the mammalian heme redox protein cytochrome c36,37 and the bacterial blue copper protein azurin.38,39 These values are, however, still significantly larger, ≈0.25 eV or so, than the apparent λ-values presently observed. Although structurally “small”, these proteins are also still complex molecules compared with AQ1 and AQ2, and offer options for more complex, multi-step electrochemical ET that involve e.g. structural gating, pre-organization in the protein conformational systems, or other overpotential independent elementary steps that could lower the apparent λ-values in the overall process.
A second rationale for small λ-values could be that quinone-to-hydroquinone interconversion involves both ET and PT in an overall PCET process. PCET processes can involve all degrees of coupling between the elementary ET and PT steps.40,41 ET and PT can be independent, vibrationally fully relaxed events, each involving charge transfer and significant environmental reorganization, but the steps are “coupled” in the sense that a given, say ET step affects the kinetic parameters of the subsequent PT step, or vice versa. In the opposite limit ET and PT are fully coupled invoking the character of the quinone-to-hydroquinone conversion as a hydrogen atom transfer process. An electrostatically neutral particle is then transferred, with little solvent reorganization. This expectation also applies when the time sequence between separate ET and PT steps is shorter than the solvent relaxation time (≈10−11 s) in the interfacial electrode surface region. All the limits can be considered in the AQ1 and AQ2 processes, but strong coupling between the ET and PT steps is needed to rationalize the small reorganization energies observed. Reorganization in the intramolecular nuclear modes would not be reflected conspicuously in the i/η correlations, as the appropriate C–C, C–H and O–H modes involve high vibrational frequencies represented by nuclear tunnelling in the pre-exponential factor of the current density forms rather than in the η-dependent activation factors.31
Conclusions
We have synthesized new thiol-derived anthraquinones with both a single (AQ1) and two (AQ2) thiol groups linking the molecules in SAMs to a single-crystal, atomically planar Au(111)-electrode surface via either a single or two Au–S bonds. We have explored the electrochemical SAM behavior using electrochemical techniques particularly CV and EIS. The electrochemical studies addressed voltammetry and EIS of both the quinone and the –SH moieties as well as crucial potential dependent structural reorganization events of the surface bound target molecular SAMs. Overarching objectives were, first to introduce a class of challenging electrochemical probe molecules with prospects as building blocks in new “smart” materials as hybrids with Au-nanoparticles and in other ways. The anthraquinone thiol SAMs on Au(111) electrodes offer, secondly sensitive probes for fundamental structural reorganization studies arising from low single-crystal surface roughness and a direct dependence of redox center proximity to gold on the number of binding sites. The reorganization events can therefore also be probed by potential dependent polarization resistance.Faradaic monolayer CV and EIS analysis based on interfacial capacitance and resistance, and interfacial electrochemical ET rate constants has led to a coherent view of the elementary electrochemical ET processes and other elementary reorganization steps that accompany the conversion between the fully oxidized and fully reduced AQ1 and AQ2 target molecules. It was found, notably that gold–carbonyl group interactions effectively impede formation of semi-quinones, which results in significant reorganization events that can be attributed to specific EC steps. Unexpectedly and also notably, very small apparent λ-values were observed for both AQ1- and AQ2-SAMs, probably associated with the layer rigidity, close proximity of anthraquinone thiols to the electrode surface, as well as strong coupling between the ET and PT steps.
The outcome of the study has disclosed novel features of thiol-derived anthraquinones based on different electrochemical techniques targeting the interactions of both the molecular quinone and the thiol moieties with the single-crystal Au(111)-surfaces. The work offers other steps towards understanding of thiol-derived quinones also bound to gold nanoclusters which may have more direct impact in molecular scale electronics than planar electrode surfaces. The apparently weak electronic-vibrational coupling might here hold advantages by reduced thermal broadening and noise in the electronic functions to be targeted.
Experimental section
Chemicals
All reagents and materials were purchased from well-known chemical suppliers and used without further purification. Aqueous solutions were prepared with freshly deionized water (18.2 MΩ cm resistivity) obtained with the Sartorius ultrapure water system.Synthesis of 2,6-bis(3-hydroxyprop-1-yn-1-yl)anthracene-9,10-dione (3)
The compound was prepared using Sonogashira coupling conditions between a terminal alkyne species and an aryl-bromide. The reaction was performed under inert conditions to prevent undesired homolytic coupling of the terminal alkyne. In an oven-dried, condenser-equipped and degassed round-bottomed flask, containing a magnetic stirring bar, a 1![[thin space (1/6-em)]](https://www.rsc.org/images/entities/char_2009.gif) :
:![[thin space (1/6-em)]](https://www.rsc.org/images/entities/char_2009.gif) 1 solution of tetrahydrofuran (THF, 44 mL) and diisopropylamine (DIPA, 44 mL), the crystalline compounds 2,6-dibromoanthracene-9,10-dione 1 (0.354 mg, 0.968 mmol, 1 equiv.), CuI (9.2 mg, 48.4 μmol, 0.05 equiv.), PdCl2(PPh3)2 (13.6 mg, 19.4 μmol, 0.02 equiv.) and PPh3 (12.7 mg, 48.4 μmol, 0.05 equiv.) were dissolved, followed by 30 minutes of degassing. Propargyl alcohol (170.0 mL, 2.904 mmol, 3 equiv.) was added dropwise to the solution and the reaction mixture was set to stir for 24 h under reflux. The reaction was quenched with H2O (50 mL) followed by three consecutive extractions with Et2O (3 × 25 mL). The organic phase was collected and dried over Na2SO4, filtered and concentrated in vacuo. The remaining grey precipitate was recrystallized in EtOAc and filtered, isolating 3 (232.6 mg, 76%); 1H NMR (400 MHz, DMSO-d6) δ 8.17 (d, J = 8.0 Hz, 3H), 8.09 (t, J = 1.2 Hz, 2H), 7.92 (dd, J = 8.0, 1.7 Hz, 2H), 5.49 (t, J = 6.0 Hz, 2H), 4.39 (d, J = 5.0 Hz, 4H); 13C NMR (101 MHz, DMSO-d6) δ 181.61, 136.96, 133.70, 132.50, 129.41, 128.92, 127.77, 95.53, 82.77, 49.95; MS (ESI) m/z: calcd. for C20H13O4 [M + H]+ 317.1, found 317.2.
1 solution of tetrahydrofuran (THF, 44 mL) and diisopropylamine (DIPA, 44 mL), the crystalline compounds 2,6-dibromoanthracene-9,10-dione 1 (0.354 mg, 0.968 mmol, 1 equiv.), CuI (9.2 mg, 48.4 μmol, 0.05 equiv.), PdCl2(PPh3)2 (13.6 mg, 19.4 μmol, 0.02 equiv.) and PPh3 (12.7 mg, 48.4 μmol, 0.05 equiv.) were dissolved, followed by 30 minutes of degassing. Propargyl alcohol (170.0 mL, 2.904 mmol, 3 equiv.) was added dropwise to the solution and the reaction mixture was set to stir for 24 h under reflux. The reaction was quenched with H2O (50 mL) followed by three consecutive extractions with Et2O (3 × 25 mL). The organic phase was collected and dried over Na2SO4, filtered and concentrated in vacuo. The remaining grey precipitate was recrystallized in EtOAc and filtered, isolating 3 (232.6 mg, 76%); 1H NMR (400 MHz, DMSO-d6) δ 8.17 (d, J = 8.0 Hz, 3H), 8.09 (t, J = 1.2 Hz, 2H), 7.92 (dd, J = 8.0, 1.7 Hz, 2H), 5.49 (t, J = 6.0 Hz, 2H), 4.39 (d, J = 5.0 Hz, 4H); 13C NMR (101 MHz, DMSO-d6) δ 181.61, 136.96, 133.70, 132.50, 129.41, 128.92, 127.77, 95.53, 82.77, 49.95; MS (ESI) m/z: calcd. for C20H13O4 [M + H]+ 317.1, found 317.2.
Synthesis of 2-(3-hydroxyprop-1-yn-1-yl)anthracene-9,10-dione (4)
The compound was prepared using Sonogashira coupling conditions between a terminal alkyne specie and an aryl-bromide. The reaction was performed under inert conditions to prevent undesired homolytic coupling of the terminal alkyne. In an oven-dried, condenser-equipped and degassed round-bottomed flask, containing a magnetic stirring bar, a 1![[thin space (1/6-em)]](https://www.rsc.org/images/entities/char_2009.gif) :
:![[thin space (1/6-em)]](https://www.rsc.org/images/entities/char_2009.gif) 1 solution of THF (36 mL) and DIPEA (36 mL), the crystalline compounds 2-bromoanthracene-9,10-dione 2 (294 mg, 1.03 mmol, 1 equiv.), CuI (9.79 mg, 51.4 μmol, 0.05 equiv.), PdCl2(PPh3)2 (14.4 mg, 20.6 μmol, 0.02 equiv.) and PPh3 (13.48 mg, 51.4 μmol, 0.05 equiv.) were dissolved, followed by 30 minutes of degas. Propargyl alcohol (178.0 μL, 3.09 mmol, 3 equiv.) was added dropwise to the solution and the reaction mixture was set to stir for 48 h under reflux. The reaction was quenched with H2O (50 mL) followed by three consecutive extractions with Et2O (3 × 25 mL). The organic phase was collected and dried over Na2SO4, filtered and concentrated in vacuo. The remaining grey precipitate was recrystallized from EtOAc, washed with heptane and filtered, isolating 4 (179 mg, 66%); 1H NMR (400 MHz, DMSO-d6) δ 8.24–7.78 (m, 7H, ArH), 5.49 (t, J = 5.9 Hz, 1H, CH2OH), 4.39 (d, J = 5.8 Hz, 2H, CCH2OH); 13C NMR (101 MHz, DMSO-d6) δ 182.30, 182.25, 136.91, 135.18, 135.07, 133.67, 133.49, 133.37, 132.61, 129.40, 128.76, 127.73, 127.25, 95.37, 82.80, 49.95; MS (ESI) m/z: calcd. for C17H11O3 [M + H]+ 263.1, found 263.3.
1 solution of THF (36 mL) and DIPEA (36 mL), the crystalline compounds 2-bromoanthracene-9,10-dione 2 (294 mg, 1.03 mmol, 1 equiv.), CuI (9.79 mg, 51.4 μmol, 0.05 equiv.), PdCl2(PPh3)2 (14.4 mg, 20.6 μmol, 0.02 equiv.) and PPh3 (13.48 mg, 51.4 μmol, 0.05 equiv.) were dissolved, followed by 30 minutes of degas. Propargyl alcohol (178.0 μL, 3.09 mmol, 3 equiv.) was added dropwise to the solution and the reaction mixture was set to stir for 48 h under reflux. The reaction was quenched with H2O (50 mL) followed by three consecutive extractions with Et2O (3 × 25 mL). The organic phase was collected and dried over Na2SO4, filtered and concentrated in vacuo. The remaining grey precipitate was recrystallized from EtOAc, washed with heptane and filtered, isolating 4 (179 mg, 66%); 1H NMR (400 MHz, DMSO-d6) δ 8.24–7.78 (m, 7H, ArH), 5.49 (t, J = 5.9 Hz, 1H, CH2OH), 4.39 (d, J = 5.8 Hz, 2H, CCH2OH); 13C NMR (101 MHz, DMSO-d6) δ 182.30, 182.25, 136.91, 135.18, 135.07, 133.67, 133.49, 133.37, 132.61, 129.40, 128.76, 127.73, 127.25, 95.37, 82.80, 49.95; MS (ESI) m/z: calcd. for C17H11O3 [M + H]+ 263.1, found 263.3.
Synthesis of S,S′-((9,10-dioxo-9,10-dihydroanthracene-2,6-diyl)bis(prop-2-yne-3,1-diyl))diethane-thioate (5)
The compound was prepared from 3, using Mitsunobu conditions to carry out a thioesterification of the primary alcohols. In an oven-dried and degassed round-bottomed flask, containing a magnetic stirring bar, 3 (200 mg, 0.63 mmol, 1 equiv.), dry THF (50.4 mL), diethyl azodicarboxylate (DEAD, 40 wt% in toluene, 379.7 μL, 1.26 mmol, 2 equiv.) and PPh3 (328.0 mg, 1.26 mmol, 2 equiv), thioacetic acid (95.2 μL, 1.26 mmol, 2 equiv.) was added and the reaction was left for 48 h. The reaction mixture was concentrated in vacuo followed by purification by flash column chromatography (CH2Cl2), isolating 5 (180 mg, 61%); 1H NMR (400 MHz, DMSO-d6) δ 8.34–8.28 (m, 2H), 7.85–7.77 (m, 2H), 7.73–7.68 (m, 3H), 3.93 (s, 4H), 2.42 (s, 6H). 13C NMR (101 MHz, DMSO-d6) δ 192.70, 135.81, 131.29, 131.19, 130.53, 129.49, 126.33, 29.20, 17.43. IR-characteristic absorptions: 2974, 2831, 2758, 2719, 2488, 2091, 1730, 1593, 1439; MS (ESI) m/z: calcd. for C24H17O4S2 [M + H]+ 433.1, found 433.3.Synthesis of S-(3-(9,10-dioxo-9,10-dihydroanthracen-2-yl)prop-2-yn-1-yl)ethanethioate (6)
The compound was prepared from 4, using Mitsunobu conditions to carry out a thioesterification of the primary alcohol. In an oven-dried and degassed round-bottomed flask, containing a magnetic stirring bar, 4 (113.3 mg, 0.43 mmol, 1 equiv.), dry THF (34.4 mL), DEAD (40 wt% in toluene, 195. 9 μL, 0.65 mmol, 1.5 equiv.) and PPh3 (169.2 mg, 0.65 mmol, 1.5 equiv.), thioacetic acid (49.1 μL, 0.65 mmol, 1.5 equiv.) was added and the reaction was left overnight. The reaction mixture was concentrated in vacuo followed by purification by flash column chromatography (CH2Cl2), isolating 6 (31.3 mg, 23%); 1H NMR (400 MHz, chloroform-d) δ 8.39–7.61 (m, 7H, ArH), 3.93 (s, 2H, CCH2S), 2.65–2.33 (s, 3H, SC(O)CH3); 13C NMR (101 MHz, chloroform-d) δ 193.74, 182.50, 182.46, 136.76, 134.30, 134.21, 133.48, 133.37, 133.34, 132.45, 130.47, 129.07, 127.32, 127.29, 127.26, 89.48, 81.30, 30.23, 18.46; MS (ESI) m/z: calcd. for C19H13O3S [M + H]+ 321.1, found 321.3.Au(111) electrodes and sample preparation procedures
In-house made Clavilier-type bead Au(111) electrodes (ca. 0.04 cm2) were annealed at 850 °C for 8 h. Compounds 5 or 6 were dissolved in 4 mL of isopropanol (0.1 mmol), mixed with 1 mL of 25% NH3 (aq.), and kept in sealed container at 100 °C for 8 h, using a microwave synthesizer (initiator, biotage), in order to remove acetyl groups. Au(111) electrodes were annealed in a hydrogen flame, quenched in ultrapure water saturated with dihydrogen, and further immersed in the solutions containing target compound for ca. 24 h. Finally, the samples were kept for 40 min overall in ethanol and subsequently in ultrapure water, prior to each electrochemical experiment.Instrumentation and electrochemical measurements
Both CV and EIS studies were performed using three-electrode one-compartment glass cells and an Autolab potentiostat/galvanostat (PGSTAT 12, Metrohm) controlled by the Nova 2.0 software. All measurements were performed at room temperature (23 ± 2 °C), using bead Au(111) working electrodes and Pt coiled-wire counter electrodes. The reference electrode was a reversible hydrogen electrode (RHE) (filled with the same supporting electrolyte as in the cell) prepared before each electrochemical experiment. The reported values of the applied potential are shown in Fig. 1 after recalculation to standard hydrogen electrode (SHE). EIS studies were performed at different potentials (from 0.55 to 0 V vs. RHE, ΔE = 0.05 V) in the frequency range of 100 kHz to 0.1 Hz (61 data points per measurement) by using an excitation amplitude of 0.01 V. Before each EIS measurement a constant potential, which corresponded to specific ΔE was applied for 2 min. The Nova 2.0 software was used for the fitting of the impedance spectra. Tafel plots were constructed from selected CV experiments at various scan rates, ranging from 0.005 to 40 V s−1. Prior to each CV or EIS experiment the electrolyte solutions were degassed with Ar gas for 30 min and an Ar atmosphere maintained above the electrolytes for the whole duration of electrochemical experiments. The electrolytes used were the following: 0.1 HClO4 (pH 1), 0.1 M KH2PO4 (pH 4.5), 0.1 M phosphate buffer (pH 7), and 0.1 M NaOH (pH 13). All glassware was cleaned prior each experiment by boiling in 15% HNO3 (aq.) for ca. 20 min.Conflicts of interest
There are no conflicts to declare.Acknowledgements
Financial support from the People Programme (Marie Curie Actions) of the European Union's Seventh Framework Programme (FP7/2007-2013) under REA grant agreement no. 609405 (COFUNDPostdocDTU) is greatly acknowledged (MW). We would like to thank Prof. Richard Nichols, Dr Alex R. Neale and Prof. Laurence J. Hardwick (all from Department of Chemistry, University of Liverpool, UK) for their contributions on surface reflection spectroscopy of the anthraquinone thiol derivatives.References
- R. Jin, C. Zeng, M. Zhou and Y. Chen, Chem. Rev., 2016, 116, 10346–10413 CrossRef CAS PubMed.
- X. Wan, J. Wang, Z. Nan and Q. Wang, Science, 2017, 38, 1–7 Search PubMed.
- T. Albrecht, S. F. L. Mertens and J. Ulstrup, J. Am. Chem. Soc., 2007, 129, 9162–9167 CrossRef CAS PubMed.
- H. Qian, M. Zhu, Z. Wu and R. Jin, Acc. Chem. Res., 2012, 45, 1470–1479 CrossRef CAS PubMed.
- N. Darwish, I. Díez-Pérez, P. Da Silva, N. Tao, J. J. Gooding and M. N. Paddon-Row, Angew. Chem., Int. Ed., 2012, 51, 3203–3206 CrossRef CAS PubMed.
- D. Q. Andrews, G. C. Solomon, R. P. Van Duyne and M. A. Ratner, J. Am. Chem. Soc., 2008, 8815–8820 Search PubMed.
- E. H. Van Dijk, D. J. T. Myles, M. H. Van Der Veen and J. C. Hummelen, Org. Lett., 2006, 8, 2333–2336 CrossRef CAS PubMed.
- N. Darwish, M. N. Paddon-Row and J. J. Gooding, Acc. Chem. Res., 2014, 47, 385–395 CrossRef CAS PubMed.
- B. Schoepp-cothenet, R. Van Lis, A. Atteia, F. Baymann, L. Capowiez, A. Ducluzeau, S. Duval, M. J. Russell and W. Nitschke, Biochim. Biophys. Acta, Bioenerg., 2013, 1827, 79–93 CrossRef CAS PubMed.
- D. J. Schiffrin, Curr. Opin. Electrochem., 2017, 4, 112–117 CrossRef CAS.
- H. Razzaq, R. Qureshi and D. J. Schiffrin, Electrochem. Commun., 2014, 39, 9–11 CrossRef CAS.
- E. Laviron, J. Electroanal. Chem., 1979, 105, 35–42 CrossRef CAS.
- C. Bechelor-McAuley, Q. Li, S. M. Dapin and R. G. Compton, J. Phys. Chem. B, 2010, 114, 4094–4100 CrossRef PubMed.
- M. Quan, D. Sanchez, M. F. Wasylkiw and D. K. Smith, J. Am. Chem. Soc., 2007, 9, 12847–12856 CrossRef PubMed.
- G. S. Shafai, S. Shetty, S. Krishnamurty, V. Shah and D. G. Kanhere, J. Chem. Phys., 2007, 126, 014704 CrossRef PubMed.
- Z. Petrović, M. Metikos-Huković, J. Harvey and S. Omanovic, Phys. Chem. Chem. Phys., 2010, 12, 6590–6593 RSC.
- E. Laviron, J. Electroanal. Chem., 1984, 164, 213–227 CrossRef CAS.
- G. Jürmann, D. J. Schiffrin and K. Tammeveski, Electrochim. Acta, 2007, 53, 390–399 CrossRef.
- C. Zhong, J. Zak and M. D. Porter, J. Electroanal. Chem., 1997, 421, 9–13 CrossRef CAS.
- L. Strong and G. M. Whitesides, Langmuir, 1988, 546–558 CrossRef CAS.
- W. H. Molder, J. H. Sluyters, T. Pajkossy and L. Nyikos, J. Electroanal. Chem., 1990, 285, 103–115 CrossRef.
- B. A. Boukamp, Solid State Ionics, 1986, 20, 31–44 CrossRef CAS.
- E. van Westing, Determination of coating performance with impedance measurements, PhD thesis, Technical University of Delft, 1992.
- M. Wagner, C. Kvarnström, A. Ivaska and J. Bobacka, Electrochim. Acta, 2013, 105, 384–393 CrossRef CAS.
- R. A. Marcus, Can. J. Chem., 1968, 37, 155–163 CrossRef.
- N. S. Hush, Electrochim. Acta, 1968, 13, 1005–1023 CrossRef CAS.
- H. Gerischer, Z. Phys. Chem., 1960, 26, 223–247 CrossRef CAS.
- V. G. Levich, in Adv. Electrochemistry Electrochem. Eng., ed. P. Delahay, Interscience Publ., New York, 1966, vol. 4, pp. 249–371 Search PubMed.
- R. R. Dogonadze and A. M. Kuznetsov, Prog. Surf. Sci., 1975, 6, 1–41 CrossRef CAS.
- A. M. Kuznetsov, Charge Transfer in Chemical Reaction Kinetics, Press Polytechniques et Universitaires Romandes, Lausanne, 1997 Search PubMed.
- A. M. Kuznetsov and J. Ulstrup, Electron Transfer in Chemistry and Biology: An Introduction to the Theory, WILEY-VCH Verlag, 1999 Search PubMed.
- A. M. Kuznetsov, J. Electroanal. Chem., 1983, 151, 227–249 CrossRef CAS.
- M. G. Zakaraya and J. Ulstrup, Opt. Commun., 1988, 68, 107–113 CrossRef CAS.
- P. He, R. M. Crooks and L. R. Faulkner, J. Phys. Chem., 1990, 1135–1141 CrossRef CAS.
- E. Laviron, J. Electroanal. Chem. Interfacial Electrochem., 1974, 52, 355–393 CrossRef CAS.
- J. Liu, S. Chakraborty, P. Hosseinzadeh, Y. Yu, S. Tian, I. Petrik, A. Bhagi and Y. Lu, Chem. Rev., 2014, 114, 4366–4369 CrossRef CAS PubMed.
- S. S. Seyedi, M. M. Waskasi and D. V. Matyushov, J. Phys. Chem. B, 2017, 121, 4958–4967 CrossRef CAS PubMed.
- Q. Chi, J. Zhang, J. E. T. Andersen and J. Ulstrup, J. Phys. Chem. B, 2001, 105, 4669–4679 CrossRef CAS.
- L. J. C. Jeuken, J. P. McEvoy and F. A. Armstrong, J. Phys. Chem. B, 2002, 106, 2304–2313 CrossRef CAS.
- A. M. Kuznetsov and J. Ulstrup, Russ. J. Electrochem., 2004, 40, 1000–1009 CrossRef CAS.
- A. M. Kuznetsov and J. Ulstrup, Proton Transfer and proton Conductivity in Condensed Matter Environment, in Isotope Effects in Chemistry and Biology, Chemical Rubber Company Press, 2006 Search PubMed.
Footnote |
| † Electronic supplementary information (ESI) available: Additional experimental and calculations details. See DOI: 10.1039/c9sc00061e |
| This journal is © The Royal Society of Chemistry 2019 |

