Capture and conversion of carbon dioxide by solar heat localization†
Varun
Kashyap
 a,
Riddhiman
Medhi
b,
Peyman
Irajizad
a,
Parham
Jafari
a,
Masoumeh
Nazari
a,
Ali
Masoudi
a,
Maria D.
Marquez
b,
T. Randall
Lee
a,
Riddhiman
Medhi
b,
Peyman
Irajizad
a,
Parham
Jafari
a,
Masoumeh
Nazari
a,
Ali
Masoudi
a,
Maria D.
Marquez
b,
T. Randall
Lee
 *b and
Hadi
Ghasemi
 *a
*a
aDepartment of Mechanical Engineering, University of Houston, Houston, TX 77204-4006, USA. E-mail: hghasemi@uh.edu
bDepartment of Chemistry and the Texas Center for Superconductivity, University of Houston, Houston, TX 77204-5003, USA. E-mail: trlee@uh.edu
First published on 14th November 2018
Abstract
As the world slowly transitions from conventional fossil fuels to renewable forms of energy, environmentally friendly CO2 capture is urgently needed. Currently, liquid amine and ionic liquid-based systems are utilized for this purpose. However, these forms of capture mostly lead to the formation of stable carbamate salts with high enthalpy of formation, and it is therefore difficult to recover the initial liquid for cyclic operation. Furthermore, amine-based technologies pose concerns including toxic emissions and volatility, while ionic liquid-based systems suffer from complexity of liquid handling and high operational cost. Herein, we report a solid-state sustainable CO2 collector (SCC), which is activated by solar heat localization. This stable cyclic SCC is based on ionic liquids and graphene aerogel, which undergoes solid–liquid phase change to efficiently capture and convert CO2. The SCC captures 0.2 moles of CO2 for every mole of ionic liquid and converts the absorbed CO2 into useful byproducts, including water and calcium carbonate in each cycle. A system prototype of the SCC is developed and demonstrated. The SCC provides a new and promising paradigm to efficiently capture and convert CO2 using abundant solar energy to address global emissions and consequent environmental challenges.
Introduction
Global CO2 emissions have increased at an alarming rate of approximately 40% over the last 10 to 15 years,1 with the rate expected to double by 2050.2 As a consequence, the reduction of environmental CO2 has major implications on the global society,3 and its capture is being viewed as one of the most prominent means of decarbonization. Demands for efficient CO2 capture technologies are driving the exploration of different mechanisms.4 Current commercial technologies employed for CO2 capture include the use of amine-based solvents, mainly monoethanolamine (MEA), diethanolamine, and methyldienthanolamine.5–7 However, these forms of capture lead to the formation of stable carbamate/carbonate salts,8 making it difficult to recover the amine-based solvent for cyclic operation. Furthermore, the large enthalpy of CO2 capture reaction corresponds to highly energy intensive and costly cyclic systems.9,10 Amine-based systems suffer from low CO2 capture capacity,10 toxicity,11 loss of reagent due to evaporation, and equipment corrosion.12 To address these drawbacks, ionic liquids (ILs) are being considered as an alternative for CO2 capture systems.Ionic liquids, which are salts with melting points below 100 °C,10 have gained attention in various fields due to their tunable molecular structures,13 ILs enjoy unique properties such as low volatility, nonflammability, high thermal stability, and high CO2 solubility.14,15 The aforementioned properties have made ILs a desirable alternative to conventional methods of CO2 capture.16,17 Various imidazolium anion-based ILs have been studied, mainly in the liquid state for CO2 capture involving both physisorption and chemisorption.10 In physisorption, the CO2 molecules occupy the intermolecular spaces of the ILs without forming any chemical bonds. Molecular interactions (mainly van der Waals forces) between the CO2 and IL molecules, primarily the anionic part, is the mechanism behind the capture.18 In chemisorption, which is also studied for functionalized cations and anions,19,20 chemical reactions take place between the imidazolium nitrogen and CO2, mainly leading to the formation of carbamate salts. Similar to most amine-based technologies, to reuse ILs after a chemical reaction, it is required to reverse the CO2 absorption and carbamate formation steps, making the process energy intensive and costly. Furthermore, irrespective of the type of absorption, ILs are mainly used in the liquid state, which adds additional complexities including fluid lines, pumps, and other operational structures. As a result, research has been devoted to find methods for efficient and cyclic CO2 capture in the form of solid-state material structures. In this study, a new solid-state approach and the related material paradigm called “sustainable CO2 collector” (SCC), illustrated in Fig. 1, is proposed for CO2 capture and conversion. This approach is cyclic, scalable, energy efficient, and non-toxic. The process also produces beneficial calcium carbonate, which is used in water treatment, manufacturing of cement, plaster, and mortars.21 The SCC structure is comprised of ILs incorporated in a graphene aerogel matrix. To develop a stable material structure, the IL in the SCC exists in the solid state. However, CO2 capture capacity for ILs in the liquid state is higher than that in the solid state. To stimulate solid–liquid phase change, we utilize the concept of solar heat localization. Neumann et al.22 and Ghasemi et al.23 introduced the concept of heat localization at the liquid–vapor interface for solar steam generation. Here, the material structure concentrates the thermal energy (provided by solar irradiation) needed for phase change while minimizing energy losses. Plasmonic nanoparticles and carbon-based material structures were studied to implement this concept.24–26 For heat localization, the material matrix must possess the following properties: high volumetric absorption in the solar spectrum and low thermal conductivity to localize thermal energy. In addition to heat localization for solid–liquid phase change, the material should contain the ionic liquid for CO2 capture. Therefore, the material must possess high permeability to hold large volumes of the ionic liquid, hydrophobicity to avoid the retention of water in the material matrix, and oleophilicity to wet and retain the ionic liquid. Therefore, graphene aerogels were used for the SCC material matrix. Steps 1 and 2 in Fig. 1 show the IL integrated within the graphene aerogel. The process of integration is presented in the ESI.† Due to heat localization, a temperature above the melting point of the IL is reached within the graphene aerogel, thereby facilitating solid–liquid phase change in the IL. In Step 3, CO2 gas is passed through the SCC for absorption. Once the SCC absorbs the CO2 and is no longer exposed to solar irradiation, the IL in the SCC goes back to its solid state as shown in Step 4. In Step 5, the SCC is washed with dilute (0.01 M) Ca(OH)2 solution. The absorbed CO2 in the IL reacts with this solution to form Ca(HCO3)2 filtrate. The Ca(HCO3)2 precipitates out as CaCO3 in Step 6, thereby leaving behind pure water. We emphasize that this cycle is repeatable, and the same SCC can be used to continuously capture CO2 and precipitate CaCO3 as the byproduct. A prototype has been developed to demonstrate the continuous operation of the SCC and is described in the ESI (Fig. S9†). Note that the price of precipitated CaCO3 is ∼$7/kg more than Ca(OH)2 and is also used in a wide range of industries.
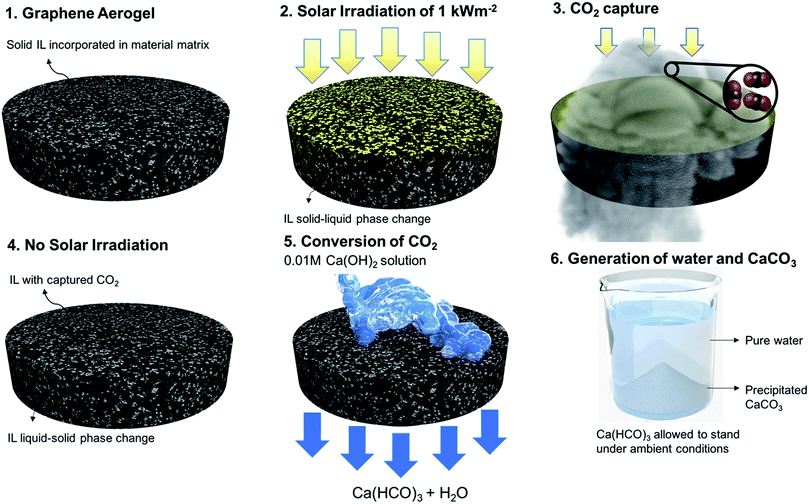 | ||
| Fig. 1 Cyclic CO2 capture and its subsequent conversion to water and CaCO3. Steps 1 and 2 illustrate the structure of the SCC and the solid–liquid phase change initiated by heat localization. Steps 3 and 4 show the capture of CO2 into the SCC. Steps 5 and 6 illustrate the washing and subsequent precipitation of CaCO3. (A video on prototype of this cyclic SCC is shown in Movie S1†). | ||
Results and discussion
Heat localization, effect of phase change, and selection of ILs
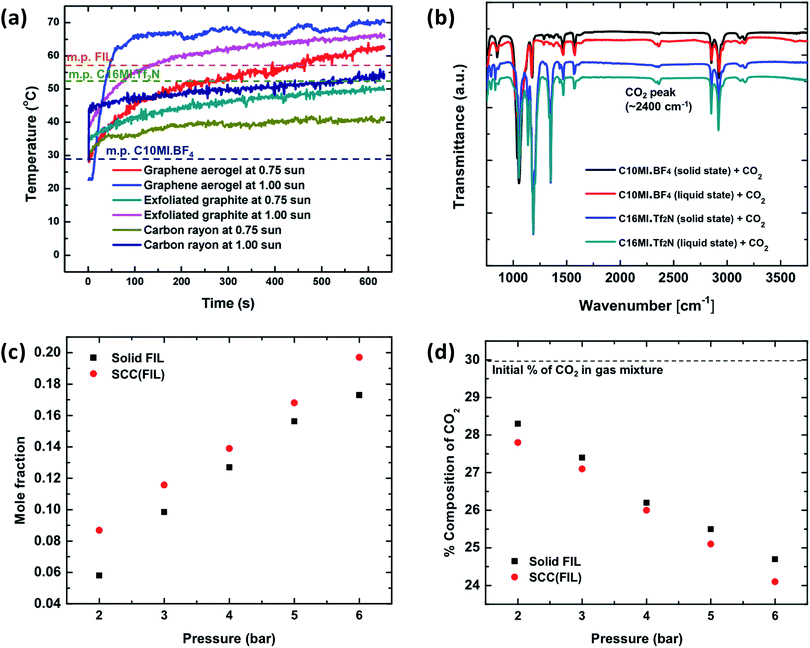
Fig. 2 shows the effect of phase change on CO2 capture in the SCC. To initiate the solid–liquid phase change, graphene aerogel is used for heat localization. Graphene aerogel was synthesized to serve as the matrix material following a previously reported method;27 synthetic details are provided in the ESI.† An optical image of the graphene aerogel is shown in Fig. S1.† To evaluate solar heat localization of the graphene aerogel, we measured its temperature as a function of time under solar irradiation of 1 kW m−2 and 0.75 kW m−2. Furthermore, we compared its solar heat localization with other materials including exfoliated graphite and carbonized rayon. A previously developed experimental setup was used to minimize side heat losses.28Fig. 2a shows the temperature increase as a function of time for these materials under 1 kW m−2 and 0.75 kW m−2 solar irradiation. As shown in the figure, the graphene aerogel at 1 sun solar irradiation reaches a higher temperature (∼70 °C) in comparison to exfoliated graphite and carbon rayon. This provides a wider melting point temperature range for the selection of ILs for the SCC. We therefore chose graphene aerogel as the material matrix to hold the ionic liquid in the SCC.The ILs chosen to be incorporated in graphene aerogel must have a melting point between 30 and 70 °C in order to show solid–liquid phase change under 1 kW m−2 solar illumination and must contain imidazolium-based cations with high molecular weights and fluorinated anions for enhanced CO2 absorption.18 It is also desired to have ILs largely immiscible in water to avoid loss of ILs during the washing process with Ca(OH)2 solution. Miscibility of ILs in water depends on the water-ion interaction strength, degree of fluorination, size of ions (larger fluorinated ions are less miscible) and magnitude of the localized charge in the connecting atom.29 Based on the above properties, two commercial ionic liquids were chosen, C10MI.BF4 and C16MI.Tf2N. The structures of these ionic liquids are shown in Fig. S2.† In addition to commercially available ionic liquids, we demonstrated CO2 capture in ionic liquids with fluorinated cation groups. Fluorination of the cation can significantly improve the CO2 solubility, although to a lesser extent than anion fluorination.30 Fluorination of ionic liquids makes them more selective toward CO2 absorption compared to alkyl chain cations.31 Thus, to achieve enhanced CO2 absorption in our system, we synthesized and utilized an imidazolium ionic liquid having more extensive fluorination than C10MI.BF4 and C16MI.Tf2N, [CF3(CF2)7(CH2)3MI][(CF3CF2SO2)2N], henceforth abbreviated simply as fluorinated ionic liquid (FIL). The synthesis procedure is discussed in the ESI,† and NMR confirmation of the product is provided in Fig. S3.† This ionic liquid has a reported melting point of 56 °C.32 Note that SCC (X) is the general nomenclature used to represent a SCC composed from a specific IL – X, and so forth.
To study absorption of CO2 in ILs in the solid and liquid states, we conducted three different experiments: FT-IR, mole fractions of captured CO2, and percentage change in CO2 composition in the CO2–nitrogen mixture using the gas analyzer. Fig. 2b shows the FT-IR spectra for C10MI.BF4 and C16MI.Tf2N ILs in the solid and liquid states. As shown, the intensity of the peak for CO2 in the liquid sample is significantly higher than that in the solid state. Two separate experimental setups were developed, as described in the ESI (illustrated in Fig. S4 and S5†) to quantify the amount of CO2 captured by the SCC (FIL) with the FIL in the liquid state and in the solid state. In the first experiment, the pressure in the cylindrical high-pressure chamber was maintained between 2 bar and 6 bar for ∼40 minutes. The mole fraction of CO2 captured is shown in Fig. 2c. As shown, there is a difference of ∼18–50% in CO2 capture between FIL and SCC (FIL) depending on the CO2 pressure, suggesting higher capture in the liquid state than that in the solid state. In the second experiment, the change in the percentage composition of CO2 was measured in the CO2–nitrogen mixture using the gas analyzer. Nitrogen is used in the gas mixture to demonstrate the selective absorption of the SCC toward CO2. As shown in Fig. 2d, the change in the CO2 concentration is higher for SCC (FIL) in the liquid state, thereby indicating higher capture compared to FIL (solid state). Note that the percentage of nitrogen remains constant in the mixture. In Fig. 2d, we have studied a mixture of gases (N2 and CO2), but in Fig. 2c, we have analyzed the SCC under pure CO2. Depending on the application, both scenarios might occur.
CO2 capture using the sustainable CO2 collector (SCCs)
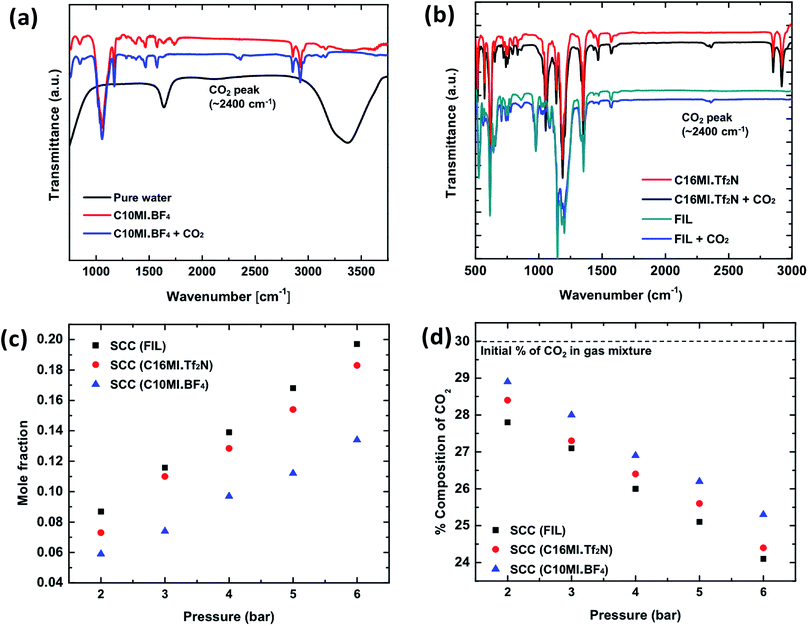
CO2 absorption in the chosen ILs was quantified initially using a FT-IR method. Fig. 3a and b show the FT-IR spectra for ILs C10MI.BF4, C16MI.Tf2N, and FIL after CO2 absorption, wherein a clear peak for CO2 is seen at 2400 cm−1, in accordance with earlier reports of CO2 FT-IR measurements.33 To confirm that the peak is not due to atmospheric CO2, IR measurements were conducted after purging the compartment with nitrogen gas to remove atmospheric CO2. The IR spectrum of pure water was also obtained. Multiple trials consistently revealed a CO2 peak for the IL samples only, verifying the capture of CO2. No changes were observed in the base IL patterns, thereby indicating that the CO2 is absorbed in the ILs via physisorption. Furthermore, analysis of solid C16MI.Tf2N by 13C NMR spectroscopy indicates CO2 absorption as shown in Fig. S6 and S7.†Experimental setups similar to the ones described in the previous section (Fig. S4 and S5†) were also used to quantify CO2 capture in the SCC with the chosen ILs. Fig. 3c shows the mole fraction of CO2 captured as a function of pressure. These experiments were conducted for the SCC (C16MI.Tf2N), SCC (C10MI.BF4), and SCC (FIL) samples. Solar irradiation of 1 sun was incident on the sample to stimulate solid–liquid phase change. The mole fraction of CO2 captured is comparable to values reported in earlier literature for ILs.18 As shown, the capture in SCC (FIL) is slightly higher than SCC (C16MI.Tf2N) due probably to the higher degree of fluorination in the former IL. Fig. 3d shows the percentage drop of CO2 as a function of pressure for SCC (C16MI.Tf2N), SCC (C10MI.BF4), and SCC (FIL). As shown in the figure, the maximum drop in percentage of CO2 in the gas mixture is observed for SCC (FIL). This trend is consistent with the mole fraction of CO2 captured for these ILs. The gas analyzer results confirm the absorption selectivity for CO2 over N2 as predicted based on previous studies.10 Therefore, the selective capture of CO2 in SCCs is confirmed from these experiments.
Conversion of the absorbed CO2 to soluble HCO3−
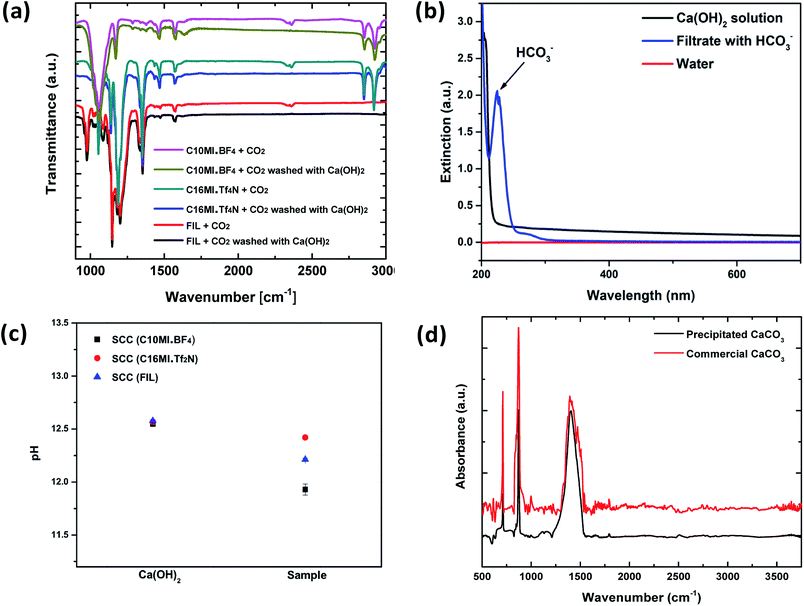
The chemical reactions involved in the reuse of the SCC for multiple cycles and conversion of the absorbed CO2 to precipitated calcium carbonate are described in the ESI.† The reaction of calcium hydroxide with CO2 to form calcium carbonate and calcium bicarbonate is well known.34 Ca(OH)2, commonly called “slaked lime”, primarily produces CaCO3 but forms Ca(HCO3)2 in the presence of excess CO2.35 Both of these reactions are spontaneous.34Solutions having low concentrations of Ca(OH)2 in combination with an excess of CO2 selectively form the soluble Ca(HCO3)2 species that is washed from the SCC. Fig. 4 shows the process of washing the SCC with Ca(OH)2 to obtain precipitated CaCO3. The absorption of CO2 into a Ca(OH)2 solution is more efficient if the concentration of Ca(OH)2 is low.10 This is because lower concentrations of Ca(OH)2 lead to CO2 absorbed in the solution, forming a mixture of mainly soluble bicarbonate ions.34 We used a 0.01 M Ca(OH)2 solution to wash the CO2 out of SCC (FIL). SCC (FIL), being mostly immiscible in water, remains unchanged, while the CO2 is converted to the soluble HCO3− species and is collected in the filtrate. Fig. 4a shows the FT-IR spectra for the disappearance of the CO2 peak at ∼2400 cm−1 after washing the ILs with this Ca(OH)2 solution, confirming the effectiveness of the washing process.
Conversion of the CO2 to soluble HCO3− is confirmed by its presence in the filtrate via UV-vis spectroscopy, as shown in Fig. 4b. Note that the UV-vis spectrum was obtained soon after the SCC was washed with the Ca(OH)2 solution. From these observations, the presence of Ca(HCO3)2 in the filtrate can be confirmed, implying effective washing of the SCC and conversion of the absorbed CO2. We then used an electronic pH meter (Mettler Toledo) with a measuring probe to compare the pH levels between the calcium hydroxide solution before and after washing the CO2-impregnated SCCs. The experiment was conducted for the SCC containing all three different ionic liquids (C10MI.BF4, C16MI.Tf2N, and FIL) for three trials to confirm the reproducibility of the results. A drop in the pH was observed in the filtrate compared to the starting Ca(OH)2 solution used for washing the ionic liquid, as shown in Fig. 4c. This experiment thus implicates the consumption of OH− to form the less basic HCO3− species in solution, responsible for the drop in pH.36
Final conversion to precipitated CaCO3 and reusability of the SCC
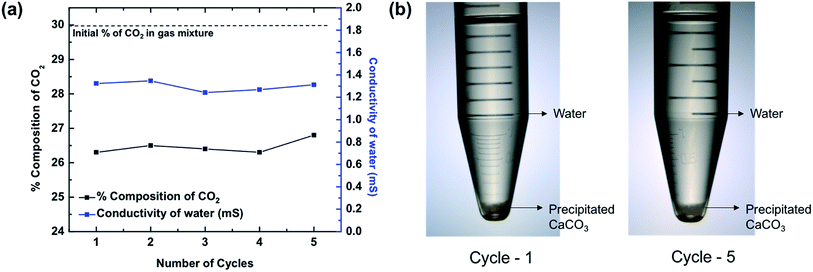
Soluble HCO3− is benign, but it is not the most commercially useful form of carbonate species. A conversion to a more useful product is desired. Precipitated CaCO3 enjoys widespread use in a variety of industries, including paints, plastics, papers, and sealants.21 Therefore, to precipitate CaCO3 from Ca(HCO3)2 solution, the solution was left to stand as reported by earlier studies.37 Once the excess CO2 escapes from the solution, precipitated CaCO3 is left behind, which was verified by the FT-IR spectrum shown in Fig. 4d. The spectrum shows pure CaCO3 as compared to reference spectrum of commercial CaCO3. Although in both cases of SCC (C16MI.Tf2N) and SCC (FIL), we recovered pure CaCO3, in the case of SCC (C10MI.BF4), due to the low solubility of BF4 anions in the water, we detected residual IL, as indicated by the C–H stretching peaks in the FT-IR spectrum in Fig. S10.† Another method to precipitate calcium carbonate is to treat the bicarbonate filtrate with excess Ca(OH)2 solution, which will precipitate out the calcium as calcium carbonate, as per eqn (3) in the ESI.† Optical images for the products of this reaction are shown in Fig. S8.† The final byproducts obtained from the SCC are CaCO3 and water. Note that the number of moles of H2O formed is equal to the number of moles of CO2 absorbed.To confirm the reusability of the SCCs, repeated CO2 absorption and washing over multiple cycles were conducted on SCC (FIL), since this proved to be the most efficient material based on the previous experiments. The gas analyzer set up and protocol (Fig. S5†) was used to evaluate the reusability of the SCC. Fig. 5a shows the plot of percentage composition of CO2 in the resulting mixture as a function of repetition for 4 bar operating pressure. We found that the percentage composition of the final mixture remains constant even after 5 cycles, thereby demonstrating the excellent reusability of the SCCs. Fig. 5a shows the conductivity of water obtained from the reaction after the precipitation of CaCO3. Similar conductivity is observed over five cycles as seen from the graph. Optical images of the byproducts including precipitated CaCO3 and water for the 1st and 5th cycles are shown in Fig. 5b. Furthermore, we should emphasize that the price of precipitated CaCO3 is ∼$7/kg more than Ca(OH)2, which is the initial constituent of the reaction.
Conclusions
In conclusion, we have developed a concept and corresponding material paradigm for reusable CO2 capture while forming extremely useful precipitated CaCO3. Precipitated calcium carbonate has multiple applications including the manufacture of paints, plastics, papers, and sealants. Furthermore, the concept of heat localization with a graphene aerogel matrix was utilized to stimulate solid–liquid phase change, thereby increasing the CO2 capture capacity. The use of solar energy further reduces the energy cost requirements for large scale implementation. We envision our SCC to be used for CO2 capture during flue gas emission and the natural gas sweetening process. CO2 capture in these applications will directly affect CO2 concentration in the atmosphere. The next step for the implementation of this concept is to test the SCC in high pressure flue gas emission sites. We believe this concept and corresponding technology will assist in a smooth transition toward renewable energy sources.Conflicts of interest
A provisional patent is filed with application number 62624333 in USPTO.Acknowledgements
The authors gratefully acknowledge funding support from the Air Force Office of Scientific Research (Grant AFOSR FA9550-16-1-0248, H. G.) with Dr Ali Sayir as program manager, Air Force Office of Scientific Research (Grant AFOSR FA9550-18-1-0094, T. R. L.), the Robert A. Welch Foundation (E-1320, T. R. L.) and the Texas Center for Superconductivity at the University of Houston (TcSUH, T. R. L.). They thank Dr Jiming Bao of the University of Houston for help with FTIR measurements, Dr Scott Smith for help with NMR measurements, and Abdullah Al-Bayati and Carlin Ashford for help with synthesis of graphene aerogels.References
- IEA, CO2 emissions from fuel combustion: Highlights. Outlook, 2010, vol. 38, pp. 1–134 Search PubMed.
- International Energy Agency, Energy Technology Perspectives: Scenarios & Strategies To 2050, 2010 Search PubMed.
- IPCC, Climate Change 2007 Synthesis Report, 2007 Search PubMed.
- A. D. Ritter and J. A. Ebner, Sep. Sci. Technol., 2009, 44, 1273–1421 CrossRef.
- J. D. Figueroa, T. Fout, S. Plasynski, H. McIlvried and R. D. Srivastava, Int. J. Greenhouse Gas Control, 2008, 2, 9–20 CrossRef CAS.
- G. T. Rochelle, Science, 2009, 325, 1652–1654 CrossRef CAS PubMed.
- B. Dutcher, M. Fan and A. G. Russell, ACS Appl. Mater. Interfaces, 2015, 7, 2137–2148 CrossRef CAS PubMed.
- P. D. Vaidya and E. Y. Kenig, Chem. Eng. Technol., 2007, 30, 1467–1474 CrossRef CAS.
- O. F. Dawodu and A. Meisen, Can. J. Chem. Eng., 1996, 74, 960–966 CrossRef CAS.
- M. Ramdin, T. W. De Loos and T. J. H. Vlugt, Ind. Eng. Chem. Res., 2012, 51, 8149–8177 CrossRef CAS.
- D. M. D'Alessandro, B. Smit and J. R. Long, Angew. Chem., Int. Ed., 2010, 49, 6058–6082 CrossRef PubMed.
- R. Davidson, Clean Coal Cent., 2007, vol. 125 Search PubMed.
- S. Zhang, N. Sun, X. He, X. Lu and X. Zhang, J. Phys. Chem., 2006, 35, 1475–1517 CAS.
- X. X. Zhang, X. X. Zhang, H. Dong, Z. Zhao, S. Zhang and Y. Huang, Energy Environ. Sci., 2012, 5, 6668 RSC.
- J. F. Brennecke and B. E. Gurkan, J. Phys. Chem. Lett., 2010, 1, 3459–3464 CrossRef CAS.
- J. E. Bara, S. Lessmann, C. J. Gabriel, E. S. Hatakeyama, R. D. Noble and D. L. Gin, Ind. Eng. Chem. Res., 2007, 46, 5397–5404 CrossRef CAS.
- B. A. Voss, J. E. Bara, D. L. Gin and R. D. Noble, Chem. Mater., 2009, 21, 3027–3029 CrossRef CAS.
- C. Cadena, J. L. Anthony, J. K. Shah, T. I. Morrow, J. F. Brennecke and E. J. Maginn, J. Am. Chem. Soc., 2004, 126, 5300–5308 CrossRef CAS PubMed.
- E. D. Bates, R. D. Mayton, I. Ntai and J. H. Davis, J. Am. Chem. Soc., 2002, 124, 926–927 CrossRef CAS PubMed.
- B. E. Gurkan, J. C. de la Fuente, E. M. Mindrup, L. E. Ficke, B. F. Goodrich, E. A. Price, W. F. Schneider and J. F. Brennecke, J. Am. Chem. Soc., 2010, 132, 2116–2117 CrossRef CAS PubMed.
- O. A. Jimoh, K. S. Ariffin, H. Bin Hussin and A. E. Temitope, Carbonates Evaporites, 2017, 1–16 CAS.
- O. Neumann, A. S. Urban, J. Day, S. Lal, P. Nordlander and N. J. Halas, ACS Nano, 2013, 7, 42–49 CrossRef CAS PubMed.
- H. Ghasemi, G. Ni, A. M. Marconnet, J. Loomis, S. Yerci, N. Miljkovic and G. Chen, Nat. Commun., 2014, 5, 4449 CrossRef CAS PubMed.
- G. W. Ni, S. H. Zandavi, S. M. Javid, S. V. Boriskina, T. A. Cooper and G. Chen, Energy Environ. Sci., 2018, 1, 1510–1519 RSC.
- H. Song, Y. Liu, Z. Liu, M. H. Singer, C. Li, A. R. Cheney, D. Ji, L. Zhou, N. Zhang, X. Zeng, Z. Bei, Z. Yu, S. Jiang and Q. Gan, Adv. Sci., 2018, 1800222 CrossRef PubMed.
- J. Yang, Y. Pang, W. Huang, S. K. Shaw, J. Schiffbauer, M. A. Pillers, X. Mu, S. Luo, T. Zhang, Y. Huang, G. Li, S. Ptasinska, M. Lieberman and T. Luo, ACS Nano, 2017, 11, 5510–5518 CrossRef CAS PubMed.
- L. M. Xu, G. Y. Xiao, C. B. Chen, R. Li, Y. Y. Mai, G. M. Sun and D. Y. Yan, J. Mater. Chem. A, 2015, 3, 7498–7504 RSC.
- V. Kashyap, A. Al-Bayati, S. M. Sajadi, P. Irajizad, S. H. Wang and H. Ghasemi, J. Mater. Chem. A, 2017, 5, 15227–15234 RSC.
- M. Klahn, C. Stüber, A. Seduraman and P. Wu, J. Phys. Chem. B, 2010, 114, 2856–2868 CrossRef CAS PubMed.
- D. Almantariotis, T. Gefflaut, A. A. H. Pádua, J. Y. Coxam and M. F. Costa Gomes, J. Phys. Chem. B, 2010, 114, 3608–3617 CrossRef CAS PubMed.
- D. Almantariotis, A. S. Pensado, H. Q. N. Gunaratne, C. Hardacre, A. A. H. Pádua, J.-Y. Coxam and M. F. Costa Gomes, J. Phys. Chem. B, 2017, 121, 426–436 CrossRef CAS PubMed.
- H. Ma, B. Chu and B. S. Hsiao, Eur. Polym. J., 2017, 87, 398–405 CrossRef CAS.
- S. U. Rege and R. T. Yang, Chem. Eng. Sci., 2001, 56, 3781–3796 CrossRef CAS.
- S.-J. Han, M. Yoo, D.-W. Kim and J.-H. Wee, Energy Fuels, 2011, 25, 3825–3834 CrossRef CAS.
- a M. Kalinkin, E. V Kalinkina, O. a Zalkind and T. I. Makarova, Inorg. Mater., 2005, 41, 1073–1079 CrossRef CAS.
- Y. G. Bodlaender, Angew. Chem., Int. Ed., 1901, 14, 381–390 CrossRef.
- Y. Kitano, Bull. Chem. Soc. Jpn., 1962, 35, 1973–1980 CrossRef CAS.
Footnote |
| † Electronic supplementary information (ESI) available. See DOI: 10.1039/c8se00546j |
| This journal is © The Royal Society of Chemistry 2019 |

