Temperature dependence of the pitch in chiral lyotropic chromonic liquid crystals
Timothy
Ogolla†
ab,
Robert S.
Paley
b and
Peter J.
Collings
 *ac
*ac
aDepartment of Physics & Astronomy, Swarthmore College, Swarthmore, PA, USA. E-mail: pcollin1@swarthmore.edu; Fax: +1 610 328 7895; Tel: +1 610 328 7791
bDepartment of Chemistry and Biochemistry, Swarthmore College, Swarthmore, PA, USA
cDepartment of Physics and Astronomy, University of Pennsylvania, Philadelphia, PA, USA
First published on 3rd December 2018
Abstract
One of the most simple cases in which chirality at the microscopic level produces a chiral macroscopic structure is the chiral nematic liquid crystal phase. In such a phase, the preferred direction of molecular orientation rotates in helical fashion, with the pitch of the helix in different systems ranging from around 100 nm to as large as can be measured (∼10 mm). For almost all thermotropic and lyotropic liquid crystals, the ordered entities are formed from strong bonds, so the pitch varies in accordance with how the interactions between these largely immutable entities are affected by changing conditions. A unique exception are lyotropic chromonic liquid crystals (LCLCs) that spontaneously form weakly bound assemblies in solution, the size of which depends strongly on experimental parameters. While the temperature dependence of the pitch has been measured for chiral LCLCs formed by short strands of DNA (DNA-LCLCs), such is not the case for chiral LCLCs formed by small molecules. Polarized optical microscopy experiments on small molecule chiral LCLCs reveal the changing assembly size through a temperature dependence of the pitch not typical for many other systems, including the most recent measurements on DNA-LCLCs. In fact, the pitch measurements in small molecule chiral LCLCs strongly increase in value as the temperature is increased and the assemblies shrink in size. Theoretical considerations provide some help in understanding this phenomena, but leave much to be explained.
Introduction
Soft matter systems usually reveal the presence of chiral building blocks by organizing themselves into chiral structures. Liquid crystals are excellent examples of this, with the most simple case being the nematic phase in which the building blocks are orientationally but not positionally ordered. If the building blocks are chiral or if the system contains chiral dopants, the preferred direction of orientation adopts a macroscopic helix, revealing the presence of chirality at the microscopic level. The macroscopic helix is described by its pitch P, the distance over which the preferred direction rotates through 360°. This occurs in thermotropic liquid crystals, which are composed of individual molecules. It also happens in lyotropic liquid crystals, which are formed by a wide variety of viruses, macromolecules, or molecular assemblies in solution.In thermotropic liquid crystals, if chiral dopant molecules are added to non-chiral liquid crystal molecules or if there is an enantiomeric excess of chiral liquid crystal molecules, the inverse pitch is proportional to the chiral dopant concentration or the enantiomeric excess. This simple relation is observed in many cases, (1) as long as the dopant concentration is not too large,1 and (2) for all values of the enantiomeric excess.2 The same is true for most lyotropic liquid crystals for the addition of chiral dopants in disk-like micelles3 and for the concentration of chiral rod-like viruses in solution.4 Exceptions to this rule, i.e., nonlinear relationships between the inverse pitch and the concentration, often include cases in which a helix inversion point or a transition to a smectic phase is nearby. This behavior is best revealed by the strong increase of the pitch as the helix inversion point or smectic transition is approached.5 Otherwise, the pitch only weakly depends on the temperature, with the general trend being that the pitch decreases with increasing temperature.3,5
One important aspect of the systems under discussion is that the ordering entities, the molecules in the case of thermotropic liquid crystals and the macromolecules or molecular assemblies in the case of lyotropic liquid crystals, are bonded together strongly enough that the size of the ordering entity does not change as the temperature is varied. This is absolutely true for thermotropic liquid crystals, and is approximately true for most lyotropic liquid crystals for changes in temperature that are not too large. Hence the change in the pitch due to a change in concentration of the chiral component or a change in temperature reflects how the chiral interactions between the more or less unchanging ordering entities are affected. Since the pitch is determined by the competition between Frank elastic energy terms that resist and favor twist deformation, the general decrease in the pitch as the temperature is increased, for example, reflects the fact that the elastic energy terms resisting twist decrease faster than those favoring twist. Two exceptions to this general trend are the thermotropic liquid crystal CEEC6 and suspensions of the rod-like filamentous bacteriophage fd,7 which show an increasing pitch with increasing temperature.
On the other hand, if the size of the ordering entities depends on temperature strongly enough, then the elastic energy terms may behave differently relative to each other. This is the case for lyotropic chromonic liquid crystals (LCLCs), in which molecules in solution spontaneously form weakly bound anisotropic assemblies that orientationally order at high enough concentrations.8 LCLCs typically form from aqueous solutions of certain plank-shaped molecules with aromatic cores and polar groups on the peripheries. Many dyes and drugs form LCLCs, but short oligomers of nucleic acids (DNA-LCLCs) also behave similarly. The molecules or oligomers in LCLCs tend to stack face-to-face, forming rod-like assemblies that order into a nematic or columnar liquid crystal phase. In equilibrium, the length distribution is statistical and thus extremely broad. As the temperature is increased, the length distribution shifts to shorter assemblies, decreasing the concentration of the longer assemblies and increasing the concentration of the shorter ones. This change in the distribution of assembly size affects the elastic energy terms resisting and favoring twist in a way not possible in thermotropic and most lyotropic liquid crystals. If the elastic energy terms promoting twist decrease faster than the terms resisting twist, the pitch increases with increasing temperature, which is opposite to what is encountered in most thermotropic and lyotropic liquid crystals.
Studies of LCLCs have increased in importance over the last decade because they are aqueous solutions and therefore relevant to biology and medicine. Although a couple of experiments were done on small molecule chiral LCLCs over 30 years ago,9,10 such investigations have increased in number more recently, both with systems composed of small molecule non-chiral LCLCs and chiral dopants,11–14 and with small molecule chiral LCLCs.11,15–17 Interest in DNA-LCLCs, in which the short oligomers of DNA are chiral, has also increased recently.18,19 This report describes experiments measuring the temperature dependence of the pitch for the small molecule non-chiral LCLC disodium cromoglycate (DSCG) doped with various chiral molecules. In all cases, an increase in the pitch with increasing temperature is observed, although the temperature range over which this occurs (just below the transition to the chiral nematic–isotropic coexistence region) varies considerably. In the latest measurement on DNA-LCLCs,19 the pitch decreases as the temperature increases toward the biphasic region, although in an earlier experiment, the pitch increased with increasing temperature for most of the DNA-LCLCs investigated.18 In addition, one experiment on an LCLC composed of small chiral molecules is reported here and shows that it behaves similarly to the doped systems. Certain theoretical ideas suggest that the pitch increases with temperature if achiral hard-core repulsion dominates the chiral attractive interactions,20 which is consistent with the data within 8 K of the boundary with the chiral nematic–isotropic coexistence region. However, this is just one of many theoretical results, most of which apply to chiral entities as opposed to chiral dopants. Nonetheless, the experimental results reported here demonstrate an important difference between small molecule LCLCs and thermotropic and most lyotropic liquid crystals, and even some DNA-LCLCs.
Theory
LCLC assemblies
Several comprehensive reviews of LCLCs have appeared recently.8,21 Perhaps the most unique property of LCLCs is that the size distribution of the assemblies is very sensitive to properties such as concentration and temperature. The most simple model for the assembly process assumes that the free energy change for a molecule to join an assembly is independent of the size of the assembly. This isodesmic assembly process has been examined both by computer simulation22 and experimental investigation,23 with the finding that the isodesmic assumption is not followed exactly, but is close to being true and therefore quite useful due to its simplicity.If the equilibrium constant for a molecule to join an aggregate is denoted by K, the concentration of single molecules ρ1 and the concentration of assemblies with i molecules ρi can be calculated from
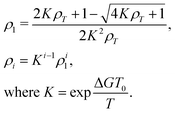 | (1) |
 | (2) |
While the isodesmic assumption produces a model for the assembly process, more is necessary in order to understand the origin of the liquid crystal phases. Early work added a scaled particle calculation of the configurational entropy of hard-rods together with a short-range repulsive potential to ensure system stability.24,25 More recent theoretical investigations tend to rely on computer simulation.22,26–30 This work has helped to provide insight into both the structure of the assemblies and the nematic/columnar phases they form.
Chiral nematic pitch
The free energy associated with distortion of the director of a chiral nematic liquid crystal is given by the Frank free energy, with the energy per unit volume fV given by | (3) |
![[n with combining circumflex]](https://www.rsc.org/images/entities/i_char_006e_0302.gif) is the liquid crystal director, k11, k22, and k33 are the splay, twist, and bend elastic constants, respectively, and k2 is the parameter related to the chirality of the liquid crystal.31 The chirality of the liquid crystal is given by q0, which is equal to k2/k22. The pitch P is related to the chirality by q0 = 2π/P.
is the liquid crystal director, k11, k22, and k33 are the splay, twist, and bend elastic constants, respectively, and k2 is the parameter related to the chirality of the liquid crystal.31 The chirality of the liquid crystal is given by q0, which is equal to k2/k22. The pitch P is related to the chirality by q0 = 2π/P.
The literature discussing the theory of chiral nematic ordering is extensive, but a few examples are included here in anticipation of the experimental results. The seminal work of Straley32,33 involved a statistical mechanical theory of threaded rods based on the Onsager expansion. L is the length of the rod, D is the diameter of the rod, and Δ is the thickness of the thread added to the rod of diameter D. Proportionalities for |k2| and k22 according to this theory are,
| |k2| ∼ ρ2L2DΔS2kBT |
| k22 ∼ ρ2L4DkBT, | (4) |
Experimental procedures
All the amino acids (L-alanine, L-arginine hydrochloride, D-lysine hydrochloride, and trans-4-hydroxy-L-proline) and DSCG were purchased from Sigma-Aldrich and used without further purification. (S)-(−)-2-Aminomethyl-1-ethylpyrrolidine 3,4,9,10-perylenebis(dicarboximide) (chiral-PDI) was synthesized using a modified procedure to that presented by Naidu et al.38 and Kularatne et al.16 3,4,9,10-Perylenetetracarboxylic dianhydride and (S)-(−)-2-aminomethyl-1-ethylpyrrolidine were dissolved in dimethylformamide in a round bottom flask and stirred at 70 °C for 24 hours. After cooling, the reaction mixture was filtered, and the recovered solid was sequentially washed with methanol and then with ethyl acetate. The product was dried under vacuum to obtain chiral-PDI with 94% yield. A proton NMR spectrum was taken in deuterated chloroform to verify the identity of the product. All DSCG mixtures were made with solutions of an amino acid in Millipore water. In order to form the chiral-PDI salt, mixtures of chiral-PDI were made with stoichiometric concentrations of reagent grade hydrochloric acid in Millipore water.The final mixtures were stirred and heated at 60 °C until all the solid dissolved. The same stirring and heating was performed for roughly a half hour before loading the mixture into rectangular or square capillaries by capillary action at 60 °C. The thickness of the rectangular capillaries ranged from 100 to 400 μm. The dimension of the square capillaries was 0.5 or 1.0 mm. Immediately after filling, the capillary was sealed by epoxy and fixed to a microscope slide.
The pitch measurements were done using polarizing optical microscopy (POM) with the sample between two linear polarizers as described by Ogolla et al.13 The angle between the polarizers and the orientation of the sample were adjusted to optimize the brightness and contrast in different regions of the sample. For the amino acid mixtures, the microscope (Leitz Laborlux 12 Pol) was equipped with a camera (Zeis AxioCam ICc 1). Images were taken using ZEN software with either 10× or 25× objectives. A region of interest was specified and an intensity profile generated perpendicular to the parallel striations of the fingerprint texture. The pitch was determined by measuring the average distance between the striations and multiplying by two. The temperature of the sample was controlled by an Instec HC5302 heating stage. For the chiral-PDI sample, a Zeiss Axio Imager 2 microscope with a 50× objective and ZEN software was used with a Linkum LTS420 hot stage.
The sample was allowed to equilibrate for at least 45 minutes at the lowest temperature before starting pitch measurements. At each temperature, the sample equilibrated for at least 8 minutes before measuring the pitch. When the pitch was large, often the planar texture was present instead of the fingerprint texture. Because the fingerprint texture was still observed for long pitches in square capillaries, these were used when necessary. In this way, pitch measurements were performed as the temperature approached the chiral nematic–isotropic coexistence region and the pitch became large. Measurements were made for all temperatures up to and including TC, the temperature at which droplets of the isotropic phase first appeared.
Experimental results
The temperature dependent pitch measurements are shown in Fig. 1 for 16 wt% DSCG in seven amino acid solutions. As reported in Ogolla et al.,13TC is not sensitive to the chiral dopant concentration except for L-arginine hydrochloride (see Table 1). Notice that for all mixtures, the pitch tends to increase as TC is approached, for some quite modestly, but for most quite dramatically. Notice also that for mixtures with a larger pitch, the pitch increases monotonically as TC is approached. When the pitch is smaller, the pitch decreases with temperature before increasing with temperature close to TC.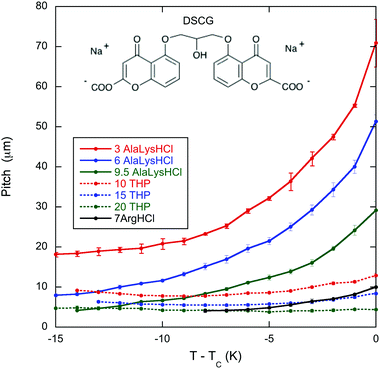 | ||
| Fig. 1 Temperature dependence of the pitch in the chiral nematic phase of 16 wt% DSCG (structure shown) in seven amino acid solutions: 3, 6, and 9.5 wt% of both L-alanine and D-lysine hydrochloride (AlaLysHCl), 10, 15, and 20 wt% of trans-4-hydroxy-L-proline (THP), and 7 wt% of L-arginine hydrochloride (ArgHCl). TC is the temperature of the boundary between the chiral nematic phase and the chiral nematic–isotropic coexistence region and is given in Table 1. The helix in the chiral nematic phase is right-handed for all solutions except ArgHCl which is left-handed.9,10 | ||
| Dopant | Concentration | Temperature (°C) |
|---|---|---|
| None | 0.0 | 31 |
| L-Alanine & D-lysine HCl | 3.0 | 31 |
| L-Alanine & D-lysine HCl | 6.0 | 31 |
| L-Alanine & D-lysine HCl | 9.5 | 30 |
| trans-4-Hydroxy-L-proline | 10.0 | 30 |
| trans-4-Hydroxy-L-proline | 15.0 | 31 |
| trans-4-Hydroxy-L-proline | 20.0 | 30 |
| L-Arginine HCl | 7.0 | 24 |
To make the connection with theory more apparent, the chirality q0 = 2π/P is plotted versus temperature in Fig. 2. Notice that the chirality decreases dramatically as TC is approached for all mixtures except for DSCG in a 20 wt% solution of trans-4-hydroxy-L-proline. The minimum of the pitch (maximum in q0) is quite evident for the trans-4-hydroxy-L-proline mixtures.
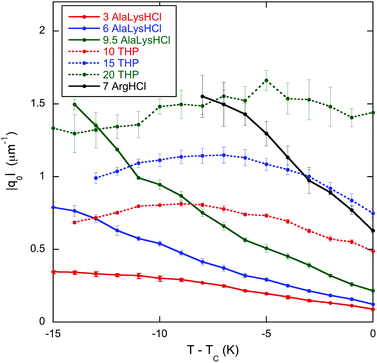 | ||
| Fig. 2 Temperature dependence in the chiral nematic phase of the chirality q0= 2π/P for 16 wt% DSCG in seven solutions of amino acids. The labels are the same as in Fig. 1. TC is the temperature of the boundary between the chiral nematic phase and the chiral nematic–isotropic coexistence region and is given in Table 1. | ||
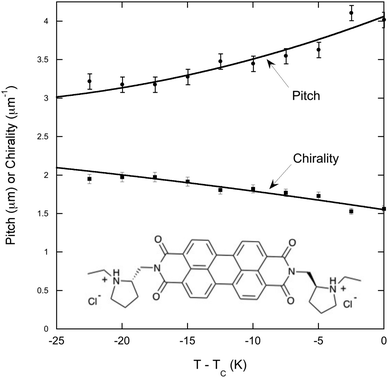
In order to compare chiral doped LCLCs with chiral LCLCs, the investigation included a single experiment on chiral-PDI. The pitch of 12 wt% chiral-PDI is quite short,15,16 necessitating the need for the more powerful microscope. Even over the wider temperature range investigated, as shown in Fig. 3, the pitch increases and the chirality decreases in much the same way as the shorter pitch mixtures of DSCG in amino acid solutions.
Discussion
The results clearly demonstrate that the pitch increases (and the chirality decreases) near the transition to the chiral nematic–isotropic coexistence region for all the chiral dopants. This is important for the specific case of L-arginine hydrochloride. In an investigation of the helical twisting power of DSCG in various amino acid solutions,13 the helical twisting power increases linearly with chiral dopant concentration for low concentrations of all the amino acids. Whereas many show slight non-linearity at higher concentrations, one amino acid, L-arginine hydrochloride, displays such a nonlinear behavior that it reaches a maximum value of the helical twisting power and decreases as the concentration is increased more. A hint as to the cause of this behavior comes from the fact that the temperature of the transition to the coexistence region decreases as the chiral dopant concentration is increased much more rapidly for L-arginine hydrochloride than all the other chiral dopants investigated. Thus as the L-arginine hydrochloride concentration increases, the measurements at room temperature take place closer and closer to the transition. If the pitch increases as the transition is approached, then the helical twisting power decreases if the pitch is more sensitive to temperature than to concentration. The results presented here for L-arginine hydrochloride confirm this conjecture and allow for a firm conclusion as to the cause of the extreme nonlinearity of the helical twisting power data.Although DSCG with chiral dopants has not been the subject of many investigations, pure DSCG has been extensively investigated. For example, the twist elastic constant k22 has been measured for DSCG,39 so one must ask whether the data on DSCG can be used to analyze the data on DSCG with chiral dopants. As evident from Fig. 4, the k22 data for DSCG show a linear temperature dependence for all concentrations. Notice that the value of k22 at TC is weakly dependent on the DSCG concentration, while the linear dependence on T − TC is stronger. The difference between the doped and pure 16 wt% DSCG solutions is that in the doped samples 3 to 20 wt% is a chiral compound instead of water. Since the shift in TC is less than 1 K for all dopants except arginine hydrochloride (see Table 1), in all likelihood k22 for those doped samples is similar to the pure 16 wt% data in Fig. 4. Supporting evidence for this assertion is the general finding that adding various compounds to DSCG usually does little more than change TC.40–42 Additionally, measurements in another small molecule LCLC, Sunset Yellow FCF, reveal a almost universal function between the order parameter and temperature if S is plotted against T − TC.43 Since |q0| = |k2|/k22, using the |q0| data of Fig. 2 and the k22 data for 16 wt% DSCG from Fig. 4, namely k22 (in pN) = 0.410 − 0.0674(T − TC) with T − TC in K, one can determine the temperature dependence of the chirality parameter |k2| for all the doped systems. This is shown in Fig. 5, where it is clear that |k2| for all dopants strongly decreases as TC is approached. Note that |k2| decreases monotonically for the three THP solutions, even though P and |q0| show non-monotonic temperature dependences. While using the k22 data for pure DSCG brings some uncertainty to the calculated |k2| results, the strong decrease in |k2| is a robust qualitative finding. After all, both |q0| and k22 decrease as the temperature increases. Since |k2| depends on the product of these two quantities, it must decrease more rapidly.
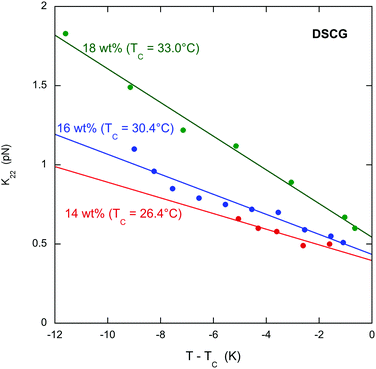 | ||
| Fig. 4 Temperature dependence the twist elastic constant k22 for three concentrations of DSCG (taken from Zhou et al.39). TC is the temperature of the transition from the chiral nematic phase to the chiral nematic–isotropic coexistence region. The lines are least-squares linear fits to the data. | ||
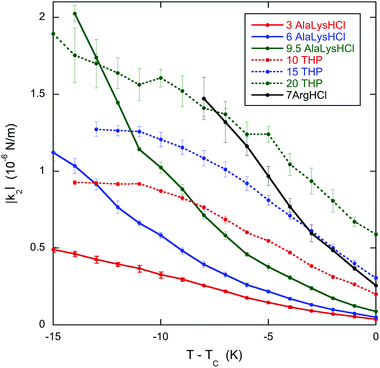 | ||
| Fig. 5 Temperature dependence in the chiral parameter |k2| for 16 wt% DSCG in seven solutions of amino acids. The labels are the same as in Fig. 1. TC is the temperature of the boundary between the chiral nematic phase and the chiral nematic–isotropic coexistence region and is given in Table 1. | ||
As an addendum, it is interesting to note that simple theoretical predictions are qualitatively consistent with the experimental data. According to eqn (4), |k2| should be proportional to ρ2L2S2T. The number density of assemblies ρ in a LCLC is not well defined because of the wide distribution in assembly size. However, an estimate can be obtained by dividing the total DSCG concentration by the average number of molecules in an assembly 〈i〉, calculated from eqn (2) with ΔG equal to 7kBT.44,45 But if 〈i〉 is used as a quantity proportional to the average length of the assemblies, then ρL does not depend on 〈i〉. There have been some temperature-dependent measurements of the order parameter in DSCG, but they are not complete enough for an analysis. It is better to assume that the order parameter is proportional to the birefringence, as is true for the LCLC Sunset Yellow FCF,46 and use the high quality data on the birefringence of DSCG in place of the order parameter.47 This analysis is made more simple by fitting the Haller approximation for the birefringence Δn to the DSCG data,
 | (5) |
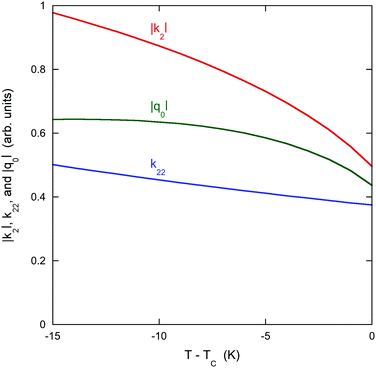 | ||
| Fig. 6 Predictions of eqn (4) for the chiral DSCG system as explained in the text. The vertical scale for each quantity is arbitrary except that the zero for each scale is the same. | ||
De Michele et al.19 make a different prediction in their theory of DNA oligomers. While k22 decreases with increasing temperature near the transition, |k2| increases. This means that |q0| increases with temperature, which is in agreement with the most recent experimental data on short DNA oligomers. The difference between the two theoretical predictions can be traced back to the dependence of |k2| on the length of the assemblies. Whereas by eqn (4) |k2| increases with L if other parameters remain constant, in ref. 19, |k2| decreases with the number of monomers in the assembly. This situation is highlighted in the theory of Dussi et al.36 For certain choices of particle shape, increasing the length of the particle drives q0 through zero. This means that |k2| can both decrease and increase with increasing particle length depending on the detailed shape of the particle, which may explain why both increasing and decreasing |q0| trends were observed by Zanchetta et al.18 for various short DNA oligomers.
Conclusions
Lyotropic chromonic liquid crystals are a unique ordered fluid because the distribution of assembly size depends on concentration and temperature. The results presented here for small molecule LCLCs reveal this uniqueness in the temperature dependence of the pitch in the chiral nematic phase near the transition to the chiral nematic–isotropic coexistence region. This result appears to be quite robust, in that similar behavior is observed in small molecule systems with non-chiral LCLC molecules and chiral dopants and with chiral LCLC molecules. With both similar and opposite behavior having been observed in short oligomers of DNA, and with a good number of theories predicting the possibility of a helix inversion, which might explain why both types of behavior are observed, a full understanding can only come from additional theoretical and experimental research on LCLC systems.Conflicts of interest
The authors declare no conflicts of interest.Acknowledgements
This work was partially supported by the National Science Foundation through the University of Pennsylvania Materials Research Science and Engineering Center (MRSEC), Grant No. DMR11-20901 and DMR17-20530. T. O. acknowledges summer research support from Swarthmore College. All authors thank Sophie Ettinger for help with the more powerful microscope and Angel Martinez and Alexis de la Cotte for useful discussions.Notes and references
- F. Castles and S. Morris, in Handbook of Liquid Crystals, ed. J. W. Goodby, P. J. Collings, C. Tschierske, H. F. Gleeson and P. Raynes, Wiley-VCH, Weinheim, Germany, 2014, vol. 3, ch. 15, pp. 493–520 Search PubMed.
- D. K. Yang and P. P. Crooker, Phys. Rev. A: At., Mol., Opt. Phys., 1987, 35, 4419–4423 CrossRef CAS.
- K. Hiltrop, in Chirality in Liquid Crystals, ed. H. S. Kitzerow and C. Bahr, Springer-Verlag, New York, 2001, ch. 14, pp. 447–480 Search PubMed.
- E. Grelet and S. Fraden, Phys. Rev. Lett., 2003, 90, 198302 CrossRef PubMed.
- I. Dierking, Symmetry, 2014, 6, 444–472 CrossRef.
- T. Harada and P. Crooker, Mol. Cryst. Liq. Cryst., 1975, 30, 79–86 CrossRef CAS.
- Z. Dogic and S. Fraden, Langmuir, 2000, 16, 7820–7824 CrossRef CAS.
- J. Lydon, in Handbook of Liquid Crystals, ed. J. W. Goodby, P. J. Collings, C. Tschierske, H. F. Gleeson and P. Raynes, Wiley-VCH, Weinheim, Germany, 2014, vol. 6, ch. 14, pp. 439–483 Search PubMed.
- H. Lee and M. M. Labes, Mol. Cryst. Liq. Cryst., 1982, 84, 137–157 CrossRef CAS.
- H. Lee and M. M. Labes, Mol. Cryst. Liq. Cryst., 1984, 108, 125–132 CrossRef CAS.
- S. Yang, B. Wang, D. Cui, D. Kerwood, S. Wilkens, J. Han and Y. Y. Luk, J. Phys. Chem. B, 2013, 117, 7133–7143 CrossRef CAS PubMed.
- C. Peng and O. D. Lavrentovich, Soft Matter, 2015, 11, 7257–7263 RSC.
- T. Ogolla, S. B. Nashed and P. J. Collings, Liq. Cryst., 2017, 44, 1968–1978 CAS.
- T. Shirai, M. Shuai, K. Nakamura, A. Yamaguchi, Y. Naka, T. Sasaki, N. A. Clark and K. V. Le, Soft Matter, 2018, 14, 1511–1516 RSC.
- L. P. Joshi, PhD thesis, Kent State University, 2009.
- R. Kularatne, H. Kim, M. Ammanamanchi, H. N. Hayenga and T. H. Ware, Chem. Mater., 2016, 28, 8489–8492 CrossRef CAS.
- F. Berride, E. Troche-Pesqueira, G. Feio, E. J. Cabrita, T. Sierra, A. Navarro-Vazquez and M. M. Cid, Soft Matter, 2017, 13, 6810–6815 RSC.
- G. Zanchetta, F. Giavazzi, M. Nakata, M. Buscaglia, R. Cerbino, N. A. Clark and T. Bellini, Proc. Natl. Acad. Sci. U. S. A., 2010, 107, 17497–17502 CrossRef CAS PubMed.
- C. De Michele, G. Zanchetta, T. Bellini, E. Frezza and A. Ferrarini, ACS Macro Lett., 2016, 5, 208–212 CrossRef CAS.
- H. H. Wensink and G. Jackson, J. Chem. Phys., 2009, 130, 234911 CrossRef CAS PubMed.
- P. J. Collings, J. N. Goldstein, E. J. Hamilton, B. R. Mercado, K. J. Nieser and M. H. Regan, Liq. Cryst. Rev., 2015, 3, 1–27 CrossRef CAS.
- F. Chami and M. R. Wilson, J. Am. Chem. Soc., 2010, 132, 7794–7802 CrossRef CAS PubMed.
- L. Joshi, S. W. Kang, D. M. Agra-Kooijman and S. Kumar, Phys. Rev. E: Stat., Nonlinear, Soft Matter Phys., 2009, 80, 041703 CrossRef PubMed.
- M. P. Taylor and J. Herzfeld, Langmuir, 1990, 6, 911–915 CrossRef CAS.
- M. P. Taylor and J. Herzfeld, Phys. Rev. A: At., Mol., Opt. Phys., 1991, 43, 1892–1905 CrossRef.
- P. K. Maiti, Y. Lansac, M. A. Glazer and N. A. Clark, Liq. Cryst., 2002, 29, 619–626 CrossRef CAS.
- T. Kuriabova, M. D. Betterton and M. A. Glaser, J. Mater. Chem., 2010, 20, 10366–10383 RSC.
- M. Walker, A. J. Masters and M. R. Wilson, Phys. Chem. Chem. Phys., 2014, 16, 23074–23081 RSC.
- A. Akinshina, M. Walker, M. R. Wilson, G. J. T. Tiddy, A. J. Masters and P. Carbone, Soft Matter, 2015, 11, 680–691 RSC.
- H. Sidky and J. K. Whitmer, J. Phys. Chem. B, 2018, 121, 6691–6698 CrossRef.
- L. M. Blinov, Structure and Properties of Liquid Crystals, Springer, Heidelberg, 2012, pp. 199–205, 274–275 Search PubMed.
- J. P. Straley, Phys. Rev. A: At., Mol., Opt. Phys., 1973, 8, 2181–2183 CrossRef CAS.
- J. P. Straley, Phys. Rev. A: At., Mol., Opt. Phys., 1976, 14, 1835–1841 CrossRef CAS.
- M. A. Osipov, Il Nuovo Cimento, 1988, 10, 1249–1262 CrossRef.
- E. Frezza, A. Ferrarini, H. B. Kolli, A. Giacometti and G. Cinacchi, Phys. Chem. Chem. Phys., 2014, 16, 16225–16232 RSC.
- S. Dussi, S. Belli, R. van Roij and M. Dijkstra, J. Chem. Phys., 2015, 142, 074905 CrossRef PubMed.
- S. Ruzicka and H. H. Wensink, Soft Matter, 2016, 12, 5205–5213 RSC.
- J. J. Naidu, Y. J. Bae, K. U. Jeong, S. H. Lee, S. Kang and M. H. Lee, Bull. Korean Chem. Soc., 2009, 30, 935–937 CrossRef CAS.
- S. Zhou, K. Neupane, Y. A. Nastishin, A. R. Baldwin, S. V. Shiyanovskii, O. D. Lavrentovish and S. Sprunt, Soft Matter, 2014, 10, 6571–6581 RSC.
- L. Tortora, H. S. Park, K. Antion, D. Finotello and O. D. Lavrentovich, Proc. SPIE, 2007, 6487, 64870I CrossRef.
- L. Tortora, H. S. Park, S. W. Kang, V. Savaryn, S. H. Hong, K. Kaznatcheev, D. Finotello, S. Sprunt, S. Kumar and O. D. Lavrentovich, Soft Matter, 2010, 6, 4157–4167 RSC.
- H. S. Park, S. W. Kang, L. Tortora, S. Kumar and O. D. Lavrentovich, Langmuir, 2011, 27, 4164–4175 CrossRef CAS PubMed.
- K. Nayani, J. Fu, R. Chang, J. O. Park and M. Srinivasarao, Proc. Natl. Acad. Sci. U. S. A., 2017, 114, 3826–3831 CrossRef CAS PubMed.
- A. J. Dickinson, N. D. LaRacuente, C. B. McKitterick and P. J. Collings, Mol. Cryst. Liq. Cryst., 2009, 509, 751–762 CAS.
- D. M. Agra-Kooijman, G. Singh, A. Lorenz, P. J. Collings, H. S. Kitzerow and S. Kumar, Phys. Rev. E: Stat., Nonlinear, Soft Matter Phys., 2014, 89, 062504 CrossRef PubMed.
- V. R. Horowitz, L. A. Janowitz, A. L. Modic, P. A. Heiney and P. J. Collings, Phys. Rev. E: Stat., Nonlinear, Soft Matter Phys., 2005, 72, 041710 CrossRef PubMed.
- Y. A. Nastishin, H. Liu, T. Schneider, V. Nazarenko, R. Vasyuta, S. V. Shiyanovskii and O. D. Lavrentovich, Phys. Rev. E: Stat., Nonlinear, Soft Matter Phys., 2005, 72, 041711 CrossRef PubMed.
Footnote |
| † Present address: Chemical Physics Interdisciplinary Program, Kent State University, Kent, OH, USA. |
| This journal is © The Royal Society of Chemistry 2019 |

