Long-range exciton transport in brightly fluorescent furan/phenylene co-oligomer crystals†
Artur A.
Mannanov
 ab,
Maxim S.
Kazantsev
 *cd,
Anatoly D.
Kuimov
cd,
Vladislav G.
Konstantinov
be,
Dmitry I.
Dominskiy
 be,
Vasiliy A.
Trukhanov
be,
Daniil S.
Anisimov
be,
Nikita V.
Gultikov
b,
Vladimir V.
Bruevich
be,
Vasiliy A.
Trukhanov
be,
Daniil S.
Anisimov
be,
Nikita V.
Gultikov
b,
Vladimir V.
Bruevich
 be,
Igor P.
Koskin
cd,
Alina A.
Sonina
cd,
Tatyana V.
Rybalova
cd,
Inna K.
Shundrina
cd,
Evgeny A.
Mostovich
cd,
Dmitry Yu.
Paraschuk
 *be and
Maxim S.
Pshenichnikov
*a
aOptical Condensed Matter Physics Group, Zernike Institute for Advanced Materials, Rijksuniversiteit Groningen, Nijenborgh 4, Groningen 9747 AG, The Netherlands. E-mail: m.s.pchenitchnikov@rug.nl
bFaculty of Physics & International Laser Center, Lomonosov Moscow State University, Leninskie Gory 1/62, Moscow 119991, Russia. E-mail: paras@physics.msu.ru
cN. N. Vorozhtsov Novosibirsk Institute of Organic Chemistry, Lavrentieva 9, Novosibirsk, 630090, Russia. E-mail: maximkazantsev1988@gmail.com
dNovosibirsk State University, Pirogova 2, Novosibirsk, 630090, Russia
eEnikolopov Institute of Synthetic Polymeric Materials, Russian Academy of Science, Profsoyuznaya 70, Moscow 117393, Russia
First published on 22nd October 2018
Abstract
The design of light-emitting crystalline organic semiconductors for optoelectronic applications requires a thorough understanding of the singlet exciton transport process. In this study, we show that the singlet exciton diffusion length in a promising semiconductor crystal based on furan/phenylene co-oligomers is 24 nm. To achieve this, we employed the photoluminescence quenching technique using a specially synthesized quencher, which is a long furan/phenylene co-oligomer that was facilely implanted into the host crystal lattice. Extensive Monte-Carlo simulations, exciton–exciton annihilation experiments and numerical modelling fully supported our findings. We further demonstrated the high potential of the furan/phenylene co-oligomer crystals for light-emitting applications by fabricating solution-processed organic light emitting transistors.
1. Introduction
Organic highly luminescent semiconductor materials form the basis for modern organic electroluminescent devices such as light-emitting diodes and in future, light-emitting transistors and injection lasers.1–7 The most attractive organic optoelectronic materials combine high luminescence with efficient charge transport.8–12 Along with the charge transport, exciton diffusion is an important fundamental process controlling the performance of organic light-emitting and photovoltaic devices. For instance, in bulk heterojunction photovoltaic devices, photogenerated excitons diffuse to a heterojunction interface in order to dissociate into free charge carriers, which are electrons and holes.13–15 An efficient approach to control and enhance luminescence in modern organic light-emitting devices—material doping by highly fluorescent molecules16–18—relies on exciton diffusion to provide energy transport from the host crystal to the dopant molecule. Higher dopant concentrations generally lead to the enhancement of host-dopant energy transfer,19–21 while low doping levels are required for retaining high charge carrier mobility.21–24 Long-range exciton diffusion in minimally doped organic semiconductors materials paves the way for resolving these mutually exclusive requirements to achieve widely tunable fluorescent properties.17Heteroaryl-containing co-oligomers8,9,25 have demonstrated high potential for use in organic optoelectronics because they exhibit a unique combination of efficient charge transport and high fluorescence efficiency. Particularly, a furan/phenylene co-oligomer, 1,4-bis(5-phenylfuran-2-yl)benzene (hereafter FP5), was recently demonstrated to possess higher solubility, larger charge carrier mobility and higher fluorescence efficiency compared with those of its thiophene analogue.26 Furthermore, organic light-emitting transistors (OLETs) based on single crystal vapor-grown from furan-incorporated thiophene/phenylene oligomers have recently been reported.9 All these studies have placed the exciton transport in FP5 single crystals into the research spotlight as an important mediator between a photon absorbed by the host crystal and a photon emitted by the embedded dopants.
In this study, we determined the exciton diffusion length in furan/phenylene co-oligomer FP5 single crystals by time-resolved volume photoluminescence (PL) quenching. As a quencher, we synthesized a novel highly fluorescent molecule, 5,5′-bis(4-(5-phenylfuran-2-yl)phenyl)-2,2′-bifuran (FP8), which easily embedded into the host crystal lattice and provided efficient host-quencher Förster energy transfer. Experimental PL transients and the spectral red shift at different quencher concentrations were successfully modelled by Monte Carlo (MC) simulations, from which the exciton diffusion length of 24 ± 4 nm was obtained. This value agrees well with the results obtained from exciton–exciton annihilation experiments. A high potential of doped FP5 single crystals for use in optoelectronics was demonstrated by their efficient charge transport and functionality in solution-processed OLETs.
2. Experimental
2.1. FP5 synthesis and purification
The FP5 raw sample was synthesized as described in ref. 27 and purified by a single vacuum sublimation stage (for details see ESI,† Sections S1–S3). For further purification of the raw FP5 sample, two sequential physical vapor transport (PVT) stages were used. The raw powder was sublimed at a temperature of ∼310 °C in a stream (∼100 sccm) of high purity helium in a 13 mm-internal diameter glass tube with a temperature gradient.28 The most distant fraction (presumably the lowest-weight) from the source material was separated and used for the second PVT step, which resulted in purified FP5 powder.2.2. Steady-state optical spectroscopy
UV/Vis spectra of the furan/phenylene co-oligomers in diluted THF solutions (10−5 M) were recorded on a Varian Cary 5000 UV-Vis-NIR spectrophotometer using a 1 cm-thick quartz cuvette. PL spectra were recorded on a Varian Cary Eclipse fluorescence spectrophotometer in a 1 cm-thick quartz cuvette. The PL QY in diluted (10−6 M) THF solution was measured according to a standard procedure: a diluted solution (10−6 M) of perylene in cyclohexane (PL QY = 0.94) was used as the reference standard.29 The steady-state PL spectra and QY of the FP5 single crystals were measured using an integrating sphere (Newport 819C-SL-3.3) optically coupled to a Raman microscope (InVia, Renishaw) at the excitation wavelength of 405 nm (see ref. 26 for technical details).2.3. Crystal growth
For crystal growth, the solvent–antisolvent method was used:30 the purified FP5 was dissolved (0.8 g L−1) in toluene solution of FP8, with the molar ratio of added FP8 corresponding to the target values of 0–0.1% with respect to FP5. The obtained solution was placed in a closed vessel containing isopropanol for 3 days. To grow the purest reference host crystal from the purified FP5 powder, the PVT method (using helium stream of ∼4 sccm and temperature of 225 °C at atmospheric pressure) with a pre-evacuation of the tube down to 5 × 10⁻³ Torr was used to minimize the occurrence of possible oxidation processes.2.4. Time-resolved photoluminescence
Spectroscopic studies were performed on the individually grown crystals, as described in Section 2.3. Time-resolved PL was recorded using a streak camera (C5680, Hamamatsu) combined with a polychromator. The excitation pulses were generated by the doubled output of a Ti:sapphire laser (Coherent Mira); the central wavelength was set at 375 nm to achieve efficient PL excitation of the FP5 single crystal (Fig. S9, ESI, details available in ref. 31). Time-resolved PL spectra of the crystals at room temperature were collected using an inverted microscope (Zeiss Axiovert 100) with a 10×, NA = 0.25 objective. The laser beam was defocused to a diameter of ∼15 μm at the crystal surface to avoid possible photon bleaching and exciton annihilation in the samples (for details, see ESI,† Section S18). In all cases, the apparatus response was ∼20 ps (Gaussian sd width).2.5. Monte-Carlo simulations
Monte-Carlo (MC) simulations were performed as a random walk of excitons in a 3D cubic crystal grid with a subsequent Förster resonant energy transfer (FRET) to the quenchers; the details are reported in ref. 21. The exciton–exciton annihilation process is modelled as follows: if the distance between two excitons becomes shorter than the exciton annihilation radius, one of the excitons immediately disappears (annihilates).2.6. OLET
Organic light-emitting transistor (OLET) samples in the top-contact bottom gate architecture were prepared on n-doped Si/SiO2 substrates used as gate electrodes/dielectrics. Ultrathin crystals grown on the substrate (as described in ref. 32) from raw FP5 powder dissolved in ortho-dichlorobenzene (DCB) were used as the OLET active layer. As reference active layers, vacuum-deposited thin films and PVT single crystals grown from purified FP5 were used. Asymmetric Ca/Au contacts were thermally evaporated on the top of the active layer through a shadow mask. Further details of OLET preparation and characterization are given in ESI,† Section S25.3. Results and discussion
3.1. Choice of quenching technique and quencher molecule
PL quenching-based techniques are among the most common spectroscopic methods for obtaining exciton diffusion length.15,33,34 In these techniques, molecular quenchers are added to the material at different concentrations and the resulting dependence of either time-resolved PL or PL QY (or both) on the average inter-quencher distance allows for the determination of the exciton diffusion length. For the volume PL quenching, a prospective quencher should: (i) be readily embedded into the host crystal with minimal distortions of the crystal structure, and (ii) provide efficient quenching of the host excitons via processes such as FRET. Efficient PL from the quencher is a convenient addition as it allows the matching of the accelerating decay of host PL with the delayed quencher PL.20,21 Earlier we speculated21 that such a prosperous quencher, FP8 (structure shown in Fig. 1a), would be a self-dopant of FP5, i.e., a by-product emerging in minute amounts at the last step of the FP5 synthesis (Suzuki cross-coupling reaction, ESI,† Sections S1–S3). FP8—longer than FP5 linear π-conjugated molecule—should have a red-shifted absorption spectrum, which is beneficial for efficient FRET from FP5 to FP8. Moreover, as FP8 and FP5 have similar molecular structures with alternating furan and phenylene rings, FP8 might co-crystallize with FP5, resulting in homogeneously doped FP5 single crystals so that the quencher is dispersed in the host crystal at the molecular level. For these reasons, we decided to focus our attention to FP8 as a promising quencher of FP5 PL.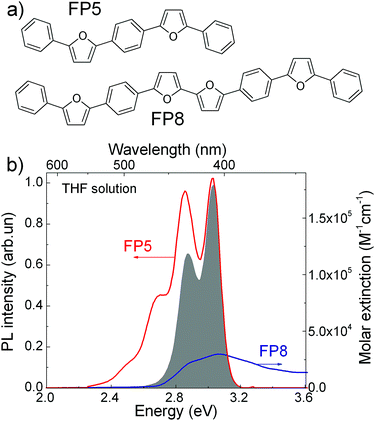 | ||
| Fig. 1 (a) Molecular structure of FP5 and FP8. (b) FP5 (host) PL spectrum (red) and FP8 (quencher) extinction spectrum (blue) in THF solutions. The grey area represents the product of the PL spectrum of the host and absorption spectrum of the quencher required for FRET estimations (ESI,† Section S4). | ||
3.2. Optical properties of host and quencher molecules
FP8 was synthesized in a separate experiment by a combination of an oxidative homocoupling reaction followed by borylation and Suzuki cross-coupling (for the detailed synthesis procedures see ESI,† Sections S1–S3).To reveal the potential of FP8 as a suitable quencher, we recorded optical absorption of FP8 and the PL spectra of FP5 in diluted solutions (Fig. 1b). Substantial spectral overlap of the two spectra provides a good indication that FRET might potentially occur between the host excitons in FP5 single crystal and FP8 quenchers. From the spectral overlap of FP5 and FP8 in diluted solution, the Förster radius in the crystal was estimated as 4.9 ± 0.5 nm (ESI,† Section S4).
3.3. Doping of the host single crystals
Raw FP5 material was self-doped with FP8 at a concentration of ∼0.2%, as measured by PL spectroscopy. To obtain this value, the raw FP5 powder was dissolved in CH2Cl2 (10−3 M), and the PL spectrum of the solution was recorded under excitation at 460 nm (ESI,† Section S5). The concentration of FP8 was then directly obtained from its molar extinction, UV and PL spectra measured in CH2Cl2 (10−6 M).The residual FP8 concentration in the purified FP5 powder (Experimental, Section 2.1) was estimated to be lower than 0.002% (i.e., 20 ppm). This value was obtained from the minimum intensity of the FP8 PL that could still be clearly distinguished from the background FP5 PL (ESI,† Section S5).
We used the purified FP5 powder to grow doped FP5 single crystals by adding FP8 in the prescribed molar ratio (Experimental, Section 2.3). The microscopic images of the individual FP5 single crystals studied are shown in ESI,† Section S6. As the lowest controlled quencher concentration was dictated by the presence of minute (<0.002%) self-dopant content (presumably FP8), the lowest concentration of intentional doping with FP8 was set as 0.01%.
To evaluate whether the FP8 concentration in the crystals corresponds to the intended value (i.e. the one in the parent solution), we used photothermal deflection spectroscopy (PDS) (ESI,† Section S7). The doping level directly measured in the individual crystals depended linearly on the intended FP8 concentration (Fig. S12, ESI,† inset). The one-to-one correspondence between the doping levels in the doped source material and the crystals solution-grown from this material, is in line with the previous report on molecularly self-doped thiophene/phenylene co-oligomer single crystals.21 The PDS data also show that the self-doping level in the purified crystals (i.e., the solution-grown crystals from the purified FP5) was below the PDS detection sensitivity (∼0.01%). Time-resolved PL spectroscopy combined with MC simulations (ESI,† Section S8) revealed that the purified crystals are self-doped with FP8 in a concentration of ∼0.002% (assuming only FP8 as the self-dopant), which is in accordance with the PL data.
For accurate determination of the exciton diffusion length in the FP5 single crystal we needed a reference crystal that is purer than the purified crystals. This was achieved by growing FP5 single crystals from the purified FP5 powder by the PVT method, as described in the Experimental Section 2.3, and referred below as a PVT crystal. An estimate based on time-resolved PL data and MC simulations yielded the self-doping level of <10 ppm (ESI,† Section S8).
To demonstrate smooth embedding of FP8 molecules into the FP5 host matrix, X-ray measurements were performed on the single crystals solution-grown from the purified FP5 and 0.1% doped FP5. The crystal lattice parameters of both crystals appeared to be identical; the parameters also corroborate the previously published data on FP5 single crystal structure.26 Moreover, differential scanning calorimetry demonstrated a single phase in both purified and in 0.1% doped FP5 (ESI,† Section S9). Finally, molecular dynamics simulations (ESI,† Section S10) demonstrated that two head-to-tail host molecules in the FP5 single crystal structure can be substituted by a single FP8 molecule. This substitution results mainly in small torsional/bending deformations and adjustments in positions of FP8, whereas the adjacent host conjugated cores maintain their original positions. The time- and polarization-resolved PL data (ESI,† Section S11) are fully consistent with these conclusions. All these data support our idea that the FP8 molecules are molecularly dispersed in the FP5 single crystal matrix without any noticeable distortion of the FP5 single crystal structure.
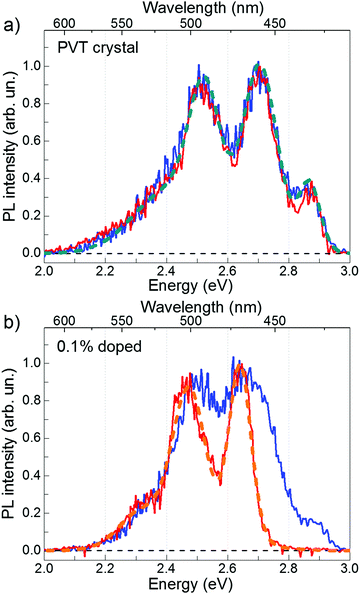
Fig. 2 shows time-resolved PL spectra of the PVT and 0.1%-doped FP5 single crystals at short and long time windows. The PVT-crystal spectrum almost does not change with time (Fig. 2a). In contrast, PL of the 0.1%-doped crystals experiences a considerable spectral shift (Fig. 2b) from a spectrum similar to that of the PVT crystal after the short time window to an entirely different spectrum after a long time window. Our working hypothesis is that the excitation energy is transferred from the host lattice to the quencher material via FRET. Therefore, we assigned the short-time PVT PL spectrum to the host and the long-time 0.1%-doped crystal PL spectrum to the quencher.
3.4. Host PL quenching
Fig. 2 shows that the host and quencher spectra strongly overlap (especially at the red flank), which indicates that the PL transients bear both host and quencher contributions. To factorize their shares, we performed a decomposition of the PL maps for each doped crystal into a linear combination of the PVT and quencher spectra at each delay time (ESI,† Section S13). The reconstructed maps (Fig. S20, ESI†) fully reproduce the experimental maps, which corroborates our hypothesis of the host-dopant energy transfer.Fig. 3 shows the contributions by the host (a) and quencher (b) PL obtained from the decomposition of the PL maps as functions of time delay for variously doped FP5 single crystals. Decay of the host PL accelerates from ∼2.9 to ∼0.25 ns with the increase in doping (Fig. 4). Subsequently, the quencher PL acquires a raising component, whose rise time shortens from 0.45 to 0.25 ns. Shortening of the decay times of the host PL transients and the corresponding rise in the quencher PL transients with doping are fully consistent with the donor–acceptor energy transfer from the host to quenchers within the crystals. Furthermore, the crystals with doping higher than 0.01% demonstrate similar quencher PL decay times of 1.4 ± 0.2 ns, which are considerably shorter than that of the PVT crystal (2.9 ± 0.2 ns), and are therefore attributed to the PL lifetime of the quencher. This result is also in line with the transient red-shifts of PL mean energy, i.e., the energy transfer dynamics from the host to the quenchers (ESI,† Section S8).
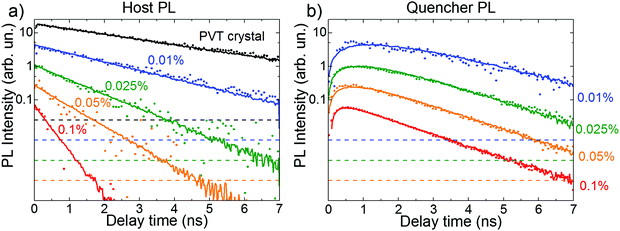 | ||
| Fig. 3 Experimental (dots) and MC simulated (lines) PL transients for the variously doped FP5 single crystals. The experimental PL transients were extracted from decomposition of the PL maps into the host (a) and quencher (b) PL reference spectra (cyan and orange dashed lines in Fig. 2a and b, respectively). Each PL transient is re-scaled by a factor of 4 with respect to the previous one. Dashed lines indicate the 5 × 10⁻³ level with respect to the corresponding maximum of the PL transient. Quencher concentrations are shown next to the respected transients. | ||
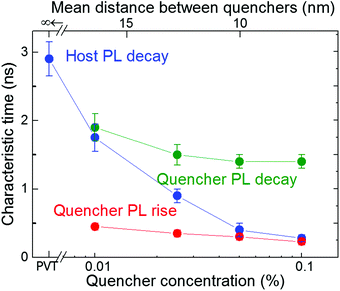 | ||
| Fig. 4 Characteristic PL times for variously doped FP5 single crystals. The decay times (the fastest times in the case of the biexponential behaviour, i.e., for the host PL transient of the 0.1% crystal) of exponential fits from Fig. 3a are depicted as the blue dots, while the decay and rise times of bi-exponential fits from Fig. 3b are shown as the green and red dots, respectively. The vertical bars indicate the uncertainty margins of the exponential fits. The upper axis shows the mean distance between quenchers in the host crystal (for details see ESI,† Section S14). | ||
The characteristic times obtained from mono- or bi-exponential fits of the experimental PL transients are summarized in Fig. 4. The host PL decay time (blue dots) shortens with the increase in quencher concentration, which is consistent with the cross-over regime from unquenched (lifetime of 2.9 ± 0.2 ns) to strongly quenched host PL. At high doping levels, the host PL decay time (blue dots) approaches the quencher PL rise times (red dots) because PL quenching begins to fully determine the host excitation lifetime. The quencher PL decay (green dots) levels off with the increase in doping level, which reflects the dominance of the quencher PL.
3.5. Exciton diffusion length
The host and quencher PL transients obtained from Monte Carlo (MC) simulations are shown in Fig. 3 as solid lines. The simulated and experimental PL transients are in excellent agreement (for the MC parameters, see ESI,† Section S14). The exciton diffusion length amounts to LD = 24 ± 4 nm, as directly calculated from the distributions of exciton diffusion lengths (ESI,† Section S15). This value corresponds to the exciton diffusion coefficient of D = LD2/τ = 2.5 × 10⁻³ cm2 s−1, where τ = 2.9 ns is the exciton lifetime. It should be noted that a commonly-used relationship, 15,33,34 (where l0 = 0.77 nm is the unit cell size in the model, and τhop = 1.5 ps is the exciton hopping time), yields the exciton diffusion length of ∼35 nm, i.e., it overestimates the diffusion length by a factor of 1.5.35 Diffusion lengths for the doped crystals calculated from the host exciton lifetime (Fig. 4) were also systematically overestimated (ESI,† Section S16). To mitigate this problem, the exciton lifetimes should be taken at the ∼0.62 level rather than at the conventional e−1 = 0.37 level.
Singlet exciton diffusion amongst molecules or polymer conjugated segments is controlled by either dipole–dipole or Dexter energy transfers.33,34 Typically, LD is longer for systems with well-ordered tight molecular packing with low energetic disorder.36,37 For single crystals, a large spread of LD ranging from 2.5 to 60 nm for singlet excitons were reported,19,37–39 with the maximum value reported for anthracene.40 (for the list of the singlet exciton diffusion lengths in organic crystals see ESI,† Section S17). It should be noted that ultrafast singlet-to-triplet conversion in anthracene19,41,42 challenges the designation of this value solely due to singlet exciton diffusion. Therefore, the exciton diffusion length in the FP5 single crystal lies at the longest end of the distribution of exciton diffusion lengths for organic semiconductor single crystals and competes with those reported for well-studied single crystals such as naphthalene, anthracene, and tetracene. One particular argument for explaining the long exciton diffusion length in an FP5 single crystal is its intrinsically high torsional rigidity, which results in a significantly lower reorganization energy for exciton transfer as compared with that of its thiophene analogue.43,44
3.6. Exciton–exciton annihilation
A complementary method to study exciton diffusion is exciton–exciton annihilation.14,45,46 This technique is based on creating a high exciton density such that the probability of two diffusing excitons of colliding after some time is not negligible. If such an event occurs, a double-excited electronic state is formed that quickly relaxes back to the single-exciton state. As a result, one exciton is lost for PL (typically via non-radiative channels) and therefore, PL decay accelerates. The exciton annihilation approach does not require any PL quenchers. However, it necessitates the exact knowledge of the exciton density (i.e. the light power, excitation profile, and material absorption), which becomes the main source of (systematic) uncertainty in such experiments.Experimental PL transients in FP5 single crystals for the excitation flux varying in the range of 0.5–50 μJ cm−2 (for the excitation flux estimation see ESI,† Section S18) are shown in Fig. 5a. With an increase in the excitation flux, the PL transient decay times increase, which is ascribed to exciton–exciton annihilation. The share of annihilated excitons is shown in Fig. 5b as a function of initial mean exciton–exciton distance. The share is calculated as a maximal PL yield (i.e., the time integral over the PL transient) without annihilation (i.e. at 0.5 μJ cm−2 flux) minus the PL yield at a given intensity, with the difference normalized to the maximal PL yield. At the strongest excitation flux, the share of annihilated excitons becomes as high as ∼20%.
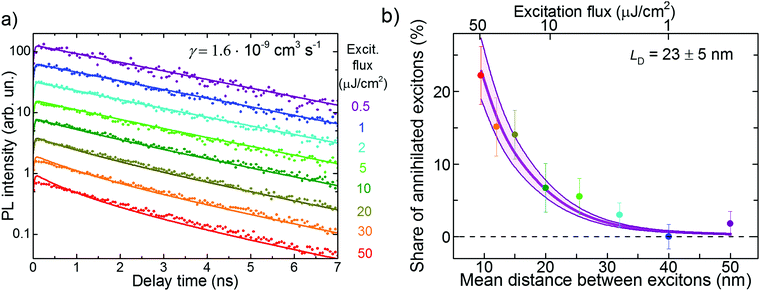 | ||
| Fig. 5 Experimental PL transients (a) and the share of annihilated excitons (b) under various excitation fluxes in the PVT crystal. The lines in panel (a) resulted from a global fit to eqn (1). The details of calculation of the exciton density and the mean distance between the excitons are given in ESI,† Section S19. The thin lines in panel b show the results of the Monte-Carlo simulations. The shaded area in (b) shows the LD uncertainty region. | ||
It is not straightforward to calculate the exciton diffusion length directly from Fig. 5b as exciton–exciton annihilation, being a bimolecular process, depends nonlinearly on the exciton population. Therefore, the experimental PL transients at different excitation intensities shown in Fig. 5a were globally fit to the solution of the kinetic rate equation:19,47
| n(t) = e−t/τ/(1 + n0·γ·τ(1 − e−t/τ)), | (1) |
Alternatively, the diffusion length can be readily obtained from MC simulations in which the exciton–exciton annihilation was incorporated (see ESI,† Section S20). According the diffusion length distribution (ESI,† Fig. S26), the average diffusion length was obtained as LD = 23 ± 5 nm, which was consistent with the value obtained using the analytical approach.
3.7. Doped crystals: PL, charge transport, and OLET
Fig. 6a shows a plot of the exciton diffusion length, LD, as a function of doping level. Long exciton diffusion in a FP5 single crystal provides efficient energy transport from the host crystal to the quenchers. For example, more than half of the host excitons transfer their energy to the quenchers even at a minute doping of 0.01%, and more than 90% of the host excitons are transferred at a doping level of 0.1% (ESI,† Section S21). Fig. 6b demonstrates that the PL QY of FP5 single crystals increases from ∼50% to ∼75% with doping. The exciton energy trapped by FP8 is efficiently reemitted due to the high PL QY of FP8. This allows designing of a material with tunable and bright PL of over ∼40 nm (Fig. 6b).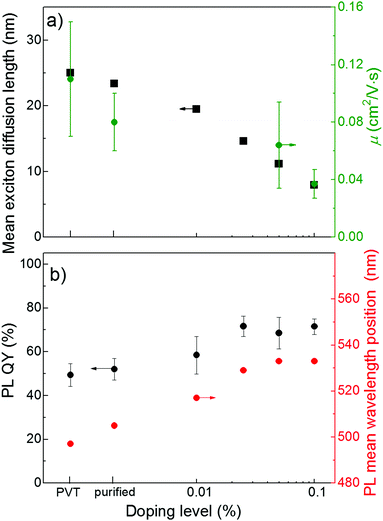 | ||
| Fig. 6 (a) Exciton diffusion length as derived from MC simulations (black) and OFET charge mobility (olive), (b) PL QY (black) and PL mean wavelength position (red) in variously doped FP5 single crystals (for steady-state PL spectra, see ESI,† Section S22). | ||
An important issue is whether the molecular(self) doping affects the charge mobility as it is of the utmost importance for light-emitting devices, such as OLET. Fig. 6a demonstrates the effect of doping on the charge mobility of FP5 single crystals studied for organic field-effect transistors (OFETs, for details, see ESI,† Section S23). With an increase in the doping level up to 0.1%, the hole mobility decreases by a factor of ∼3, while the modulus of the threshold voltage in the solution-grown crystals decreases by a factor of two with doping. In OFETs, the threshold voltage is influenced by the density of deep traps, whereas according to the multiple trap and release model, the shallow traps control the charge mobility.23 Self-doped solution-grown FP5 single crystals were previously reported to have molecularly flat surfaces.26 Thus, taking into account that the energy of the FP8 highest molecular orbital (HOMO) is higher than that of the FP5 host (ESI,† Section S24), we attribute the deterioration of the charge transport properties of the doped crystals to the dopant-induced deep and shallow traps in the transistor channel, as previously reported for molecular self-doped thiophene/phenylene co-oligomer single crystals.21 The difference in the bandgaps of the host and dopant clearly explains the correlation between the decrease in both the charge mobility and the exciton diffusion length with doping (Fig. 6a). Importantly, as shown in Fig. 6b, the PL QY reaches a maximum at a doping of 0.025%, for which the detrimental effects of doping on charge transport is still considered to be insignificant. Such a moderate effect of doping on the charge transport is in line with that described for previously reported thiophene/phenylene co-oligomer single crystals.21
Although furan-containing oligomers appear promising for electroluminescent applications, reports on OLET devices based on these oligomers are rare, possibly because of the known hurdles for achieving effective electron transport in furan-containing oligomers.51 Oniwa et al. fabricated an OLET based on single crystals vapor-grown from a furan-incorporated thiophene/phenylene co-oligomer.9 Herein, we demonstrated the first OLET fabricated using a solution-processed active layer based on a furan-containing oligomer. As reference devices, we fabricated OLET samples with the active layers grown from the vapor phase, namely, vacuum-deposited thin films and PVT single-crystals.
Fig. 7a shows an image of a functioning OLET based on self-doped FP5 single crystals (0.2% doping level), which were grown from a solution of the raw FP5 material directly onto the substrate. The OLET demonstrates unipolar hole transport with light emission observed close to the electron-injecting electrode (Ca, for details, see ESI,† Section S25). OLET devices based on self-doped and purified crystals showed a similar performance, which was presumably limited by the contact effects. The reference devices also showed light emission near the electron-injecting electrode and unipolar hole transport (ESI,† Section S25), with slightly better OLET performance than that of the solution-grown active layers.
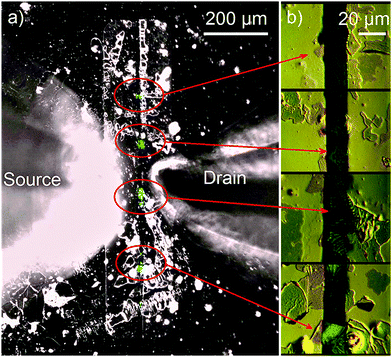 | ||
| Fig. 7 (a) Image of a functioning OLET device based on self-doped solution-grown FP5 single crystals. The image is an overlay of two separate images captured with the backlight (black-and-white) and in the dark (blue) during measuring transfer characteristics (for the separate images, see Fig. S32–S34, ESI†). Light emission (blue colour) originates from the crystals (marked by the red ovals) that are located between the electrodes (vertical stripes). The cones extending from the left and the right are the probes. (b) Microscopy images of the crystals captured in the differential interference contrast mode are shown in panel (b). | ||
4. Conclusions
In conclusion, we measured the singlet exciton diffusion length in 1,4-bis(5-phenylfuran-2-yl)benzene (FP5) single crystals and demonstrated the potential of FP5 in light-emitting applications. We identified a suitable quencher molecule, furan-phenylene 5,5′-bis(4-(5-phenylfuran-2-yl)phenyl)-2,2′-bifuran (FP8), synthesized it separately and demonstrated its facile embedding into the FP5 structure. High-quality FP5 single crystals doped with FP8 up to 0.1% were grown. Using ultrafast PL spectroscopy combined with Monte Carlo simulations, we determined the singlet exciton diffusion length in FP5 single crystal to be as high as 24 ± 4 nm, which is among the highest values for organic semiconductor crystals. This result was independently verified through exciton–exciton annihilation experiments. Remarkably, the long exciton diffusion length allowed the harvesting of majority of the excitons on dopants at doping levels of 10 s of ppm, thus enabling the minimization of the detrimental effect of the dopants on charge transport. Finally, we fabricated solution-processed organic light-emitting transistors based on FP5 single crystals molecularly doped with FP8. All these findings clearly demonstrate the high potential of molecular crystals based on furan-containing oligomers for organic photonics and optoelectronics.Author contributions
MSK, DYuP and MSP conceived, developed and supervised the project. AAM performed the time- and polarization-resolved PL measurements, exciton annihilation experiments, Monte-Carlo and molecular dynamics simulations. MSK, ADK grew the crystals from solution, fabricated, and measured the OFETs. ADK performed the purification of materials by PVT and measurements of their optical properties and doping with the use of optical spectroscopy in solutions. VGK obtained the PL spectra and QYs in the crystals. DID grew the PVT crystals. VAT and DSA assembled and studied the OLET devices. NVG and VVB performed photothermal absorption spectroscopy. IPK performed quantum chemical calculations. AAS and TVR performed the X-ray diffraction experiments. IKS performed thermal analysis. EAM synthesized and characterized the materials. AAM, MSK, DYuP, and MSP wrote the manuscript with contributions from all the authors.Conflicts of interest
There are no conflicts to declare.Acknowledgements
We thank F. de Haan for the Monte-Carlo simulations code and Th. Jansen for useful discussions. The work on materials synthesis, characterization, PL in solution and OFETs was supported by Russian Foundation for Basic Research project 16-33-60011 mol_a_dk. The work on steady-state PL in solid samples and OLET was supported by the Russian Science Foundation (project 18-12-00499); for this, equipment purchased under the Lomonosov Moscow State University Program of Development was partially used. Time-resolved PL experiments and the MC and MD modelling was funded by the Dieptestrategie Programme of the Zernike Institute for Advanced Materials (University of Groningen, the Netherlands). MSK, ADK and EAM acknowledge Novosibirsk State University program “5-100” and Multi-Access Chemical Service Centre of Siberian Branch, Russian Academy of Sciences, for spectral and analytical measurements. MSP received funding from the European Union's Horizon 2020 research and innovation programme under Marie Sklodowska Curie grant agreement No. 722651.Notes and references
- J. Kido, M. Kimura and K. Nagai, Science, 1995, 267, 1332–1334 CrossRef CAS.
- R. H. Friend, R. W. Gymer, A. B. Holmes, J. H. Burroughes, R. N. Marks, C. Taliani, D. D. C. Bradley, D. A. D. Santos, J. L. Brédas, M. Lögdlund and W. R. Salaneck, Nature, 1999, 397, 121–128 CrossRef CAS.
- S. R. Forrest, Nature, 2004, 428, 911–918 CrossRef CAS.
- M. Muccini, Nat. Mater., 2006, 5, 605–613 CrossRef CAS.
- R. Capelli, S. Toffanin, G. Generali, H. Usta, A. Facchetti and M. Muccini, Nat. Mater., 2010, 9, 496–503 CrossRef CAS.
- S. Hotta, T. Yamao, S. Z. Bisri, T. Takenobu and Y. Iwasa, J. Mater. Chem. C, 2014, 2, 965–980 RSC.
- A. J. C. Kuehne and M. C. Gather, Chem. Rev., 2016, 116, 12823–12864 CrossRef CAS.
- S. Hotta and T. Yamao, J. Mater. Chem., 2011, 21, 1295–1304 RSC.
- K. Oniwa, T. Kanagasekaran, T. Jin, M. Akhtaruzzaman, Y. Yamamoto, H. Tamura, I. Hamada, H. Shimotani, N. Asao, S. Ikeda and K. Tanigaki, J. Mater. Chem. C, 2013, 1, 4163–4170 RSC.
- T. Komori, H. Nakanotani, T. Yasuda and C. Adachi, J. Mater. Chem. C, 2014, 2, 4918–4921 RSC.
- J. Gierschner, S. Varghese and S. Y. Park, Adv. Opt. Mater., 2016, 4, 348–364 CrossRef CAS.
- S. K. Park, J. H. Kim, T. Ohto, R. Yamada, A. O. F. Jones, D. R. Whang, I. Cho, S. Oh, S. H. Hong, J. E. Kwon, J. H. Kim, Y. Olivier, R. Fischer, R. Resel, J. Gierschner, H. Tada and S. Y. Park, Adv. Mater., 2017, 29, 1701346 CrossRef.
- C. Brabec, U. Scherf and V. Dyakonov, Organic Photovoltaics: Materials, Device Physics, and Manufacturing Technologies, Wiley-VCH Verlag GmbH & Co. KGaA, Weinheim, Germany, 2011 Search PubMed.
- G. Lanzani, The Photophysics behind Photovoltaics and Photonics, Wiley-VCH, Weinheim, Germany, 2012 Search PubMed.
- G. J. Hedley, A. Ruseckas and I. D. W. Samuel, Chem. Rev., 2017, 117, 796–837 CrossRef CAS.
- C. L. Ho, W. Y. Wong, Q. Wang, D. Ma, L. Wang and Z. Lin, Adv. Funct. Mater., 2008, 18, 928–937 CrossRef CAS.
- T. Kamtekar Kiran, P. Monkman Andrew and R. Bryce Martin, Adv. Mater., 2009, 22, 572–582 CrossRef.
- H. Nakanotani, M. Saito, H. Nakamura and C. Adachi, Adv. Funct. Mater., 2010, 20, 1610–1615 CrossRef CAS.
- R. C. Powell and Z. G. Soos, J. Lumin., 1975, 11, 1–45 CrossRef CAS.
- H. Wang, F. Li, B. Gao, Z. Xie, S. Liu, C. Wang, D. Hu, F. Shen, Y. Xu, H. Shang, Q. Chen, Y. Ma and H. Sun, Cryst. Growth Des., 2009, 9, 4945–4950 CrossRef CAS.
- O. D. Parashchuk, A. A. Mannanov, V. G. Konstantinov, D. I. Dominskiy, N. M. Surin, O. V. Borshchev, S. A. Ponomarenko, M. S. Pshenichnikov and D. Y. Paraschuk, Adv. Funct. Mater., 2018, 28, 1800116 CrossRef.
- S. Z. Bisri, T. Takenobu, T. Takahashi and Y. Iwasa, Appl. Phys. Lett., 2010, 96, 183304 CrossRef.
- V. Podzorov, MRS Bull., 2013, 38, 15–24 CrossRef.
- H. Nakanotani and C. Adachi, Adv. Opt. Mater., 2013, 1, 422–427 CrossRef.
- M. S. Kazantsev, A. A. Beloborodova, A. D. Kuimov, I. P. Koskin, E. S. Frantseva, T. V. Rybalova, I. K. Shundrina, C. S. Becker and E. A. Mostovich, Org. Electron., 2018, 56, 208–215 CrossRef CAS.
- M. S. Kazantsev, E. S. Frantseva, L. G. Kudriashova, V. G. Konstantinov, A. A. Mannanov, T. V. Rybalova, E. V. Karpova, I. K. Shundrina, G. N. Kamaev, M. S. Pshenichnikov, E. A. Mostovich and D. Y. Paraschuk, RSC Adv., 2016, 6, 92325–92329 RSC.
- L. G. Kudryashova, M. S. Kazantsev, V. A. Postnikov, V. V. Bruevich, Y. N. Luponosov, N. M. Surin, O. V. Borshchev, S. A. Ponomarenko, M. S. Pshenichnikov and D. Y. Paraschuk, ACS Appl. Mater. Interfaces, 2016, 8, 10088–10092 CrossRef CAS.
- R. W. I. de Boer, M. E. Gershenson, A. F. Morpurgo and V. Podzorov, Phys. Status Solidi A, 2004, 201, 1302–1331 CrossRef CAS.
- A. Brouwer, Standards for photoluminescence quantum yield measurements in solution (IUPAC Technical Report)*, 2011.
- V. A. Postnikov, Y. I. Odarchenko, A. V. Iovlev, V. V. Bruevich, A. Y. Pereverzev, L. G. Kudryashova, V. V. Sobornov, L. Vidal, D. Chernyshov, Y. N. Luponosov, O. V. Borshchev, N. M. Surin, S. A. Ponomarenko, D. A. Ivanov and D. Y. Paraschuk, Cryst. Growth Des., 2014, 14, 1726–1737 CrossRef CAS.
- M. S. Kazantsev, V. G. Konstantinov, D. I. Dominskiy, V. V. Bruevich, V. A. Postnikov, Y. N. Luponosov, V. A. Tafeenko, N. M. Surin, S. A. Ponomarenko and D. Y. Paraschuk, Synth. Met., 2017, 232, 60–65 CrossRef CAS.
- A. V. Glushkova, E. Y. Poimanova, V. V. Bruevich, Y. N. Luponosov, S. A. Ponomarenko and D. Y. Paraschuk, Organic Field-Effect Transistors XVI, Proc. SPIE, 2017, 10365, 1036504 Search PubMed.
- S. M. Menke and R. J. Holmes, Energy Environ. Sci., 2014, 7, 499–512 RSC.
- O. V. Mikhnenko, P. W. M. Blom and T.-Q. Nguyen, Energy Environ. Sci., 2015, 8, 1867–1888 RSC.
- L. E. de Sousa, D. A. da Silva Filho, R. T. de Sousa and P. H. de Oliveira Neto, Sci. Rep., 2018, 8, 14066 CrossRef.
- H. Bässler, Phys. Status Solidi B, 1993, 175, 15–56 CrossRef.
- R. Lunt Richard, B. Benziger Jay and R. Forrest Stephen, Adv. Mater., 2009, 22, 1233–1236 CrossRef.
- G. Vaubel and H. Baessler, Mol. Cryst. Liq. Cryst., 1970, 12, 47–56 CrossRef CAS.
- J. S. Meth, C. D. Marshall and M. D. Fayer, Solid State Commun., 1990, 74, 281–284 CrossRef CAS.
- B. J. Mulder, Philips Res. Rep., 1967, 22, 142 CAS.
- M. E. Michel-Beyerle, R. Haberkorn, J. Kinder and H. Seidlitz, Phys. Status Solidi B, 1978, 85, 45–49 CrossRef CAS.
- J. Kalinowski, W. Stampor, P. Di Marco and F. Garnier, Chem. Phys., 1998, 237, 233–243 CrossRef CAS.
- I. P. Koskin, E. A. Mostovich, E. Benassi and M. S. Kazantsev, J. Phys. Chem. C, 2017, 121, 23359–23369 CrossRef CAS.
- V. Stehr, R. F. Fink, M. Tafipolski, C. Deibel and B. Engels, Wiley Interdiscip. Rev.: Comput. Mol. Sci., 2016, 6, 694–720 CAS.
- A. Suna, Phys. Rev. B: Solid State, 1970, 1, 1716–1739 CrossRef.
- A. J. Lewis, A. Ruseckas, O. P. M. Gaudin, G. R. Webster, P. L. Burn and I. D. W. Samuel, Org. Electron., 2006, 7, 452–456 CrossRef CAS.
- P. E. Shaw, A. Ruseckas and I. D. W. Samuel, Adv. Mater., 2008, 20, 3516–3520 CrossRef CAS.
- G. R. Fleming, D. P. Millar, G. C. Morris, J. M. Morris and G. W. Robinson, Aust. J. Chem., 1977, 30, 2353–2359 CrossRef CAS.
- S. D. Babenko, V. A. Benderskii, V. I. Goldanskii, A. G. Lavrushko and V. P. Tychinskii, Phys. Status Solidi B, 1971, 45, 91–97 CrossRef CAS.
- J. Dostál, F. Fennel, F. Koch, S. Herbst, F. Würthner and T. Brixner, Nat. Commun., 2018, 9, 2466 CrossRef PubMed.
- A. D. Hendsbee, J.-P. Sun, T. M. McCormick, I. G. Hill and G. C. Welch, Org. Electron., 2015, 18, 118–125 CrossRef CAS.
Footnote |
| † Electronic supplementary information (ESI) available: FP8 synthesis and characterizations; NMR, IR and HRMS spectra of synthesized compounds; optical spectra of FP8, raw and purified FP5; Förster radius calculations; microscope images of FP5 single crystals; photothermal deflection spectroscopy data; transient red-shifts of mean PL energy; thermal analysis; molecular dynamics simulations of FP8 in FP5 single crystal structure; distributions of the energy transport length; calculations of the mean distance between the excitons; steady-state PL spectra in doped crystals; charge transport investigations in doped single crystals; fabrication of organic light-emitting transistors and their investigations. See DOI: 10.1039/c8tc04151b |
| This journal is © The Royal Society of Chemistry 2019 |

