Applications of hydrothermal synthesis of Escherichia coli derived carbon dots in in vitro and in vivo imaging and p-nitrophenol detection†
Kunhao
Qin‡
 ab,
Dongfang
Zhang‡
b,
Yafang
Ding
b,
Xiaodan
Zheng
b,
Yingying
Xiang
c,
Jianhao
Hua
b,
Qi
Zhang
b,
Xiuling
Ji
 b,
Bo
Li
d and
Yunlin
Wei
 *b
*b
aPost-doctoral Research Station in Geological Resources and Geological Engineering, Faculty of Land Resource Engineering, Kunming University of Science and Technology, Kunming 650500, China
bFaculty of Life Science and Technology, Kunming University of Science and Technology, Kunming 650500, China. E-mail: weiyunlin18@163.com
cDepartment of Stomatology, Yan'an Hospital Affiliated to Kunming Medical University, Kunming 650031, China
dFaculty of Land Resource Engineering, Kunming University of Science and Technology, Kunming 650500, China
First published on 23rd October 2019
Abstract
Carbon dots (CDs) have broad prospective applications in various fields, and expanding the applications of fluorescent CDs, especially for CDs derived from bacteria, is a major research goal. In this study, novel CDs derived from Escherichia coli BW25113 (WT) were successfully synthesized via a one-step hydrothermal method. Unlike previously developed CDs-E. coli, CDs-WT can be used for microbial imaging of both live and dead cells. We demonstrated the biocompatibility, excellent penetrability, and nontoxic characteristics of CDs-WT for use as fluorescent probes for bioimaging both in vitro and in vivo. Importantly, we provide the first demonstration of CDs-WT distribution in various organs of mice, including the ability to cross the blood–brain barrier and the potential for rapid excretion through the intestines. Additionally, CDs-WT can be instantly utilized as a fluorescent probe for the highly selective and rapid detection of p-nitrophenol (p-NP) by the inner filter effect, with a limit of detection for p-NP of 11 nM, the lowest value reported to date. Hence, our results demonstrate the feasibility of p-NP detection and extend the bio-imaging applications of CDs prepared from bacteria.
1. Introduction
Carbon dots (CDs) are discrete, quasi-spherical particles with sizes below 10 nm.1 CDs show excellent fluorescence, simple synthesis, low toxicity, good biocompatibility, and low costs.2,3 Numerous studies have evaluated the large-scale synthesis, properties, and applications of CDs.1,4,5 Widespread applications of CDs have been demonstrated, including their use as biosensors, bioimaging probes,2,6 and catalysts. The favorable fluorescence properties of CDs make them useful for application in analytical chemistry, particularly in environmental pollution detection and bioimaging.7,8The increase in industrial pollution worldwide,9,10 including organic pollutants in natural environments, has become a major issue.11,12 To address the unprecedented deterioration of environmental quality, simple, rapid, sensitive, and reliable methods are needed for the real-time monitoring of toxic compound levels. Several analytical methods for the detection of toxic compounds based on biosensors or electrochemistry have been proposed; however, most of these methods are cumbersome, inaccurate, or time-consuming in practical applications.13 CDs may be well-suited for the detection of toxic compounds.12 Based on the rich and varied surface functional groups and outstanding fluorescence characteristics of CDs, various chemical/biological sensors have been developed, such as those for the detection of chemical industrial contaminants [p-nitrophenol (p-NP), 4-chlorophenol (4-CP), phenol, and 2,4,6-trichlorophenol (2,4,6-TCP)].14–16
Furthermore, the good photostability and optical properties as well as the lack of photobleaching or photodegradation make CDs suitable for visualizing organisms both in vitro and in vivo,17,18 as confirmed by many studies.19,20 Yang and coworkers21 established the feasibility of CDs for in vivo imaging in live mice, with detectable bright fluorescence emission. Zhai and colleagues21 revealed that under excitation at 405, 488, and 543 nm, CDs cultivated with cells emit strong blue, green, and red fluorescence, respectively. Therefore, CDs show great potential for cell imaging, bacteria imaging, and labeling as biocompatible fluorescent nanomaterials.7
Various biomass types have been used as precursors and carbon sources to synthesize fluorescent CDs for sensing, drug delivery, and bioimaging.5 However, few studies have examined the synthesis, characteristics, and applications of CDs derived from bacteria.22–24 In the present study, novel CDs were successfully synthesized from E. coli BW25113 (CDs-WT) using a hydrothermal method (200 °C, 12 h). Our approach was based on previous studies in which CDs were synthesized from E. coli by a hydrothermal method at 200 °C for 24 h (CDs-E. coli), enabling selective staining of dead microbial cells.23 The newly developed CDs-WT were able to stain both live and dead microbial cells, and lost the power of microbial live/dead differentiation. An MTT assay showed that CDs-WT have low cytotoxicity (0–200 μg mL−1). Furthermore, the prepared CDs-WT were successfully used as a fluorescent probe for bioimaging both in vitro (microbial and cells) and in vivo (mice), and the data indicate that CDs-WT are biocompatible, have excellent penetrability, are nontoxic, and are rapidly excreted from mice through the intestines. Additionally, further analysis showed that CDs-WT can also be used as a fluorescent probe for highly selective p-NP detection with the lowest limit of detection (LOD) reported to date.
2. Results and discussion
Structural determination
The size and morphology of CDs were characterized by transmission electron microscopy (TEM; FEI Tecnai G2F20, Hillsboro, OR, USA) and X-ray diffraction (XRD; Bruker D8 Advance, Billerica, MA, USA). CDs-WT were nearly spherical with an average diameter of 2.9 nm (Fig. 1a and b). The XRD pattern showed a unique diffraction peak at approximately 22° (Fig. 1c) and was consistent with the interlayer spacing of the graphitic structure.25 The components and surface functionalities were evaluated by X-ray photoelectron spectroscopy (XPS; PHI5000 Versaprobe-II, Kanagawa, Japan). As shown in Fig. 2, C, N, O, and S were detected in CDs-WT with binding energies of 284, 398.4, 530.4, and 160.8 eV, respectively. The C 1s spectrum was resolved into carbon-containing groups, including C![[double bond, length as m-dash]](https://www.rsc.org/images/entities/char_e001.gif) C (283.4 eV), C–O/C–N (284.6 eV), and C
C (283.4 eV), C–O/C–N (284.6 eV), and C![[double bond, length as m-dash]](https://www.rsc.org/images/entities/char_e001.gif) O (286.8 eV). Two peaks were observed in the high-resolution N 1s spectrum and were assigned to nitrogen-containing groups, including N–H (398.4 eV) and N–C (399.2 eV). For the O 1s spectrum, the XPS results showed two distinct peaks assigned to O
O (286.8 eV). Two peaks were observed in the high-resolution N 1s spectrum and were assigned to nitrogen-containing groups, including N–H (398.4 eV) and N–C (399.2 eV). For the O 1s spectrum, the XPS results showed two distinct peaks assigned to O![[double bond, length as m-dash]](https://www.rsc.org/images/entities/char_e001.gif) C and O–C at 529.8 and 530.8 eV.
C and O–C at 529.8 and 530.8 eV.
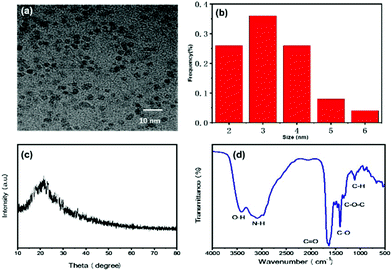 | ||
| Fig. 1 TEM image (a) and the corresponding particle size distribution (b) of CDs-WT. (c) Structure of the CDs-WT determined by XRD. (d) FTIR spectra of dried CDs-WT. | ||
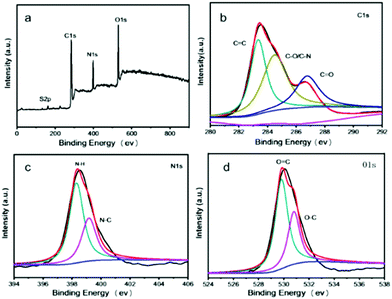 | ||
| Fig. 2 (a) XPS full scan spectrum. High-resolution C1s (b), N1s (c), and O1s (d) spectra of the CDs-WT. | ||
The surface functional groups of CDs-WT were further analyzed by Fourier-transform infrared spectroscopy (FTIR; TENSOR 27 FTIR spectrometer; Bruker) (Fig. 1d). The absorption peak at 2964–3410 cm−1 was attributed to stretching vibrations of O–H and/or N–H. The absorption peak at 1657 cm−1 was identified as the C![[double bond, length as m-dash]](https://www.rsc.org/images/entities/char_e001.gif) O stretching vibration, which may be derived from the amide bond (–CONH–) or –COOH group. A characteristic peak at 1410 cm−1 was labeled as the vibrational absorption band of C–O, a distinct characteristic peak at 1330 cm−1 was due to asymmetric stretching vibrations of C–O–C, and a peak at 1108 cm−1 corresponded to C–H stretching vibrations. These FTIR results were basically consistent with XPS data, indicating that numerous functional groups (such as –OH, –NH2, –COOH, and –CONH–) are found on the surface of CDs-WT, supporting their excellent hydrophilic characteristics and biocompatibility.
O stretching vibration, which may be derived from the amide bond (–CONH–) or –COOH group. A characteristic peak at 1410 cm−1 was labeled as the vibrational absorption band of C–O, a distinct characteristic peak at 1330 cm−1 was due to asymmetric stretching vibrations of C–O–C, and a peak at 1108 cm−1 corresponded to C–H stretching vibrations. These FTIR results were basically consistent with XPS data, indicating that numerous functional groups (such as –OH, –NH2, –COOH, and –CONH–) are found on the surface of CDs-WT, supporting their excellent hydrophilic characteristics and biocompatibility.
Optical properties
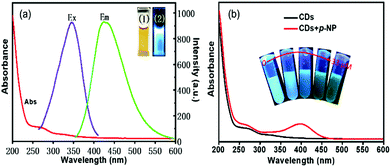
In this work, fluorescence emission spectra (Agilent G9800A, Santa Clara, CA, USA) and UV-Vis absorption were evaluated. These analyses clearly demonstrated (Fig. 3a) that the prepared CDs-WT can be uniformly dissolved in an aqueous solution and emit blue fluorescence under ultraviolet light (365 nm), with an absorption peak at 266 nm in the UV-Vis spectrum. The fluorescence spectra showed a maximum emission peak at 418 nm at the optimal excitation wavelength (338 nm). The quantum yield (QY) of CDs-WT was measured to be 15.8%.To explore the photostability of CDs-WT, the effects of the UV irradiation time, pH, and NaCl concentration on optical stability were evaluated. As is shown in Fig. S1,† the CDs-WT remained stable in the range of 0–2.0 M of NaCl solution (Fig. S1c†). With 3 h of continuous irradiation, the fluorescence intensity changed slightly (Fig. S1b†). Only pH (2–8) affected the emission intensity (Fig. S1a†). These results indicate the good photostability of CDs-WT.
CDs have previously been generated from E. coli (CDs-E. coli) by hydrothermal carbonization.23 A comparison of CDs-WT with CDs-E. coli revealed highly similar characteristics, except for the size (CDs-E. coli: 3.5 nm and CDs-WT: 2.9 nm), excitation wavelength (CDs-E. coli: 332 nm and CDs-WT: 338 nm), and emission wavelength (CDs-E. coli: 416 nm and CDs-WT: 418 nm). Further analyses revealed that CDs-WT were more stable than CDs-E. coli, particularly at low pH values or high inorganic salt concentrations. Under different synthesis conditions (CDs-E. coli: 200 °C for 24 h and CDs-WT: 200 °C for 12 h), two types of CDs were produced, even from the same strain of E. coli. However, further analyses of differences in their behaviors in various practical applications are needed.
Microbial imaging by CDs-WT
CDs-E. coli can selectively stain dead microbial cells (bacteria and fungi) but not live cells due to their highly negative zeta potential and size.23 To determine whether CDs-WT have the capacity to distinguish live/dead cells, Bacillus cereus (B. cereus, bacteria) and Saccharomyces cerevisiae (S. cerevisiae, fungi) were used in this study. After incubation for 2 h, both live and dead cells were stained by CDs-WT with different colors (blue and green fluorescence, respectively) at different excitation wavelengths (Fig. 4), which indicates that CDs-WT cannot distinguish between live and dead cells. The CDs-WT showed no bactericidal properties at a concentration of 50 μg mL−1. According to our results, CDs-WT are novel fluorescent carbon dots that can be used in bio-imaging, and have low cytotoxicity. These results broaden the applications of bacteria-derived CDs for microbial imaging.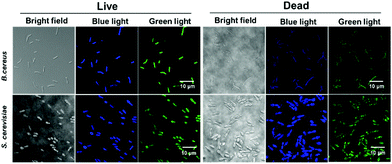 | ||
| Fig. 4 Confocal microscopy images of B. cereus and S. cerevisiae incubated with CDs-WT at different excitation wavelengths. | ||
Bioimaging in vitro
Cytotoxicity limits the applications of CDs in biology. Accordingly, cell viability was evaluated by an MTT assay. Cells without CDs-WT were used as controls, and the relative survival rate of cells cultured with CDs-WT was determined. As shown in Fig. S3†, cell viability was only minimally affected by CDs-WT concentrations up to 200 μg mL−1. Thus, CDs-WT showed low cytotoxicity.Biocompatibility is also an important determinant of the utility of nanomaterials in the field of medical diagnosis. To evaluate this property, HeLa and U2OS cells were employed. Bright-field images showed no changes in the cell morphology after incubation with CDs-WT (50 μg mL−1) (Fig. 6). Images of HeLa and U2OS cells revealed distinct red, green, and blue fluorescence, showing the effectiveness of CDs-WT for imaging in all channels. According to these results, CDs-WT have low cytotoxicity and good biocompatibility and are effective for bioimaging.
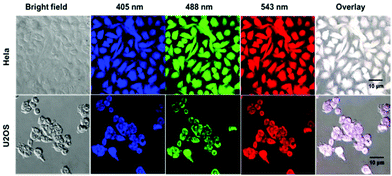 | ||
| Fig. 6 Confocal microscopy images of HeLa and U2OS cells incubated with CDs-WT at different excitation wavelengths. | ||
Biodistribution imaging in vivo
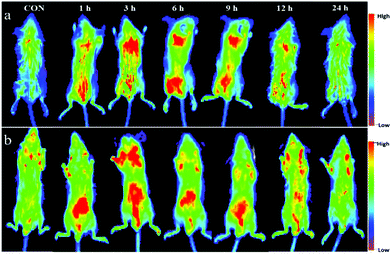
CDs have been employed as contrast agents for biological imaging in vivo. Based on the properties and in vitro cytotoxicity observations of CDs-WT, we further investigated the biodistribution and biocompatibility of CDs-WT using an In vivo FX PRO Bruker imaging station system. As shown in Fig. 7, in vivo imaging was successful, demonstrating that mouse skin and tissues can be effectively permeated by fluorescent CDs-WT. Images were captured at 0, 1, 3, 6, 9, 12, and 24 h. We observed clear and strong fluorescence signals in the intestine, bladder region, and back of mice at 1 h after the injection. After 3 h, fluorescence signals spread across the back, gradually focusing on the thoracic, intestine, and bladder regions. At 6 h, the signals were easily observed mainly in the thoracic region and intestine, with a spot detected in the bladder region. Over time (9 and 12 h after injection), the fluorescence signal intensity gradually weakened in the thoracic region, accumulating in the intestine, eventually disappearing after 24 h. These data illustrate that CDs-WT possess strong biocompatibility and could be rapidly excreted from mice. No animal showed acute toxicological responses during the whole process, indicating that CDs-WT have low or no cytotoxicity.To further explore the biodistribution and excretion pathway of CDs-WT in mice, images of organs were obtained at the four time points (0, 6, 12, and 24 h). As is shown in Fig. 8, strong fluorescence signals were detected in all organs at 6 h and 12 h post-injection, and the fluorescence intensity in each organ gradually decreased over time, consistent with the general imaging results summarized in Fig. 7. Interestingly, strong fluorescence signals were captured in the brains of mice, indicating that the newly prepared CDs-WT could cross the blood brain barrier. Similar phenomena have been reported in previous studies.35,36 We speculate that the smooth crossing of the blood brain barrier by CDs-WT could be explained by the very small size, the large number of functional groups on the surface, and the strong affinity with the endothelial cell membrane of the blood brain barrier. To the best of our knowledge, this is the first demonstration that bacteria-derived CDs can cross the blood brain barrier, providing a potential strategy for the real-time tracking and diagnosis of some brain diseases.
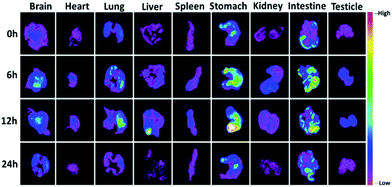 | ||
| Fig. 8 In vivo imaging of male BALB/c mice after the intraperitoneal injection of CDs-WT at different time points. | ||
Moreover, as shown in Fig. 8, fluorescence signals in the stomach and intestine were always stronger than those in the other seven organs (i.e., the lungs, brain, heart, liver, spleen, kidneys, and testicles). Fluorescence signals gradually accumulate in the intestinal tract and move to the lower end of the intestinal tract over time. These results suggested that CDs-WT could be drained from the stomach to the intestine and then excreted in the form of feces. As far as we know, this is the first report which proves that bacteria-derived CDs can be excreted by the gastrointestinal system. This property may be useful for biomedical applications and clinical analyses.
Fluorescence sensing of p-NP using fluorescent CDs-WT as a probe
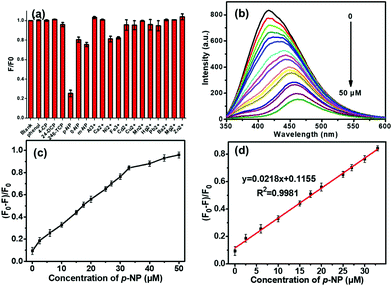
CDs benefit from their low-cost fabrication, high photostability, low toxicity, and excellent optical properties and thus have gained attention for use in p-NP detection. In this study, we examined the quenching effects of 12 cations (Al3+, Ca2+, Ni2+, Fe3+, Cd2+, Cu2+, Mn2+, Hg2+, Pb2+, Ba2+, Mg2+, and Zn2+), 5 common industrial pollutants (phenol, 2,4-DCP, 4-CP, p-NP, and 2,4,6-TCP), and 2 compounds with similar structures to p-NP (M-nitrophenol (m-NP) and O-nitrophenol (o-NP)), 9 common anions (CO32−, Br−, I−, SO42−, SO32−, Cl−, F−, NO3−, and NO2−), and 9 amino acids (tyrosine, aspartic acid, glycine, glutamic acid, tryptophan, methionine, alanine, cystine, and leucine) on CDs-WT fluorescence. Among these, fluorescence was only significantly quenched by p-NP, and other detected substances only caused negligible fluorescence quenching (Fig. 5a and Fig. S4†). The fluorescence quenching efficiency of p-NP (75%) is over 3 times that of m-NP (25%) and o-NP (20%), which may result from the different molecular structures of p-NP, m-NP, and o-NP, leading to the high selectivity of the CDs-WT to p-NP.To improve the fluorescence response to p-NP, we studied the influence of pH on p-NP detection and the response time. Experimental data showed that the fluorescence quenching ability of p-NP by CDs-WT depends on the pH value (2–8) and reaches a maximum when the pH value of the sensing system was 7.0 (Fig. S2a†). As shown in Fig. S2b,† the fluorescence intensity of CDs-WT decreased rapidly after the addition of p-NP, and the reaction was completed after 1 min. The process of p-NP detection was rapid and simple, suggesting that this approach is feasible for detecting p-NP in practical applications.
Various mechanisms, such as surface energy transfer, dynamic quenching, static quenching, fluorescence resonance energy transfer, and an inner filter effect (IFE), can result in the fluorescence quenching of CDs.15 For the fluorescence quenching caused by p-NP, IFE has been observed and can induce a red-shift of the emission wavelength and shift of the absorption wavelength to a long wavelength.37 In this study, on the fluorescence sensing platform established above, different concentrations of p-NP were added to a CDs-WT solution, and the fluorescence intensity of CDs-WT gradually decreased as the concentration of p-NP increased (0–50 μM), accompanied by a significant red-shift from 418 to 460 nm (Fig. 5b). The emission peak of CDs-WT was red-shifted and absorbance shifted to a longer wavelength (400 nm) (Fig. 3b), indicating that the selective detection of p-NP using CDs-WT may occur by the IFE mechanism, consistent with previous reports.26,37,38
Fig. 5d reveals that the fluorescence quenching efficiency was nearly linear (R2 = 0.9981) at p-NP concentrations of 0.02–33 μM (Fig. 4c). The fitted linear equation was y = 0.0218x + 0.1155, where x denotes the concentration of p-NP and y represents the fluorescence quenching efficiency. The limit of detection (LOD) for p-NP was 11 nM, which is the lowest value reported to date. The fluorescence response of CDs-WT for p-NP were comparable to those obtained using some previously reported methods (Table 1). Importantly, the whole detection process can be completed quickly and easily, suggesting that this platform has great potential for p-NP detection in real samples. Our results support the use of CDs-WT as a fluorescent probe for p-NP detection and extend the applications of fluorescent CDs synthesized from E. coli as a carbon source.
| Method | Detection time (min) | Linear range (μM) | LOD (μM) | Ref. |
|---|---|---|---|---|
| Fluorescence | 1 | 0.02–33 | 0.011 | This work |
| Fluorescence | 1 | 0.3–30 | 0.11 | 26 |
| Fluorescence | 1 | 0.05–5 | 0.0138 | 27 |
| Fluorescence | 1 | 0.5–60 | 0.26 | 14 |
| Fluorescence | 2 | 1–40 | 0.34 | 28 |
| Fluorescence | 8 | 0.2–8 | 0.051 | 29 |
| Fluorescence | 9 | 0.5–14 | 0.036 | 30 |
| Fluorescence | — | 0.14–21 | 0.064 | 31 |
| Fluorescence | — | 0–12 | 0.15 | 32 |
| Electrochemistry | 30 | 0.1–120 | 0.02 | 33 |
| Electrochemistry | 7 | 1.0–300 | 0.6 | 34 |
3. Experimental
Chemicals, culture medium and bacterial strains
All inorganic salts used in this study were obtained from Shanghai Lingfeng Chemical Reagents Factory (Shanghai, China). Organic chemicals, such as 2,4-dichlorophenol (2,4-DCP), 2,4,6-trichlorophenol (2,4,6-TCP), p-NP, phenol, 4-chlorophenol (4-CP), m-NP, and o-NP were purchased from Sinopharm Chemical Reagent Beijing Co., Ltd (Beijing, China). All chemical substances were of analytical reagent-grade. Ultrapure water (Milli-Q system) was used to prepare all aqueous stock solutions. Bacillus cereus and Saccharomyces cerevisiae cells were used. Luria–Bertani (LB) medium and potato dextrose broth (PDB) were used to culture B. cereus and S. cerevisiae, respectively.Preparation of CDs
CDs-WT were fabricated by the hydrothermal method using E. coli BW25113 cells. E. coli cells were cultured in 1 L of sterile LB liquid medium (37 °C, 150 rpm) for 12 h. Subsequently, the supernatant was removed by centrifugation (4 °C, 10![[thin space (1/6-em)]](https://www.rsc.org/images/entities/char_2009.gif) 000g, 15 min). The precipitate was washed three times with 500 mL of Milli-Q water, centrifuged (4 °C, 10
000g, 15 min). The precipitate was washed three times with 500 mL of Milli-Q water, centrifuged (4 °C, 10![[thin space (1/6-em)]](https://www.rsc.org/images/entities/char_2009.gif) 000g, 15 min), and then re-suspended in 50 mL of Milli-Q water. The cell resuspension solution was transferred to a Teflon-lined stainless-steel autoclave and heated at 200 °C for 12 h. After natural cooling to room temperature, large particles and aggregates were removed by centrifugation (10
000g, 15 min), and then re-suspended in 50 mL of Milli-Q water. The cell resuspension solution was transferred to a Teflon-lined stainless-steel autoclave and heated at 200 °C for 12 h. After natural cooling to room temperature, large particles and aggregates were removed by centrifugation (10![[thin space (1/6-em)]](https://www.rsc.org/images/entities/char_2009.gif) 000g, 15 min, 4 °C) and filtration (0.22 μm filters, Millipore). CDs-WT were stored at 4 °C until further analysis.
000g, 15 min, 4 °C) and filtration (0.22 μm filters, Millipore). CDs-WT were stored at 4 °C until further analysis.
Quantum yield measurement
The quantum yield (QY) was gauged using standard procedures.39 Quinine sulfate in 0.1 M H2SO4 (QY = 54% excited at 338 nm, η = 1.33) was chosen as a reference. The QY was measured according to the following equation:| QCDs = QR (ICDs/IR) (AR/ACDs) (ηCDs2/ηR2), |
Microbial imaging
B. cereus was incubated in LB liquid medium for 6 h (37 °C, 150 rpm). S. cerevisiae was inoculated in PDB for 12 h (28 °C, 150 rpm). Microbes were treated with 5% formaldehyde solution for 12 h to obtain dead cells. The culture supernatant was removed by centrifugation (8000g, 5 min), and the microbes were washed three times with phosphate-buffered saline (PBS) by centrifugation (8000g, 5 min) and then re-suspended in 1 mL of PBS. Subsequently, the resuspension solution was mixed with 100 μL (50 μg mL−1) of CDs-WT and incubated for 2 h. A confocal scanning laser microscope (CLSM, Nikon A1, Japan) was used to capture images of bacterial and yeast cells after the suspension was washed with PBS three times.MTT assays
HeLa cells and U2OS cells were cultured in 96-well plates at a density of 8 × 10³ cells per well, and the CDs-WT were then added to each well at different final concentrations (0, 50, 100, 150, and 200 μg mL−1). The culture conditions can be described as follows: all cell strains used in this experiment were incubated in Dulbecco's minimum essential media (DMEM) supplemented with 10% fetal bovine serum at 37 °C in 5% CO2. Finally, the cytotoxicity of CDs-WT was determined by MTT assays after 24 h of cultivation.Cell imaging
HeLa cells and U2OS cells (human osteosarcoma cells, ATCC HTB-96) were cultured in 24-well plates using DMEM in 5% CO2 at 37 °C containing 10% fetal bovine serum with a sterile cell slide placed in it. The CDs-WT (0.5 mL, 50 μg mL−1) were added to each chamber after culturing for 24 h and then incubated for 2 h. Subsequently, the cells were washed three times with PBS and fixed with 4% paraformaldehyde at room temperature for 20 min, followed by washing twice with PBS and CLSM for cell imaging.In vivo biodistribution imaging of CDs-WT
The use of animals was approved by the Kunming University of Science and Technology and Use Committee (Approval ID: M2015-011) and the protocol followed the guidelines of the Association for Assessment and Accreditation of Laboratory Animal Care. For imaging of the in vivo biodistribution of CDs-WT, briefly, 400 μL of CDs-WT (50 μg mL−1) and 0.9% NaCl (control) were intraperitoneally injected into male BALB/c mice (20 ± 2 g). The mice were anesthetized with ether and then killed by neck breaking. Additionally, various organs, such as the brain, heart, liver, lungs, spleen, stomach, kidneys, intestine, and testicles, were harvested at different time points. An In vivo FX PRO Bruker imaging station system (Carestream Health, Woodbridge, CT, USA) was used for fluorescence imaging at different time points with an exposure time of 10 s. Excitation at 410 nm and emission at 535 nm were used to obtain fluorescence images.Procedures for p-NP detection
To evaluate the selective recognition of p-NP by CDs-WT, 1.76 mL of Milli-Q water and 40 μL of prepared CDs-WT were added to a 4 mL polypropylene centrifuge tube, followed by the addition of p-NP solutions of different concentrations and mixing. The fluorescence spectrum was explored at an excitation wavelength of 338 nm after the mixtures were incubated for 2 min. The selectivity analysis of fluorescent CDs-WT for p-NP was designed following the method described above to detect other potentially interfering substances.4. Conclusions
In this work, we successfully synthesized fluorescent CDs-WT from E. coli BW25113 as the exclusive precursor. Previously reported CDs derived from E. coli by the hydrothermal method (200 °C, 24 h) selectively stained dead microbial cells rather than live cells. Using a different synthesis duration (CDs-WT: 200 °C, 12 h), we produced novel CDs that can be used for microbial imaging and as rapid fluorescent probes for the highly selective detection of p-NP by the IFE mechanism. Additionally, our CDs showed numerous advantageous characteristics, such as excellent biocompatibility, low cytotoxicity, multicolor fluorescence emission properties, and applicability for in vitro and in vivo imaging. CDs-WT can be excreted rapidly through the intestine according to in vivo biodistribution imaging results. This study provides valuable guidance for p-NP detection and biomedical applications and broadens the applications of CDs derived from bacteria.Conflicts of interest
There are no conflicts to declare.Acknowledgements
This work was financially supported by the Project funded by the China Postdoctoral Science Foundation (2018M643535).Notes and references
- S. N. Baker and G. A. Baker, Angew. Chem., Int. Ed., 2010, 49, 6726–6744 CrossRef CAS.
- M. M. F. Baig and Y. C. Chen, J. Colloid Interface Sci., 2017, 501, 341–349 CrossRef CAS.
- Z. Ji, N. Li, Y. Zhang, M. Xie, X. Shen, L. Chen, K. Xu and G. Zhu, J. Colloid Interface Sci., 2019, 542, 392–399 CrossRef CAS.
- H. Qi, M. Teng, M. Liu, S. Liu, J. Li, H. Yu, C. Teng, Z. Huang, H. Liu, Q. Shao, A. Umar, T. Ding, Q. Gao and Z. Guo, J. Colloid Interface Sci., 2019, 539, 332–341 CrossRef CAS.
- J. Zhang and S.-H. Yu, Mater. Today, 2016, 19, 382–393 CrossRef CAS.
- C. Han, R. Wang, K. Wang, H. Xu, M. Sui, J. Li and K. Xu, Biosens. Bioelectron., 2016, 83, 229–236 CrossRef CAS.
- T. S. Atabaev, Nanomaterials, 2018, 8, 342 CrossRef.
- M. J. Molaei, Talanta, 2019, 196, 456–478 CrossRef CAS.
- A. K. Awasthi, X. Zeng and J. Li, Environ. Pollut., 2016, 211, 259–270 CrossRef CAS.
- T. Zhou, H. Han, P. Liu, J. Xiong, F. Tian and X. Li, Sensors, 2017, 17, 2230 CrossRef.
- Q. Song and J. Li, Waste Manage., 2014, 34, 2587–2594 CrossRef CAS.
- T. Fujimori and H. Takigami, Environ. Geochem. Health, 2014, 36, 159–168 CrossRef CAS.
- G. Pasternak, J. Greenman and I. Ieropoulos, Sens. Actuators, B, 2017, 244, 815–822 CrossRef CAS.
- L. Han, S. G. Liu, J. Y. Liang, Y. J. Ju, N. B. Li and H. Q. Luo, J. Hazard. Mater., 2019, 362, 45–52 CrossRef CAS.
- N. Xiao, S. G. Liu, S. Mo, N. Li, Y. J. Ju, Y. Ling, N. B. Li and H. Q. Luo, Talanta, 2018, 184, 184–192 CrossRef CAS.
- G. H. G. Ahmed, R. B. Laíño, J. A. G. Calzón and M. E. D. García, Microchim. Acta, 2014, 182, 51–59 CrossRef.
- V. N. Mehta, S. Jha and S. K. Kailasa, Mater. Sci. Eng., C, 2014, 38, 20–27 CrossRef CAS.
- S. Y. Lim, W. Shen and Z. Gao, Chem. Soc. Rev., 2015, 44, 362–381 RSC.
- X. Yang, Y. Wang, X. Shen, C. Su, J. Yang, M. Piao, F. Jia, G. Gao, L. Zhang and Q. Lin, J. Colloid Interface Sci., 2017, 492, 1–7 CrossRef CAS.
- Y. Wang, P. Anilkumar, L. Cao, J. H. Liu, P. G. Luo, K. N. Tackett II, S. Sahu, P. Wang, X. Wang and Y. P. Sun, Exp. Biol. Med., 2011, 236, 1231–1238 CrossRef CAS.
- X. Zhai, P. Zhang, C. Liu, T. Bai, W. Li, L. Dai and W. Liu, Chem. Commun., 2012, 48, 7955–7957 RSC.
- F. Lin, C. Li and Z. Chen, Front. Microbiol., 2018, 9, 259 CrossRef.
- X. W. Hua, Y. W. Bao, H. Y. Wang, Z. Chen and F. G. Wu, Nanoscale, 2017, 9, 2150–2161 RSC.
- F. Lin, C. Li, L. Dong, D. Fu and Z. Chen, Nanoscale, 2017, 9, 9056–9064 RSC.
- I. G. Droppo, B. G. Krishnappan and J. R. Lawrence, Water Res., 2016, 92, 121–130 CrossRef CAS.
- S. Zhang, D. Zhang, Y. Ding, J. Hua, B. Tang, X. Ji, Q. Zhang, Y. Wei, K. Qin and B. Li, Analyst, 2019, 144, 5497–5503 RSC.
- T. Shu, J. X. Wang, X. F. Lin, Z. P. Zhou, F. Liang, L. Su and X. J. Zhang, J. Mater. Chem. C, 2018, 6, 5033–5038 RSC.
- S. Geng, S. M. Lin, S. G. Liu, N. B. Li and H. Q. Luo, RSC Adv., 2016, 6, 86061–86067 RSC.
- J. L. Yu, X. Y. Wang, Q. Kang, J. H. Li, D. Z. Shen and L. X. Chen, Environ. Sci.: Nano, 2017, 4, 493–502 RSC.
- X. Wei, Z. P. Zhou, T. F. Hao, H. J. Li, Y. Z. Zhu, L. Gao and Y. S. Yan, RSC Adv., 2015, 5, 44088–44095 RSC.
- Y. Zhou, Z. B. Qu, Y. Zeng, T. Zhou and G. Shi, Biosens. Bioelectron., 2014, 52, 317–323 CrossRef CAS.
- W. Li, H. R. Zhang, S. Chen, Y. L. Liu, J. L. Zhuang and B. F. Lei, Biosens. Bioelectron., 2016, 86, 706–713 CrossRef CAS PubMed.
- J. Li, D. Kuang, Y. Feng, F. Zhang, Z. Xu and M. Liu, J. Hazard. Mater., 2012, 201–202, 250–259 CrossRef CAS.
- H. Yin, Y. Zhou, S. Ai, X. Liu, L. Zhu and L. Lu, Microchim. Acta, 2010, 169, 87–92 CrossRef CAS.
- J. Liu, D. Li, K. Zhang, M. Yang, H. Sun and B. Yang, Small, 2018, 14, e1703919 CrossRef.
- H. Wang, S. Liu, Y. Song, B. W. Zhu and M. Tan, Nanotoxicology, 2019, 13, 160–173 CrossRef CAS.
- Y. Tang, Y. Liu and A. Cao, Anal. Chem., 2013, 85, 825–830 CrossRef CAS.
- F. Zu, F. Yan, Z. Bai, J. Xu, Y. Wang, Y. Huang and X. Zhou, Microchim. Acta, 2017, 184, 1899–1914 CrossRef CAS.
- C. Zhao, Y. Jiao, J. Hua, J. Yang and Y. Yang, J. Fluoresc., 2018, 28, 269–276 CrossRef CAS.
Footnotes |
| † Electronic supplementary information (ESI) available. See DOI: 10.1039/c9an01753d |
| ‡ These authors have contributed equally to this work. |
| This journal is © The Royal Society of Chemistry 2020 |

