AIE/FRET-based versatile PEG-Pep-TPE/DOX nanoparticles for cancer therapy and real-time drug release monitoring†
Tian-Tian
Wang‡
 a,
Qi-Chun
Wei‡
b,
Zhen-Tao
Zhang
a,
Meng-Ting
Lin
a,
Jie-Jian
Chen
a,
Yi
Zhou
a,
Ning-Ning
Guo
a,
Xin-Cheng
Zhong
a,
Wen-Hong
Xu
b,
Zhan-Xiang
Liu
c,
Min
Han
a,
Qi-Chun
Wei‡
b,
Zhen-Tao
Zhang
a,
Meng-Ting
Lin
a,
Jie-Jian
Chen
a,
Yi
Zhou
a,
Ning-Ning
Guo
a,
Xin-Cheng
Zhong
a,
Wen-Hong
Xu
b,
Zhan-Xiang
Liu
c,
Min
Han
 *a and
Jian-Qing
Gao
 *a
*a
aInstitute of Pharmaceutics, College of Pharmaceutical Sciences, Zhejiang University, Hangzhou, 310058, China. E-mail: hanmin@zju.edu.cn; gaojianqing@zju.edu.cn
bDepartment of Radiation Oncology, Key Laboratory of Cancer Prevention and Intervention, the Second Affiliated Hospital, Zhejiang University, College of Medicine, Hangzhou, 310058, China
cDepartment of Chemistry, Zhejiang University, Hangzhou, 310058, China
First published on 12th November 2019
Abstract
On account of the biological significance of self-assembling peptides in blocking the cellular mass exchange as well as impeding the formation for actin filaments resulting in program cell death, stimuli-responsive polypeptide nanoparticles have attracted more and more attention. In this work, we successfully fabricated doxorubicin-loaded polyethylene glycol-block-peptide (FFKY)-block-tetraphenylethylene (PEG-Pep-TPE/DOX) nanoparticles, where the aggregation-induced emission luminogens (AIEgen, TPE-CHO) can become a fluorescence resonance energy transfer (FRET) pair with the entrapped antitumor drug DOX to detect the release of drugs dynamically. This is the first successful attempt to detect and quantify the change of FRET signals in A549 cells via three methods to monitor the cellular uptake of nanoprobes and intracellular drug molecule release intuitively. As we proposed here, the combination of free DOX and the self-assembling peptide could achieve the synergistic anticancer efficacy. The multifunctional PEG-Pep-TPE/DOX nanoparticles may provide a new opportunity for combination cancer therapy and real-time detection of the drug release from stimuli-responsive nanomedicine.
Introduction
Cancer has become the most serious disease to human health, and some reports reflected that the incidence of breast cancer continues to remain high in the world.1 Currently, for human cancers, chemotherapy is still considered an effective therapy, while it has induced severe side effects in clinical practices because of its poor solubility, systemic instability, and lack of cancer specificity, which limit its application in many fields. In order to address the dilemma, scientists have made much effort to provide some strategies over the past few decades.Though not being defined at the genetic level, nanoscale assemblies of the peptide are able to perform many critical biological functions,2 and previous studies have also highlighted the significance of the topological structures of peptides in maintaining the normal functions of extracellular matrix and cells.3,4 Usually, changes in temperature, pH or enzyme can successfully create the conditions where peptides as self-assembling building blocks can aggregate to form various nanoscale structures including nanotubes, fibrils, nano-vesicles, gels, and nanocages via non-covalent interactions mainly π-effects, van der Waal forces, and hydrogen bonding5,6 The last decade has witnessed that the self-assembly of proteins (FF dipeptide, FFY tripeptide or FFKY tetrapeptide) could be realized in a cellular environment,7 which are crucial for impeding the formation of actin filaments and microtubules resulting in programmed cell death,8–10 promoted proliferation of stem cells or suppressed immune responses11 as well as blocked cellular mass exchange between cells to inhibit the proliferation and migration.12 On account of the biological significance of self-assembling peptides, we fabricated the glutathione(GSH)-responsive PEG-Pep (FFKY) nanoparticles which disintegrated in high GSH, and D-peptide FFKY as a self-assembling building block or hydrophobic section could form nanofibers mimicking the functional structures and bio functions of intracellular molecules to consequently achieve the synergistic effect with doxorubicin (Scheme 1).
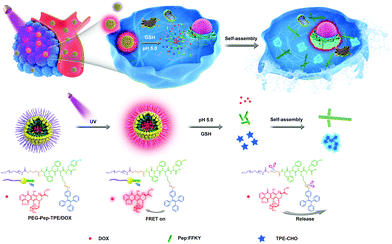 | ||
| Scheme 1 Schematic illustration of drug release behavior from the self-assembled PEG-Pep-TPE/DOX nanoparticles via FRET and pH/GSH-responsive antitumor synergistic chemotherapy. | ||
Nanoparticles as one of the main nanocarriers have been explored for cancer therapy aimed at delivering drugs to tumors via the enhanced permeability and retention (EPR) effect,13 and reduce some adverse effects of the drugs to a large extent owing to their stealth structure and biocompatibility.14 However, some of them have not yet shown the ideal therapeutic efficacy in clinical trials,15 so a further understanding of the behaviors of nanoparticles in vivo, particularly when and how the loaded drugs could be released, may provide a solution for this dilemma.16 With the development of light microscopy techniques, the incorporation of fluorescent dyes in the nanoparticles to achieve the diagnostic imaging and therapeutic capability has attracted intensive research activities in many fields, which is key to tracking nanoparticles and observing their behavior. It's reported in Nature Communications that introducing a fluorophore into the peptides could be used to evaluate the distribution of the nanofibers and understand their interactions with other components; yet, the concentration dependent self-assembly of D-peptide FFKY occurs around sub-mM, at which the concentration of most of the organic dyes would self-quench.17 Lack of an ideal fluorophore for studying the self-assembly of peptides inside cells has hindered the development in the field of new biomaterials. Fortunately, a novel phenomenon, AIE effect, which is opposite to the ACQ effect, was discovered by Tang's group in 2001. Based on the amazing characteristics of high two-photoluminescence (2PL) efficiency,18 better penetration,19 focusing capability and good biocompatibility,20–22 a large quantity of AIE-probes have been developed and shown great promise in the detection of intracellular microenvironment (pH, PA, H2S/H2O2, etc.)23–26 and lighting sub-organizers to track cell behavior and function.27–29 Besides, benefitting from the strategies of nanoengineering and molecular design, organic/polymer optical AIEgens with controlled photophysical properties have been successfully developed, and show unique merits in precise image-guided cancer surgery30–32 and photothermal therapy.33 Therefore, the AIE effect of FFK(TPE)Y in our design provides a new solution for the serious ACQ effect of conventional organic fluorogens.
Besides, the fluorescent anticancer drug doxorubicin (DOX) was employed as an acceptor to become a FRET pair with AIE fluorogens. TPE-CHO could realize a sensitive fluorescence “turn-on” effect when DOX was released from the nanoparticles to detect the release of drugs dynamically. Previous in vitro studies already showed that FRET imaging could be used to study the release of active drugs,34–36 subsequent cell apoptosis,37 and protein–protein interactions, and detect the content of small molecules (H2S) in vitro and in vivo.38 To our knowledge, FRET imaging was used to analyze the drug release from the nanoparticles qualitatively, which easily led to accidental experimental results. Therefore, we have the first successful attempt to detect and quantify the change of FRET signals in A549 cells via three methods on the basis of practical considerations, acceptor photobleaching, spectral imaging and sensitized emission. These techniques enabled us to quantitatively detect the release and distribution of the nanomedicine in a non-invasive manner. Collectively, we designed the (PEG-Pep-TPE/DOX) nanoparticles effectively by combining the advantages of AIE and FRET effects and D-peptide as described in Scheme 1, which will open a new promising path for cancer imaging and chemotherapy.
Results and discussion
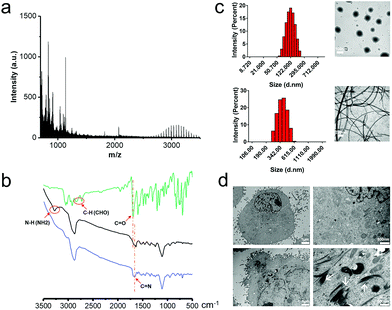
The amphipathic polymers PEG-Pep-TPE were synthesized according to the synthetic route recorded in Fig. S1† and were first confirmed by LC-MS. Fig. 1a displays a peak at 3078.187, which is in good agreement with the MW of the product PEG-Pep-TPE, and the difference between the two adjacent peaks was 44, which happened to be the molecular weight of one PEG cycle unit inconsistency with the structure of PEG-Pep-TPE. Besides, the successful fabrication of PEG-Pep-TPE was further confirmed by the FT-IR spectra. As shown in Fig. 1b, the stretching vibration band of C–H(–CHO) at 2728 cm−1 and its bending vibration band at 2843 cm−1 in the TPE-CHO spectrum disappeared in the FT-IR spectrum of PEG-Pep and PEG-Pep-TPE, while the characteristic peak at 1663 cm−1 (C![[double bond, length as m-dash]](https://www.rsc.org/images/entities/char_e001.gif) N) appeared in the spectrum of PEG-Pep-TPE, evidencing the introduction of AIEgen in PEG-Pep.
N) appeared in the spectrum of PEG-Pep-TPE, evidencing the introduction of AIEgen in PEG-Pep.
Polyethylene glycol (PEG) is a kind of nonionic water-soluble polymer equipped with excellent properties such as water solubility and biocompatible ability. In this work, the amphiphilic copolymers PEG-Pep-TPE with the hydrophilic PEG and hydrophobic Pep-TPE could self-assemble into nanoparticles in aqueous solutions. As shown in the top panel of Fig. 1c, dynamic light scattering (DLS) revealed that PEG-Pep-TPE nanoparticles had an average hydrodynamic diameter of 137 nm with the polydispersity index of 0.249. Meanwhile, TEM was used to observe the morphology and size of PEG-Pep-TPE nanoparticles, and the results suggested a spherical morphology with a size of about 100 nm, convincingly evidencing the formation of the nanoparticle structure.
In order to systematically study the pH/GSH-responsive characteristic of PEG-Pep-TPE NPs, we completed a detailed investigation of its behavior in a physical stimulation and in A549 cells. The bottom panel of Fig. 1c, displayed that PEG-Pep-TPE NPs pretreated with pH 5.0 and 10 mM GSH for 12 h disintegrated responsively and the peptide fragments self-assembled to form fibers. In contrast to the results at 24 h (Fig. S3, ESI†), there was no significant change in the degree of fracture. Such phenomena supported the hypothesis that PEG-Pep-TPE NPs have a pH/GSH-responsive characteristic, and had broken completely under physical conditions for 12 h. Besides, the DLS results suggested that the size of pretreated preparation was bigger than that of untreated nanoparticles, which could be explained in terms of aggregation of hydrophobic fragments (TPE-CHO molecules) and self-assembling peptides. Subsequently, after A549 cells (Institute of Biochemistry and Cell Biology of Chinese Academy of Science (Shanghai, China)) were incubated with the PEG-Pep-TPE NPs for 12 h, the reticulated self-assembled fibers were observed in the cytoplasm (Fig. 1d) via TEM compared with the control group. Relying on obtained results, it could be assumed that the pH/GSH-responsiveness of PEG-Pep-TPE NPs happened whether in the physical stimulation or in A549 cells and implied that PEG-Pep-TPE NPs would remain stable core–shell architectures in blood circulation, and disintegrate responsively in tumor cells.
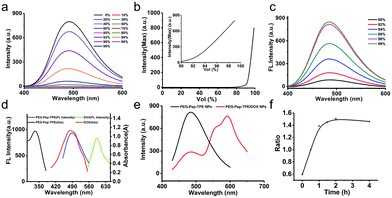
The structure of the TPE-CHO molecules was similar to typical AIE luminogens such as TPE, and its AIE behavior could be evaluated by fluorescence assay. As shown in Fig. 2a, TPE-CHO dissolved in THF showed weak fluorescence; yet, the fluorescence intensity increased dramatically when the water fraction added to the THF solution exceeded 90% vol% under the same concentration and excitation condition, which was ascribed to the restriction of their intramolecular rotations induced by the aggregation of the hydrophobic TPE-CHO molecules. It was worth mentioning that the fluorescence intensity of the TPE-CHO molecules in water increased linearly with the increase of water fraction over 90% vol% and reached up to the maximum in water theoretically (Fig. 2b). Because TPE-CHO as the hydrophobic moieties were trapped in the core of PEG-Pep-TPE NPs, the aggregation state of the TPE-CHO molecules was expected to excite the AIE behavior. As stated before, the AIE behavior of PEG-Pep-TPE polymer could also be examined by fluorescence assay, and the same phenomenon occurred in Fig. 2c, which could also provide sufficient evidence to prove successful self-assembly of PEG-Pep-TPE polymers to PEG-Pep-TPE NPs, and the noticeable AIE effect of PEG-Pep-TPE NPs can be further employed in cell imaging.
Although the AIE effect can be used to trace the intracellular uptake of PEG-Pep-TPE NPs in the nanocarriers, the exploration of the drug-release behavior of the nanoparticles was still limited. Therefore, we further introduced the fluorescence resonance energy transfer (FRET) effect, which may open a route to the realization of investigating the intracellular drug release from nanoparticles. Furthermore, the maximum emission wavelength of the TPE-CHO molecules was located at 490 nm (as seen from Fig. 2d), same as the maximum absorption wavelength of the antitumor drug of doxorubicin (DOX), suggesting that the AIE group and DOX could become a FRET pair to monitor the drug-release process dynamically.
As shown in Fig. 2e, further insight could be gained by comparing the fluorescence spectrum of PEG-Pep-TPE NPs with that of PEG-Pep-TPE/DOX NPs only excited by UV lamp at 350 nm; the intensity of PEG-Pep-TPE/DOX NPs located at 490 nm was much lower than that of the PEG-Pep-TPE NPs (fluorescence quenching), whereas the fluorescence intensity at 600 nm emitted by the receptor DOX was greatly enhanced (sensitized fluorescence). This result presented a detailed analysis and discussion that FRET happened in PEG-Pep-TPE/DOX NPs. With the expectation to further verify the FRET effect of PEG-Pep-TPE/DOX NPs and monitor the release of DOX molecules from PEG-Pep-TPE/DOX NPs at the same time, we took advantage of their pH/GSH-triggered disintegration to treat PEG-Pep-TPE/DOX with pH 5.0 and 10 mM GSH and measured the changes of the fluorescence intensity at different time points in Fig. S4.† We could find out that the fluorescence intensity located at 490 nm increased gradually as time went on, which reflected the disintegration of the nanoparticles and the disappearance of the FRET effect between AIE and DOX. However, the fluorescence intensity of DOX was not weakened as expected but was enhanced continuously to some extent, which may be inconsistent with the partial overlap of the DOX emission spectrum and the AIE emission spectrum. To eliminate the effects of the spectral overlap, we adopted the ratio of the maximum fluorescence intensity of AIE to DOX as a measurement of the FRET. As shown in Fig. 2f, we could observe that the ratio increased over time and reached a constant value after 3 h, which indicated a gradual disappearance of FRET between TPE-CHO and DOX and visually reflected the release of DOX from PEG-Pep-TPE/DOX NPs. At the same time, this experiment could be invoked to prove the pH/GSH-responsiveness of PEG-Pep-TPE NPs in turn, and further explain the phenomenon that PEG-Pep-TPE NPs broke completely under physical conditions for 12 h without an obvious difference for 24 h, as shown in the bottom panel of Fig. 1c.
The effective release of drugs is one of the significant preconditions for their efficacy. To explore the impact of release behavior on efficacy, we set up four drug groups with different release abilities, including free DOX solution, PEG-Pep-TPE NPs + DOX, PEG-Pep-AIE/DOX NPs + GSH-OEt, and PEG-Pep-AIE/DOX NPs. Accordingly, the DOX cumulative release curve was respectively 94.49%, 93.59%, 77.16%, and 34.08% at 6 h, which implied that the drug release ability was declining gradually. In the meantime, the attractive results displayed in Fig. S5a† showed that the killing effects on tumor cells of four drug groups were gradually reduced as expected, and the IC50 values increased in turn. Besides, the impact of release ability on the efficacy was increasingly significant with the increase of drug concentration. Additionally, a significant correlation could be observed between IC50 values and in vitro release (Fig. S5b and c†). Therefore, we concluded that the ability of drug release from carriers would have a certain influence on the performance of drug efficacy, which may provide a novel guide for developing a drug delivery strategy in the future.
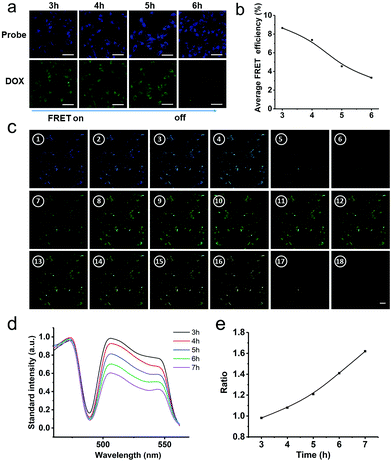
To further intuitively image drug delivery in cells and trace intracellular release from PEG-Pep-TPE/DOX NPs, we employed CLSM to determine the change of FRET signals occurring in AIE probes and DOX, which could visually reflect the release of the drug. At present, the detection of the FRET signal by a method only stays at the qualitative level, which easily leads to accidental experimental results. Therefore, here we adopted three general approaches to measure FRET based on practical considerations: (i) acceptor photobleaching (Fig. 3a); (ii) spectral imaging (Fig. 3c); and (iii) sensitized emission (Fig. 4a). As shown in Fig. 3a, after 3 h incubation with PEG-Pep-TPE/DOX NPs, blue and green fluorescence were directly observed, suggesting that almost all of PEG-Pep-TPE/DOX NPs were internalized by cells and mainly concentrated in the cytoplasm. Besides, the fluorescence of AIE probes was weak and even at the “OFF” status, indicating that the DOX molecules were mostly entrapped in the core of the nanoparticles. Along with the prolonged time, the blue fluorescence intensities tended to be stronger and more DOX molecules were observed in the nucleus, which indicated that the FRET effect gradually disappeared, and the drug was continuously released from the nanoparticles and then entered the nucleus. The average FRET efficiency measured by the acceptor photobleaching method in Fig. 3b could be employed to further explain this phenomenon and the FRET efficiency at a single site could be up to 25% at 3 h (avi1); yet, the average FRET efficiency reflecting the release behaviors, on the whole, was generally low in cells, which would increase the measurement error. Another confusing object was that the green fluorescence intensities should remain the same in theory, but the fluorescence intensities for DOX at 6 h was slightly weaker than the other groups, which may be associated with the defects of this method that photobleaching the acceptor can also cause photo-damage to the sample and induce incomplete recovery of the acceptor fluorochrome.
To decrease these errors to the greatest extent, we adopted the spectral imaging method similar to the method used in the experiment of pH/GSH-responsive drug release under in vitro simulated conditions. Rather than collecting separate donor and FRET images by band-pass filters and correcting them for donor emission crosstalk, the entire fluorescence emission spectrum could be collected just like Fig. 3c, which could improve the sensitivity because all of the light collected by the system could be detected. As depicted in Fig. 3d, an obvious decrease in the standard fluorescence intensity (DOX channel) was observed with elapsing time when the samples treated with PEG-Pep-TPE/DOX NPs were excited under 405 nm laser irradiation. Then, we calculated the ratio of the maximum standard fluorescence intensity of AIE to DOX over time, which possessed the ability to remove contributions from cellular autofluorescence, and observed that the ratio continuously increased (Fig. 3e), which was consistent with the aforementioned result in the drug release assay in physical condition (Fig. 2f) as more and more DOX molecules were released resulting in the recovery of the blue fluorescence from the “OFF” to “ON” state. In the meantime, it's worth mentioning that the plateau of drug release did not appear in the cells until 7 hours unlike that under in vitro simulated conditions, indicating the sustained release characteristics of PEG-Pep-TPE/DOX NPs.
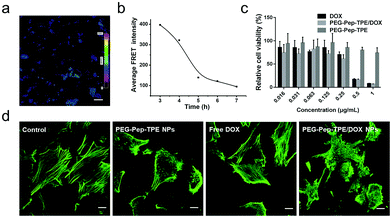
Finally, the sensitized emission technique that was based on a series of sample and control images collected and corrected for noise, background intensity, and intensity contributions were employed to measure FRET. In the Youvan method, the corrected FRET signal (Fc) can be calculated based on the equation: Fc = Fb − Donorcorr − Acceptorcorr.39 Indeed, the relative FRET intensities of the corrected FRETCorr image were apparent in Fig. 4a. We could observe that the relative FRET fluorescence intensities of each cell in the same period and different parts of the same cell were different, which strongly demonstrated the temporal and spatial heterogeneity of drug release. The result is shown in Fig. 4b, as the donor signal went up, the FRET signal went down, and the ratio of FRET/donor increased in good agreement with the previous phenomenon. From the aforementioned analysis, we can conclude that the PEG-Pep-TPE/DOX NPs was sensitive to dynamically detect intracellular drug release on the cancer cell level in vitro.
To evaluate the feasibility of using PEG-Pep-TPE/DOX NPs to suppress cancer cells, and the synergistic effect between self-assembling peptide and doxorubicin, methyl tetrazolium (MTT) assays were employed to evaluate the relative cell viability for free DOX, PEG-Pep-TPE NPs and PEG-Pep-TPE/DOX NPs at the tested concentrations ranging from 0.016 to 1 μg mL−1 against A549 cells after 72 h incubation. The cells without any treatment were used as control. As shown in Fig. 4c, we can observe that the viability of the A549 cells treated with PEG-Pep-TPE NPs up to a very high concentration of 100 μg mL−1 was still over 80%, which indicated that PEG-Pep-TPE NPs or self-assembling peptides were of low toxicity and good biocompatibility. Another attractive result was that the relative cell viability of DOX-loaded nanoparticles at different concentrations was almost the same or even lower than that of the free DOX, which implied that PEG-Pep-TPE/DOX NPs could not only exhibit favorable potential in effectively inhibiting the proliferation of cancer cells but also reduce the undesirable side effects on normal cells to a certain degree because of its passive targeting. At the same time, this result further confirmed that the self-assembling peptide possessed a synergistic effect with doxorubicin, but the mechanism was not clarified yet, and more investigations were needed in the succeeding study.
The cytoskeleton refers to the protein fiber network structure in eukaryotic cells, which not only plays an important role in maintaining cell morphology, bearing external forces and maintaining the order of internal cell structure but also participates in many important life activities. Previous works have reported that the intracellular nanoscale assemblies of the peptide could selectively inhibit cancer cells via chaotic interactions with proteins, which gives us the insight to propose that the self-assembling peptide in our design may disrupt the dynamics of actin filaments of vimentins in cells to achieve the synergistic effect with doxorubicin. To test this assumption, we stained the actin filaments of the cells pretreated with free DOX, PEG-Pep-TPE NPs, and PEG-Pep-TPE/DOX NPs for 12 h. It was found from Fig. 4d that the cells treated with PEG-Pep-TPE NPs and PEG-Pep-TPE/DOX NPs exhibited fragmentary actin filaments compared with the well-defined long actin filaments of the control group or free DOX group. This phenomenon could give us a holistic understanding of the synergistic mechanism that the self-assembling peptide may prevent the assembly of actin in the cytoplasm and even damage the existing actin filaments in cells. Besides, the morphology of nanofibers formed inside the cells observed by TEM in Fig. 1d also can be used to support the hypothesis. On this basis, we also successfully prepared a PEG-Pep-TPE (C–N) vector for intracellular dynamics study of the synergistic effect of the nanoparticle PEG-Pep-TPE (C![[double bond, length as m-dash]](https://www.rsc.org/images/entities/char_e001.gif) N). As displayed in Fig. S6,† the presence of PEG-Pep-TPE (C–N) nanoparticles gradually changed from the aggregation state of the nanospheres to the dispersion distribution of the particles over time in the intracellular structure, which possibly explained that intracellular GSH triggered the PEG-Pep-TPE (C–N) nanoparticles to disintegrate into small particles (collapsed nanoparticles and fractured polymeric chains) and self-assembling nanofibers (accumulated Pep-TPE). This phenomenon that its dynamic process can be observed in avi2 validated the assumption on the synergistic chemotherapy mechanism of self-assembled fibers to some extent.
N). As displayed in Fig. S6,† the presence of PEG-Pep-TPE (C–N) nanoparticles gradually changed from the aggregation state of the nanospheres to the dispersion distribution of the particles over time in the intracellular structure, which possibly explained that intracellular GSH triggered the PEG-Pep-TPE (C–N) nanoparticles to disintegrate into small particles (collapsed nanoparticles and fractured polymeric chains) and self-assembling nanofibers (accumulated Pep-TPE). This phenomenon that its dynamic process can be observed in avi2 validated the assumption on the synergistic chemotherapy mechanism of self-assembled fibers to some extent.
Conclusions
In summary, we have successfully designed pH/GSH-responsive nanoparticles by effectively combining the advantages of AIE, the FRET effect, and D-peptide. Cytotoxicity assessment proved that free DOX and the self-assembling peptide could achieve a synergistic effect inducing much higher toxicity than a single anticancer drug, which may improve the antitumor efficiency and minimize the DOX-associated side effects simultaneously. Meanwhile, we had initially explored the synergistic mechanism and found that the self-assembling nanofibers may prevent the assembly of actin in the cytoplasm and even damage the existing actin filaments in cells. Significantly, we adopted three measures to detect the change of FRET signals in A549 cells, and subsequently proved the potential capacity of PEG-Pep-TPE/DOX NPs to successfully monitor the cellular uptake of nanoprobes and intracellular drug molecule release, which was also the first time we quantified fluorescence information and more intuitively responded to drug release from nanocarriers. Overall, we believe that such pH/GSH-responsive multifunctional nanoparticles can provide a promising platform for combination cancer therapy and emphasize the potential of FRET coupled with AIE for real-time detection of drug release from stimuli-responsive nanomedicine.Author contributions
M. H. and J. G. supervised and conceived the research; T. W. performed experiments; and others analyzed the data and wrote the manuscript.Conflicts of interest
There are no conflicts of interest to declare.Acknowledgements
This study was supported by the National Natural Science Foundation of China (No. 81673022, 81572952, 81373346), National Key R&D Program of China (No. 2017YFE0102200), National Basic Research Program of China (No. 2014CB931903), the Zhejiang Provincial Natural Science Foundation of China (No. LY17H160013), and the Zhejiang Medical and Health Science and Technology Plan Project (2016KYB109). Besides, we thank the excellent technical assistant of Imaging Facility, Core Facilities, Zhejiang University School of Medicine with the confocal laser microscopy.Notes and references
- R. L. Siegel, K. D. Miller and A. Jemal, CA Cancer J. Clin., 2018, 68, 7–30 CrossRef PubMed.
- J. Shi and B. Xu, Nano Today, 2015, 10, 615–630 CrossRef CAS PubMed.
- L. L. Li, S. L. Qiao, W. J. Liu, Y. Ma, D. Wan, J. Pan and H. Wang, Nat. Commun., 2017, 8, 1276 CrossRef PubMed.
- Y. Kuang, J. Shi, J. Li, D. Yuan, K. A. Alberti, Q. Xu and B. Xu, Angew. Chem., Int. Ed., 2014, 53, 8104–8107 CrossRef CAS PubMed.
- G. Yuan, K. Yi, G. Zu-Feng, G. Zhihong, I. J. Krauss and X. J. Bing, J. Am. Chem. Soc., 2009, 131, 13576–13577 CrossRef PubMed.
- M. Abbas, Q. Zou, S. Li and X. Yan, Adv. Mater., 2017, 29, 1605021 CrossRef PubMed.
- G. Yuan, B. Cristina, K. Yi, S. Junfeng, N. Daniela and X. Bing, ACS Nano, 2013, 7, 9055–9063 CrossRef PubMed.
- C. Marie-Jeanne, J. Isabelle, L. Sylvie, S. Philippe, G. Benot, K. Marcel, T. Flavio, S. André and P. A. Curmi, Biochemistry, 2005, 44, 14616 CrossRef PubMed.
- Y. Kuang and B. Xu, Angew. Chem., Int. Ed., 2013, 52, 6944–6948 CrossRef CAS PubMed.
- Y. Kuang, D. Yuan, Y. Zhang, A. Kao, X. Du and B. Xu, RSC Adv., 2013, 3, 7704–7707 RSC.
- F. Zhao, B. A. Heesters, I. Chiu, Y. Gao, J. Shi, N. Zhou, M. C. Carroll and B. Xu, Org. Biomol. Chem., 2014, 12, 6816–6819 RSC.
- J. Shi, X. Du, D. Yuan, J. Zhou, N. Zhou, Y. Huang and B. Xu, Biomacromolecules, 2014, 15, 3559–3568 CrossRef CAS PubMed.
- R. Ngoune, A. Peters, D. von Elverfeldt, K. Winkler and G. Putz, J. Controlled Release, 2016, 238, 58–70 CrossRef CAS PubMed.
- Q. Chen, Y. Yang, X. Lin, W. Ma, G. Chen, W. Li, X. Wang and Z. Yu, Chem. Commun., 2018, 54, 5369–5372 RSC.
- D. L. Stirland, J. W. Nichols, M. Seiji and B. Y. Han, J. Controlled Release, 2013, 172, 1045–1064 CrossRef CAS PubMed.
- X. Sun, G. Wang, H. Zhang, S. Hu, X. Liu, J. Tang and Y. Shen, ACS Nano, 2018, 12, 6179–6192 CrossRef CAS PubMed.
- Y. Gao, J. Shi, D. Yuan and B. Xu, Nat. Commun., 2012, 3, 1033 CrossRef PubMed.
- M. Jiang, X. Gu, J. W. Y. Lam, Y. Zhang, R. T. K. Kwok, K. S. Wong and B. Z. Tang, Chem. Sci., 2017, 8, 5440–5446 RSC.
- Y. Wang, R. Hu, W. Xi, F. Cai, S. Wang, Z. Zhu, R. Bai and J. Qian, Biomed. Opt. Express, 2015, 6, 3783–3794 CrossRef CAS PubMed.
- D. Li, W. Qin, B. Xu, J. Qian and B. Z. Tang, Adv. Mater., 2017, 29, 7167 Search PubMed.
- D. Ding, D. Mao, K. Li, X. Wang, W. Qin, R. Liu, D. S. Chiam, N. Tomczak, Z. Yang and B. Z. Tang, ACS Nano, 2014, 8, 12620–12631 CrossRef CAS PubMed.
- Y. Cheng, C. Sun, X. Ou, B. Liu, X. Lou and F. Xia, Chem. Sci., 2017, 8, 4571 RSC.
- C. Li, T. Wu, C. Hong, G. Zhang and S. Liu, Angew. Chem., Int. Ed., 2012, 51, 455–459 CrossRef CAS PubMed.
- D. Li, J. Liu, R. T. Kwok, Z. Liang, B. Z. Tang and J. Yu, Chem. Commun., 2012, 48, 7167–7169 RSC.
- Z. Song, D. Mao, S. H. Sung, R. T. Kwok, J. W. Lam, D. Kong, D. Ding and B. Z. Tang, Adv. Mater., 2016, 28, 7249–7256 CrossRef CAS PubMed.
- M. T. Gabr and F. C. Pigge, Dalton Trans., 2018, 47, 2079–2085 RSC.
- H. Gao, X. Zhang, C. Chen, K. Li and D. Ding, Adv. Biosyst., 2018, 2, 1800074 CrossRef.
- J. Qi, C. Chen, D. Ding and B. Z. Tang, Adv. Healthcare Mater., 2018, 7, e1800477 CrossRef PubMed.
- P. Wu, X. Wang, Z. Wang, W. Ma, J. Guo, J. Chen, Z. Yu, J. Li and D. Zhou, ACS Appl. Mater. Interfaces, 2019, 11, 18691–18700 CrossRef CAS PubMed.
- C. Chen, H. Ou, R. Liu and D. Ding, Adv. Mater., 2019, e1806331, DOI:10.1002/adma.201806331.
- X. Ni, X. Zhang, X. Duan, H. L. Zheng, X. S. Xue and D. Ding, Nano Lett., 2019, 19, 318–330 CrossRef CAS PubMed.
- J. Qi, C. Chen, X. Zhang, X. Hu, S. Ji, R. T. K. Kwok, J. W. Y. Lam, D. Ding and B. Z. Tang, Nat. Commun., 2018, 9, 1848 CrossRef PubMed.
- Y. F. Xiao, F. F. An, J. X. Chen, J. Yu, W. W. Tao, Z. Yu, R. Ting, C. S. Lee and X. H. Zhang, Small, 2019, 15, e1903121 CrossRef PubMed.
- X. Guo, L. Wang, K. Duval, J. Fan, S. Zhou and Z. Chen, Adv. Mater., 2018, 30, 1705436 CrossRef PubMed.
- Z. Wang, W. Cheng, Y. Fang, Y. Hong and Y. Cheng, Polym. Chem., 2018, 9, 3205–3214 RSC.
- P. Huang, H. Song, Y. Zhang, J. Liu, J. Zhang, W. Wang, J. Liu, C. Li and D. Kong, ACS Appl. Mater. Interfaces, 2016, 8, 29323–29333 CrossRef CAS PubMed.
- S. Y. Li, L. H. Liu, R. Lei, W. X. Qiu, H. Z. Jia, B. Li, L. Fei and X. Z. Zhang, Adv. Mater., 2015, 25, 7317–7326 CAS.
- G. F. Jiang and Y. Tang, New J.Chem., 2017, 41, 6769–6774 RSC.
- J. A. Broussard, B. Rappaz, D. J. Webb and C. M. Brown, Nat. Protoc., 2013, 8, 265–281 CrossRef CAS PubMed.
Footnotes |
| † Electronic supplementary information (ESI) available. See DOI: 10.1039/c9bm01546a |
| ‡ These authors contributed equally. |
| This journal is © The Royal Society of Chemistry 2020 |

