Internal standard fluorogenic probe based on vibration-induced emission for visualizing PTP1B in living cells†
Qiuyu
Gong‡
ab,
Wenjing
Qin‡
a,
Peng
Xiao‡
c,
Xiang
Wu
c,
Lin
Li
 *a,
Gaobin
Zhang
a,
Renshuai
Zhang
a,
Jinpeng
Sun
*c,
Shao Q.
Yao
 *b and
Wei
Huang
ad
aKey Laboratory of Flexible Electronics (KLOFE) & Institute of Advanced Materials (IAM), Nanjing Tech University (Nanjing Tech), 30 South Puzhu Road, Nanjing, 211816, P. R. China. E-mail: iamlli@njtech.edu.cn
bDepartment of Chemistry, National University of Singapore, 3 Science Drive 3, 117543, Singapore. E-mail: chmyaosq@nus.edu.sg
cKey Laboratory Experimental Teratology of the Ministry of Education, Department of Biochemistry and Molecular Biology, Shandong University School of Medicine, Jinan, Shandong 250012, P. R. China. E-mail: sunjinpeng@sdu.edu.cn
dShaanxi Institute of Flexible Electronics (SIFE), Northwestern Polytechnical University, 127 West Youyi Road, Xi’an, 710072, P. R. China
First published on 25th October 2019
Abstract
Herein, as a proof of concept, we developed the first enzymatic VIE fluorogenic probe for protein tyrosine phosphatase 1B (PTP1B). The detection and imaging of PTP1B using VIE in living cells were both realized. Particularly importantly, the designed probe herein provides a guideline and platform for the development of new VIE-based enzymatic probes.
Vibration-induced emission (VIE), a specific fluorescence phenomenon that involves the intrinsic display of orange-red fluorescence for the free state but abnormal display of blue fluorescence in the constrained state, has drawn considerable attention because of its exploitation in flexible multi-color emission.1,2 Biological imaging based on the VIE phenomenon generates great interest for us since a distinctive change in fluorescence (large Stokes shift up) can be caused by an intrinsic change in the solubility of the molecule in question or by a change in its planarity. Hence, developing a VIE-based probe for visualizing enzyme activity is extraordinarily fascinating.
Phosphatases constitute a large and structurally diverse class of signalling enzymes that catalyze the removal of the phosphate group from their substrates and play important roles in human diseases.3 Protein phosphatases (PPs) are the most common and important phosphatases. Protein tyrosine phosphatases (PTPs, a major class of PPs) in particular are associated with tumorigenesis in numerous types of cells and tissues.4 Acid and alkaline phosphatases (ACP, ALP) are other important examples, as their levels of expression have been routinely used for disease diagnosis.5 Thus the biological fluorescence imaging/detection of the activities of phosphatases have attracted a lot of attention.6 Herein, as a proof of concept and taking advantage of the simply designed strategy used for phosphatase probes, we developed the first enzymatic VIE fluorogenic probe for a phosphatase. Very interestingly, this new probe exhibited a novel type of VIE performance. In contrast to the aforementioned VIE phenomenon, the new probe showed VIE before and after enzymatic reaction with protein tyrosine phosphatase 1B (PTP1B, a common phosphatase), i.e., the intensity of the red-light emission at a wavelength of about 600 nm remained almost constant during the reaction and acted as an “internal standard” while the intensity of the blue-light emission at about 450 nm increased as the reaction proceeded. Such “internal standard” probes show several advantages, e.g., no need for an “external standard” and independence of the fluorescence ratio.7 Meanwhile, the currently developed probe exhibited good selectivity towards PTP1B over other phosphatases and fast response features. Imaging of PTP1B in living cells by using this VIE trait was also realized.
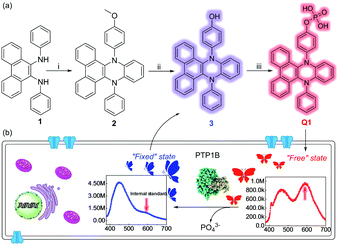
As shown in Fig. 1a, the phosphatase probe (Q1) was constructed by introducing a phosphate radical to the VIE matrix. The probe when showing good solubility in solvent exhibited the “free” vibration state, namely an emission of red light. And when the probe reacted with phosphatase, the fluorophore (3) showed a “fixed” vibration state that led to an emission of blue light. Importantly, the intensity of the emission of red light at about 600 nm remained almost constant during the course of the reaction while the intensity of the blue-light emission increased, which reflected the different solubilities to some extent. This hypothetical phenomenon was also in good accordance with the aforementioned VIE behavior and suggested that the probe can be used as a VIE-based imaging tool (Fig. 1b). Meanwhile, the structures of the intermediate product and Q1 were well characterized from 1H/13C-NMR and high-resolution mass spectra (ESI,† Fig. S1–S7).
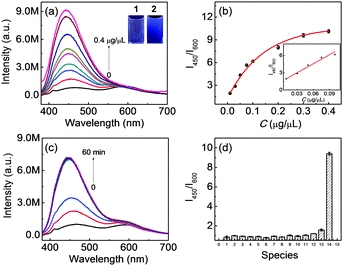
The fluorescence of Q1 in the absence/presence of PTP1B was studied first. (The absorption spectrum of Q1 is shown in Fig. S8, ESI.†) As shown in Fig. 2a, before the enzymatic reaction, Q1 itself showed fluorescence emissions both at 450 nm (quantum yield: 0.08) and 600 nm. Interestingly, after the enzymatic reaction with PTP1B (from lower concentration to higher concentration), the intensity of the emission at 450 nm increased evidently (quantum yield: 0.16), while that at 600 nm remained approximately constant, indicating that it can act as an “internal standard”. This curious phenomenon was similar to the previous VIE performance, but different from aggregation-induced emission (AIE). In the AIE case, the probe exhibits almost no fluorescence before the enzymatic reaction, and only after the reaction does the system show enhanced fluorescence.8 Meanwhile, in the current work, the color of solution changed from light red to blue (inset of Fig. 2a). The fluorescence intensity ratio I450/I600 was then used to judge the solubility of Q1 or 3 as well as to provide a quantitative determination of the concentration of PTP1B (i.e., the higher the I450/I600, the poorer the solubility of the compound or the higher the concentration of PTP1B in the reaction system). The I450/I600 values of both Q1 and 3 increased with decreasing content of DMSO, while the probe showed a lower I450/I600 value in the presence of the preferable co-solvent Triton-100 (Fig. S9, ESI†), i.e., Q1 displayed better solubility than did 3 here. This important phenomenon proved that the above fluorescence changes arose from the VIE phenomenon. Q1 also exhibited excellent response to PTP1B, with a fluorescence intensity showing a good linear relationship with PTP1B concentration in the concentration range of 0.01–0.1 μg μL−1 (Fig. 2b). The detection limit was determined to be 5.7 ng μL−1 of PTP1B. Notably, Q1 also showed a rapid response and good selectivity (Fig. 2c and d) under the optimized conditions (Fig. S10, ESI†) as well as good stability (Fig. S11, ESI†). Note that the enzymatic cleavage product was confirmed using mass spectral analysis (m/z = 449.4 [M]−; Fig. S12, ESI†). At the same time, the inhibitor and high-temperature experiments (i.e., where PTP1B was first treated with inhibitor or at high temperature, Fig. S13 and S14, ESI†) showed that the changes of I450/I600 values indeed originated from the enzymatic reaction. According to the Michaelis–Menten equation (Fig. S15, ESI†), the corresponding Michaelis constant (KM), the maximum of the initial reaction rate (Vmax), Kcat and Kcat/KM for the present enzymatic reaction were determined to be 94.56 μM, 0.4 μM s−1, 0.4 s−1 and 4.23 × 10³ s−1 M−1, respectively. Moreover, Q1 and 3 showed good biocompatibility (Fig. S16, ESI†).
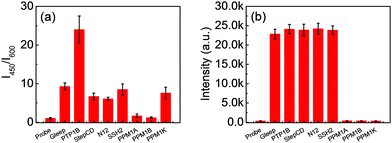
Surprisingly, we found that Q1 displayed a better response to PTP1B than to other common phosphatases. As shown in Fig. 3a and Fig. S17a (ESI†), the probe showed good selectivity for PTP1B over the other common phosphatases tested, namely Gleep, StepCD, N12, SSH2, PPM1A, PPM1B, PPMAK, ACP and ALP. (Except for ALP and ACP (purified), the other phosphatases were extracted and purified, Fig. S18, ESI†). On the other hand, Q1 showed no selectivity for TCPTP (data not shown). However, the commercial phosphatase probe (DiFMUP) exhibited poor selectivity for these phosphatases (Fig. 3b and Fig. S17b, ESI†).
To intensively study this surprising phenomenon, the molecular docking method was used. Unfortunately, we found that the probe was modelled to form interactions with these phosphatases similar to those modelled with PTP1B (Fig. S17c and d, ESI†). So, the preferable selectivity of the probe toward PTP1B can be attributed to steric hindrance of the probe to access the respective active sites of the phosphatases.6d,9
The potential of using the VIE probe to image living cells was a very attractive idea for us at this stage, so we utilized the probe to monitor PTP1B in living cells. Interestingly, as shown in Fig. S19 (ESI†), the ratio of the fluorescence intensity of the green channel (430–530 nm) to the nearly constant fluorescence intensity of the red channel (550–650 nm) for HeLa cells increased with incubation time (and the fluorescence of the merged images changed from yellow green to green), which indicated that Q1 can respond to PTP1B in living cells. Note that this phenomenon was in good accordance with the aforementioned VIE performance. A similar result was also found when using HepG2 cells (Fig. S20, ESI†).
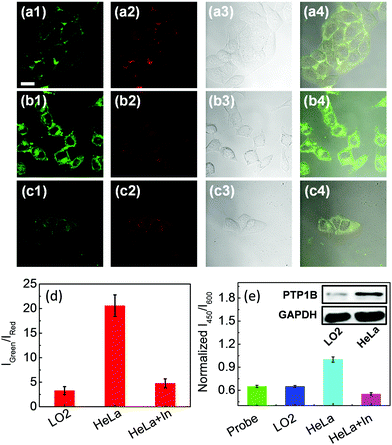
In order to further highlight the imaging properties of the probe, the endogenous PTP1B in LO2 and HeLa cells was monitored by Q1. As shown in Fig. 4a and b, the green fluorescence of HeLa cells was brighter than that of LO2 cells while the red fluorescence remained almost constant (and the fluorescence of the corresponding merged images was yellow green and green, respectively); at the same time, introduction of inhibitor (Na3VO4) also decreased the intensity of the green fluorescence (Fig. 4c), which led to the change of the ratio of the intensity of the green channel to that of the red channel (Fig. 4d). The above results indicated that the HeLa cells contained more PTP1B than did the other cells tested, which was confirmed by the cell lysate and Western blot analysis (Fig. 4e). The introduction of inhibitor also decreased this ratio in HepG2 cells (Fig. S21, ESI†). All of the above results demonstrated that the VIE fluorogenic probe can be used to detect and image PTP1B in living cells.
In summary, as a proof of concept, we have developed the first enzymatic VIE probe with internal standard properties for detecting PTP1B. This new probe exhibits a novel VIE performance before and after the enzymatic reaction with PTP1B, good selectivity over other phosphatases, and rapid response. The imaging of PTP1B by VIE in living cells was also realized. More importantly, the designed probe herein provides a guideline and platform for the development of new VIE-based enzymatic probes.
This work was financially supported by the National Natural Science Foundation of China (81672508), Jiangsu Provincial Foundation for Distinguished Young Scholars (BK20170041), Natural Science Foundation of Shaanxi Province (2019JM-016), China-Sweden Joint Mobility Project (51811530018), Fundamental Research Funds for the Central Universities, GSK-EDB Trust Fund (R-143-000-688-592) and Synthetic Biology Research & Development Programme (SBP) of the National Research Foundation (SBP-P4 and SBP-P8), Singapore. We also warmly thank Prof. He Tian from East China University of Science and Technology for insightful comments.
Live subject statement: HepG2, LO2 and HeLa cells were purchased from American Type Culture Collection (ATCC). The procedures used to prepare all of the biological samples are described in the ESI.†
Conflicts of interest
There are no conflicts to declare.Notes and references
- (a) W. Huang, L. Sun, Z. W. Zheng, J. H. Su and H. Tian, Chem. Commun., 2015, 51, 4462 RSC; (b) J. W. Chen, Y. S. Wu, X. D. Wang, Z. Y. Yu, H. Tian, J. N. Yao and H. B. Fu, Phys. Chem. Chem. Phys., 2015, 17, 27658 RSC; (c) Z. Y. Zhang, Y. S. Wu, K. C. Tang, C. L. Chen, J. W. Ho, J. H. Su, H. Tian and P. T. Chou, J. Am. Chem. Soc., 2015, 137, 8509 CrossRef CAS; (d) W. Chen, C. L. Chen, Z. Y. Zhang, Y. A. Chen, W. C. Chao, J. H. Su, H. Tian and P. T. Chou, J. Am. Chem. Soc., 2017, 139, 1636 CrossRef CAS; (e) Z. Y. Zhang, C. L. Chen, Y. A. Chen, Y. C. Wei, J. H. Su, H. Tian and P. T. Chou, Angew. Chem., Int. Ed., 2018, 57, 9880 CrossRef CAS; (f) H. Wang, Y. R. Li, Y. Y. Zhang, J. Mei and J. H. Su, Chem. Commun., 2018, 55, 1879 RSC; (g) Z. Y. Zhang, W. X. Song, J. H. Su and H. Tian, Adv. Funct. Mater., 2019, 1902803 CrossRef.
- (a) H. T. Zhou, J. Mei, Y. A. Chen, C. L. Chen, W. Chen, Z. Y. Zhang, J. H. Su, P. T. Chou and H. Tian, Small, 2016, 12, 6542 CrossRef CAS; (b) W. T. Dou, W. Chen, X. P. He, J. H. Su and H. Tian, Faraday Discuss., 2017, 196, 395 RSC; (c) Y. R. Li, Y. Liu, H. T. Zhou, W. Chen, J. Mei and J. H. Su, Chem. – Eur. J., 2017, 23, 9280 CrossRef CAS; (d) J. Wang, X. Y. Yao, Y. Liu, H. T. Zhou, W. Chen, G. C. Sun, J. H. Su, X. Ma and H. Tian, Adv. Opt. Mater., 2018, 6, 1800074 CrossRef; (e) L. J. Shi, W. X. Song, C. Lian, W. Chen, J. Mei, J. H. Su, H. L. Liu and H. Tian, Adv. Opt. Mater., 2018, 6, 1800190 CrossRef; (f) G. C. Sun, H. T. Zhou, Y. Liu, Y. R. Li, Z. Y. Zhang, J. Mei and J. H. Su, ACS Appl. Mater. Interfaces, 2018, 23, 20205 CrossRef; (g) H. V. Humeniuk, A. Rosspeintner, G. Licari, V. Kilin, L. Bonacina, E. Vauthey, N. Sakai and S. Matile, Angew. Chem., Int. Ed., 2018, 57, 10559 CrossRef CAS; (h) N. Wang, C. Q. Xin, Z. Li, G. B. Zhang, L. Bai, Q. Y. Gong, C. C. Xu, H. Xu, C. M. Yu, L. Li and W. Huang, Dyes Pigm., 2018, 163, 425 CrossRef.
- (a) Y. Shi, Cell, 2009, 139, 468 CrossRef CAS; (b) M. Kataria, S. Mouilleron, M. Y. Seo, C. C. Verge, P. M. Kim and F. Uhlmann, Nat. Struct. Mol. Biol., 2018, 25, 1093 CrossRef CAS; (c) A. Burdyga, N. C. Surdo, S. Monterisi, G. D. Benedetto, F. Grisan, E. Penna, L. Pellegrini, M. Zaccolo, M. Bortolozzi, P. Swietach, T. Pozzan and K. Lefkimmiatis, Proc. Natl. Acad. Sci. U. S. A., 2018, 115, E6497 CrossRef CAS.
- A. Östman, C. Hellberg and F. D. Böhmer, Nat. Rev. Cancer, 2006, 6, 307 CrossRef.
- (a) M. R. Bland, J. F. Loutit and J. M. Sansom, Brit. J. Cancer, 1974, 29, 206 CrossRef CAS; (b) W. D. Fraser, Curr. Opin. Rheumatol., 1997, 9, 347 CrossRef CAS; (c) A. Taira, G. Merrick, K. Wallner and M. Dattoli, Oncology, 2007, 21, 1003 Search PubMed; (d) A. R. Khan, F. R. Awan, S. Najam, M. Islam, T. Siddique and M. J. Zain, Pak. Med. Assoc., 2015, 65, 1182 Search PubMed; (e) J. F. Liu, D. R. Wang, J. Li, Y. Xiong, B. Liu, C. C. Wei, S. M. Wu, J. Lin and M. J. Liu, Stroke Cerebrovasc. Dis., 2016, 25, 2448 CrossRef PubMed.
- (a) Q. Wang, J. Scheigetz, B. Roy, C. Ramachandran and M. Gresser, Biochim. Biophys. Acta, Proteins Proteomics, 2002, 1601, 19 CrossRef CAS; (b) Q. Chen, N. Bian, C. Cao, X. L. Qiu, A. D. Qi and B. H. Han, Chem. Commun., 2010, 46, 4067 RSC; (c) L. Jia, J. P. Xu, D. Li, S. P. Pang, Y. Fang, Z. G. Song and J. Ji, Chem. Commun., 2010, 46, 7166 RSC; (d) T. I. Kim, H. Kim, Y. Choi and Y. Kim, Chem. Commun., 2011, 47, 9825 RSC; (e) L. Li, J. Y. Ge, H. Wu, Q. H. Xu and S. Q. Yao, J. Am. Chem. Soc., 2012, 134, 12157 CrossRef CAS; (f) L. Li, X. Q. Shen, Q. H. Xu and S. Q. Yao, Angew. Chem., Int. Ed., 2013, 52, 424 CrossRef CAS; (g) M. C. L. Yeung and V. W. W. Yam, Chem. Sci., 2013, 4, 2928 RSC; (h) L. Zhang, J. Zhao, M. Duan, H. Zhang, J. Jiang and R. Yu, Anal. Chem., 2013, 85, 3797 CrossRef CAS; (i) X. Gu, G. Zhang, Z. Wang, W. Liu, L. Xiao and D. A. Zhang, Analyst, 2013, 138, 2427 RSC; (j) J. Liang, R. T. Kwok, H. Shi, B. Z. Tang and B. Liu, ACS Appl. Mater. Interfaces, 2013, 5, 8784 CrossRef CAS; (k) Z. Song, R. T. Kwok, E. Zhao, Z. He, Y. Hong, J. W. Lam, B. Liu and B. Z. Tang, ACS Appl. Mater. Interfaces, 2014, 6, 17245 CrossRef CAS; (l) L. Dong, Q. Miao, Z. Hai, Y. Yuan and G. Liang, Anal. Chem., 2015, 87, 6475 CrossRef CAS PubMed; (m) X. F. Hou, Q. X. Yu, F. Zeng, J. H. Ye and S. Z. Wu, J. Mater. Chem. B, 2015, 3, 1042 RSC; (n) H. Zhang, C. Xu, J. Liu, X. Li, L. Guo and X. Li, Chem. Commun., 2015, 51, 7031 RSC; (o) Y. Tan, L. Zhang, K. H. Man, R. Peltier, G. C. Chen, H. T. Zhang, L. Y. Zhou, F. Wang, D. Ho, S. Q. Yao, Y. Hu and H. Y. Sun, ACS Appl. Mater. Interfaces, 2017, 9, 6796 CrossRef CAS; (p) H. W. Liu, K. Li, X. X. Hu, L. M. Zhu, Q. M. Rong, Y. C. Liu, X. B. Zhang, J. Hasserodt, F. L. Qu and W. H. Tan, Angew. Chem., Int. Ed., 2017, 56, 11788 CrossRef CAS; (q) H. T. Zhang, P. Xiao, Y. T. Wong, Y. Shen, M. Chhabra, R. Peltier, Y. Jiang, Y. H. He, J. He, Y. Tan, Y. S. Xie, D. Ho, Y. W. Lam, J. P. Sun and H. Y. Sun, Biomaterials, 2017, 140, 220 CrossRef CAS; (r) Q. Zhang, S. S. Li, C. X. Fu, Y. Z. Xiao, P. Zhang and C. F. Ding, J. Mater. Chem. B, 2019, 7, 443 RSC; (s) L. B. Xu, X. He, Y. B. Huang, P. Y. Ma, Y. X. Jiang, X. Liu, S. Tao, Y. Sun, D. Q. Song and X. H. Wang, J. Mater. Chem. B, 2019, 7, 1284 RSC.
- (a) K. Z. Gu, Y. S. Xu, H. Li, Z. Q. Guo, S. J. Zhu, S. Q. Zhu, P. Shi, T. D. James, H. Tian and W. H. Zhu, J. Am. Chem. Soc., 2016, 138, 5334 CrossRef CAS; (b) T. C. Ma, Y. Hou, J. F. Zeng, C. Y. Liu, P. S. Zhang, L. H. Jing, G. D. H. Shuang and M. Y. Gao, J. Am. Chem. Soc., 2018, 140, 211 CrossRef CAS; (c) S. W. Wang, K. Z. Gu, Z. Q. Guo, C. X. Yan, T. Y. Yang, Z. Chen, H. Tian and W. H. Zhu, Adv. Mater., 2019, 31, 1805735 CrossRef.
- (a) H. B. Shi, R. T. K. Kwok, J. Z. Liu, B. G. Xing, B. Z. Tang and B. Liu, J. Am. Chem. Soc., 2012, 134, 17972 CrossRef CAS; (b) M. G. Lin, J. Huang, F. Zeng and S. Z. Wu, Chem. – Asian J., 2019, 14, 802 CrossRef CAS; (c) M. Zhao, Y. J. Gao, S. Y. Ye, J. N. Ding, A. N. Wang, P. J. Li and H. B. Shi, Analyst, 2019, 144, 6262 RSC.
- T. I. Kim, M. S. Jeong, S. J. Chung and Y. Kim, Chem. – Eur. J., 2010, 16, 5297 CrossRef CAS.
Footnotes |
| † Electronic supplementary information (ESI) available. See DOI: 10.1039/c9cc07680h |
| ‡ These authors contributed equally to this work. |
| This journal is © The Royal Society of Chemistry 2020 |


