 Open Access Article
Intrinsic MRI contrast from amino acid-based paramagnetic ionic liquids†
Praveen Singh
Gehlot
 ab,
Hariom
Gupta
 *ac,
Mangal Singh
Rathore
a,
Kusum
Khatri
a and
Arvind
Kumar
 *a
*a
aAcademy of Scientific and Innovative Research (AcSIR), Ghaziabad-201002, India CSIR-Central Salt and Marine Chemicals Research Institute, Council of Scientific and Industrial Research, G. B. Marg, Bhavnagar, 364002, Gujarat, India. E-mail: mailme_arvind@yahoo.com; arvind@csmcri.res.in; Fax: +91-278-2567562; Tel: +91-278-2567039
bDepartment of Chemistry, Government Science College, Pardi, Valsad-396125, Gujarat, India
cAnalytical Chemistry Division, CSIR-Central Institute of Medicinal and Aromatic Plants (CSIR-CIMAP), Lucknow, India
First published on 11th August 2020
Abstract
Paramagnetic ionic liquids (PMILs) comprising of natural amino acids and tetrachloroferrate(III) as constituent ions were prepared that act as highly efficient dual mode (T1 and T2) responsive contrast agents for magnetic resonance imaging (MRI). The PMILs were characterized by ultraviolet-visible (UV), Raman and EPR spectroscopies, differential scanning calorimetry (DSC), thermogravimetric analysis (TGA), and inductively couple plasma mass spectrometry (ICP MS). DNA stability in the presence of the PMILs was investigated using fluorescence spectrophotometry, circular dichroism (CD), zeta potential analysis, and gel electrophoresis. The behavior of synthesized PMILs as contrast agents was determined and compared with commercially available contrast agents using the rate of relaxivity. The PMILs synthesized herein are environmentally friendly, biodegradable, cost effective, easy to synthesize, stable at cell physiological pH (7.4), non-hazardous to animal DNA, and hence hold promise for future clinical use.
1. Introduction
In medical science, identification of a target area is essential for the diagnosis of many diseases. Cells or lesions to be targeted can be visualized by using a tracking or sensing agent. For example, BaSO4 is used to enhance the contrast of a radiograph by opacifying parts of the gastrointestinal tract on an X-ray film so that a specific area can be more easily targeted. Magnetic resonance imaging (MRI) is also a well-known non-invasive technique for imaging affected tissue in various diseases, and principally, it is similar to the nuclear magnetic resonance (NMR) technique. In contrast with NMR, an MRI image is produced by spatially encoding the NMR signal generated from the proton relaxation of the object under the applied magnetic field.1 For clinical use, two types of MRI contrast agents have been synthesized: (1) dextran-coated superparamagnetic iron oxide nanoparticles (SPIONs), which generate darker images (T2 MRI negative contrast agents) and (2) Gd(III)-chelate-based complexes that generate brighter images (T1 MRI positive contrast agents).2For new contrast agents to be superior, they must overcome the poor resolution of the presently reported contrast agents, which may be due to weak contrast, low sensitivity, low intensity of the image, diagnostic time limitations, or a short signal for long-term in vivo measurements. Although researchers have reported and reviewed numerous contrast agents, only nanoparticles and chelate-based contrast agents have been approved by the US FDA (Food and Drug Administration).3,4 There are disadvantages to these contrast agents, such as low relaxation value, metal leaching problems, side effects that create severe diseases, nanoparticles that have the ability to interact with cells, and same-sized molecule-like proteins or enzymes that can distribute in cell plasma according to their surface charges.5 Dual T1 and T2 responses have been found in coated nanoparticles6 and hybrid lanthanide oxide nanoparticles.2,7
A Fe-based targeted contrast agent for cancer cells was recently patented, where Fe nanoparticles become captured by a larger complex ligand.8 In the present work, we synthesized iron-containing amino acid-based paramagnetic ionic liquids as alternative contrast agents to overcome the toxic and harmful side effects of contrast agents prepared from metallic solid nanoparticles using metal–ligand chemistry. It is well known that ionic liquids are considered as comparatively green chemicals and can be modified at the molecular level to achieve task-specific applications. With the reaction of 1-butyl-3-methylimidazolium chloride ([C4mim][Cl]) with ferric chloride (FeCl3), paramagnetic ionic liquids (PMILs) were synthesized for the first time by Satoshi and Hamaguchi et al.9 Many d- and f-block transition metal-based PMILs have subsequently been synthesized and used for numerous applications, including mapping and imaging of porous subterranean formation,10 and magnetic levitation of diamagnetic materials.11 Some PMILs have been explored for desulfurization,12 organic synthesis,13 micro extraction,14–16 electrocatalysis,17 probes for vesicles,18 self-assembling media for surfactants,19 acidic catalysis,20 density measurement,21 paramagnetic polymer synthesis,22,23 microemulsion formulation,24 chitosan-supported magnetic IL-based catalysis,25 CO2 separation,26 analytical applications,27,28 and other diverse applications.29–31 Brown et al. studied paramagnetic surfactants (magnetic surfactants) with symmetric [FeCl4]− and asymmetric anions [FeCl3Br]−.32 PMILs also have been considered for biological applications, for example, with genomic DNA to observe their interaction in the fields of pharmacokinetics and biotechnology and gain a deeper understanding of DNA preservation and stability,33 extraction of DNA,34 and drug delivery system.35
In continuation of such interesting applications, Daniel et al. revealed the utility of [FeCl4]− in a 1H NMR relaxation study, where they had measured magnetic relaxation in a mixture of [P66614][Cl] ionic liquid and mixtures of [P66614][FeCl4] with dimethyl sulfoxide (DMSO).36 In one of our previous reports, PMILs as surfactants were prepared, and were studied with DNA for use as MRI contrast agents.37 However, due to their amphiphilic nature, DNA compaction resulted.
Herein, non-amphiphilic amino acid-based PMILs were specifically prepared for use in MRI analysis (Table 1).38 These non-amphiphilic amino acid-based PMILs exhibit a strong dual response (T1 and T2 relaxation) in MRI that is rarely found in other complex molecules or hybrid metallic nanomaterials.2,6,39 PMILs have unique advantages over commercially available contrast agents with respect to the adverse effects that toxic metal ions such as Gd have on cell functionality,40 and damaging effects on cells and their physiology from metallic nanoparticles.5,41,42 PMILs are cost-effective and can be synthesized using a facile process. The physical interactions between PMILs and DNA were studied to reveal the optimum concentration range of PMILs in which DNA remains stable.
2. Experimental section
2.1 Materials
The amino acids glutamic acid, proline, alanine, and valine with >98% purity were purchased from TCI Chemical (India) Pvt. Ltd Ferric chloride hexahydrate (97% purity), ethidium bromide, Trizma base (99.9% purity), and sodium salt of deoxyribonucleic acid (DNA) from salmon testes were purchased as analytical reagent (AR) grade chemicals from Sigma-Aldrich. Methanol solvent and thionyl chloride of AR grade were procured from SD-Fine Chemicals Ltd, India. All chemicals were AR grade and used as received. Millipore grade water with specific conductivity of 3 μS cm−1 and surface tension of 71 mN m−1 was used for the solution preparation.2.2 Synthesis of PMILs
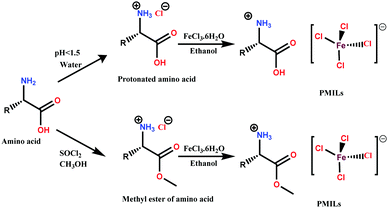
Two methods were used for the synthesis of PMILs: (1) without esterification of amino acids, and (2) with esterification of amino acids (Scheme 1).![[thin space (1/6-em)]](https://www.rsc.org/images/entities/char_2009.gif) :
:![[thin space (1/6-em)]](https://www.rsc.org/images/entities/char_2009.gif) 1.2 molar ratio) in 150 mL of methanol solvent was carried out and refluxed for more than one day. Progress of the reaction was monitored using ninhydrin spray. After completion of the reaction, the solvent was removed under reduced pressure, and the methyl ester of amino acid hydrochloride was stored in a desiccator, followed by a diethyl ether wash. These methyl esters of amino acid hydrochloride (5 g) were further reacted with ferric chloride hexahydrate in an equimolar ratio (1
1.2 molar ratio) in 150 mL of methanol solvent was carried out and refluxed for more than one day. Progress of the reaction was monitored using ninhydrin spray. After completion of the reaction, the solvent was removed under reduced pressure, and the methyl ester of amino acid hydrochloride was stored in a desiccator, followed by a diethyl ether wash. These methyl esters of amino acid hydrochloride (5 g) were further reacted with ferric chloride hexahydrate in an equimolar ratio (1![[thin space (1/6-em)]](https://www.rsc.org/images/entities/char_2009.gif) :
:![[thin space (1/6-em)]](https://www.rsc.org/images/entities/char_2009.gif) 1 mole eq.) in 100 mL of ethanol solvent. The reaction mixture was stirred at room temperature until completion of the reaction. The product was washed with a small amount of water to remove unreacted ferric chloride. Products were completely dried and stored in a vacuum desiccator to ensure that moisture would not affect the results.
1 mole eq.) in 100 mL of ethanol solvent. The reaction mixture was stirred at room temperature until completion of the reaction. The product was washed with a small amount of water to remove unreacted ferric chloride. Products were completely dried and stored in a vacuum desiccator to ensure that moisture would not affect the results.
The synthesized PMILs were characterized by CHN microanalysis, mass spectrometry (MS), NMR, and inductively couple plasma mass spectrometry (ICP MS). All characterization data are given in the ESI† (Table S1 and Fig. S1). The elemental percentage of Fe in PMILs is given in Table S2 (ESI†).
3.2 Methods
3. Results and discussion
3.1 Structural and thermal characterization of PMILs
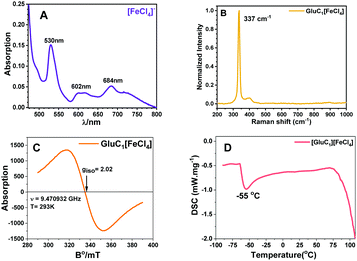
In PMILs, the anion [FeCl4]− is the component responsible for the paramagnetic properties of the system due to the involvement of a high spin with five unpaired electrons. The structure of paramagnetic anion was characterized using UV-Vis and Raman spectroscopies. The UV-Vis spectra of the anion ([FeCl4]−), which is common for all of the PMILs, is given in Fig. 1(A). In Fig. 1(A), the characteristic band has appeared between the ranges of 450 to 700 nm. The peak appearing at 529 nm can be assigned to the 6A1 → 4T2 (a) transition, the peak at 602 nm to the 6A1 → 4A2 transition, and the peak at 684 nm to the 6A1 → 4T2 (b) transition in Fe(III) ion in a tetrahedral environment.47These characteristic absorption bands confirm the existence of the [FeCl4]− anion, and are similar for all other PMILs. For further verification of the anion structure, Raman spectra of [FeCl4]− were recorded, and a representative Raman spectrum of (GluC1[FeCl4]) is given in Fig. 1(B). The Raman spectra of other PMILs are provided in the ESI† (Fig. S2). The characteristic single band appearing near 334 cm−1 is due to the vibration of the Fe–Cl bond in tetrahedral [FeCl4]− anion. This 334 cm−1 value belongs to the total symmetric vibration A1 mode that is similar to previously reported tetrachloroferrate(III)-like anion.12,48 The EPR spectrum of the [FeCl4]− constituent recorded at room temperature in solution phase indicated a single isotropic EPR line that is characteristic only of an unresolved 6S1 state. The EPR spectrum of the Fe3+ ion strongly depends on its environment in the tetrahedral crystal field.49 A high-quality, intensive signal from a symmetric anionic form of [FeCl4]− is seen in the EPR spectra in Fig. 1(C) and Fig. S3 (ESI†).
All these techniques collectively validate and confirm the paramagnetic nature and tetrahedral structure of [FeCl4]− anion (Td). Fig. 1(D) shows a DSC trace of GluC1[FeCl4]. The DCS thermogram of all PMILs show the glass transition temperature (Tg) below 100 °C, which satisfies the criteria for ionic liquids.44 The degradation temperature (Td) was measured from thermogravimetric analysis (TGA). The first change at the initial state indicates the removal of water molecules between 100 to 120 °C. After that, a large change was observed due to a loss of mass along with the temperature increase.50 The removal of water molecules indicates its water binding affinity, which enables high solubility in water. TGA and DSC traces for other PMILs are provided in Fig. S4 (ESI†). The experimental values of DSC and TGA for PMILs are given in Table S2 (ESI†).
2.2 DNA–PMIL interactions
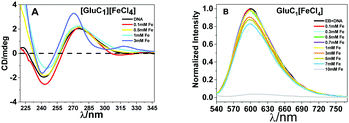
The fluorescence spectra confirmed that the tertiary structure of B–DNA was intact at a low concentration of Fe. Beyond this concentration (i.e., higher than 3 mmol L−1 Fe) the fluorescence intensity decreased due to the interaction of the cationic counterpart of PMILs with the minor groove of DNA via strong electrostatic interaction after complete removal of the spine of hydration.53 It can be assumed that small and more hydrated PMILs are incapable of efficiently displacing the EB due to weak interactions, and these interactions become more prominent when the concentration was increased (>3 mmol L−1 Fe). Less screened cations of PMILs interacted with the negative surface of DNA grooves, and consequently, EB effectively dislocated from its hydrophobic environment.54 The fluorescence spectra of DNA in the presence of other PMILs are given in the ESI,† (Fig. S6). These results validate the CD spectra results.
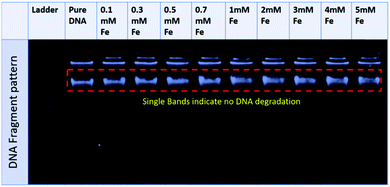 | ||
| Fig. 4 Agarose gel electrophoresis pattern for a representative PMIL, GluC1[FeCl4], at various Fe concentrations. | ||
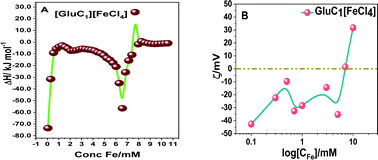
All the above results revealed that PMILs do not confer any type of negative effect on either DNA structure or its degradation. Because they have very weak or negligible interactions with DNA at the desired concentrations, diluted solutions of these PMILs can be used for biological applications such as bio imaging (MRI) application.
3.3 In vitro MRI and relaxivity analysis in aqueous medium
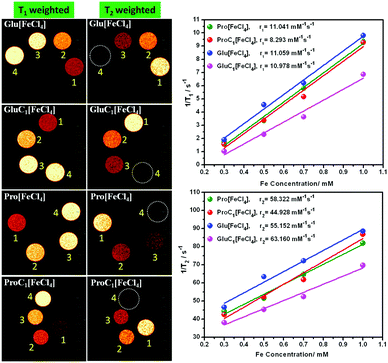
In vitro, MRI was performed under 11.7 Tesla, using a Bruker NMR spectrometer (500 MHz) with uniform capillaries. The longitudinal (r1) and transverse (r2) relaxivities were calculated from eqn (1), where c denotes the Fe concentration of PMILs in mmol L−1:| 1/Ti,c = 1/Ti,o + ric | (1) |
| PMILs | Osmolalitya (Osmol kg−1) | r 1 (mM−1 s−1) | r 2 (mM−1 s−1) | r 2/r1 |
|---|---|---|---|---|
| a Osmolality measured at 0.5 M Fe concentration of PMILs and 0.5 M Gd concentration of GD-BOTA at room temperature. | ||||
| Pro[FeCl4] | 2.7 | 11.04 | 58.32 | 5.28 |
| ProC1[FeCl4] | 3.1 | 8.29 | 44.93 | 5.42 |
| Glu[FeCl4] | 2.8 | 11.06 | 55.15 | 4.99 |
| GluC1[FeCl4] | 3.3 | 10.98 | 63.16 | 5.75 |
| Ala[FeCl4] | 3.2 | 6.64 | 37.27 | 5.61 |
| Val[FeCl4] | 3.2 | 6.81 | 38.43 | 5.64 |
| Gd-BOPTA | 1.9 | 4.31 | 4.95 | 1.20 |
The parameter r2/r1 was also measured for the investigated PMILs, and was found to be near 5. The r2/r1 ratio is theoretically always more significant when greater than 1.0. This indicates positive contrast with T1 mode, such as that obtained with Gd2O3 nanoparticles, which are a powerful T1 MRI-positive contrast agent with r2/r1 ≈ 1.0 due to a higher r1 value. However, Dy2O3 nanoparticles are considered to be a powerful T2 MRI negative contrast agent with higher r2/r1 (higher r2 value). The GDO (Gd–Dy oxide mixed) nanoparticles studied by Tegafaw et al. and hybrid lanthanide-based nanoparticles investigated by Hao et al. exhibited a dual response, and the reported intermediate r2/r1 values for these nanoparticles indicated that they are suitable for use as dual-model (T1 and T2) MRI contrast agents.2,7 Thus, our investigated PMILs can be labelled as dual responsive (T1 and T2) contrast agents because PMILs have intermediate r2/r1 values.
3.4 Comparison with a commercially available Gd-based contrast agent (gadobenate dimeglumine)
In this work, we carried out a comparative study of our PMIL- based MRI contrast agents with commercially available and FDA-approved Gd-based contrast agents. Here, for comparative studies, we selected gadobenate dimeglumine (Gd-BOPTA) as a model contrast agent. All experiments were carried out under same conditions, and we found that our PMIL-based contrast agents have properties comparable to those of Gd-based contrast agents, as well as significant MRI responses. From Fig. S12 (ESI†), it is clear that the conformation of B–DNA is stable at 5 mmol L−1 concentration (in terms of Gd). As can be seen from the results of various techniques employed for PMILs and after comparison with GD-BOPTA, the PMILs can be used as contrast agents in MRI diagnosis within a broad concentration range where DNA does not lose its structural and conformational stability and remains intact as native B-DNA. The relaxivity values (r1 and r2) for Gd-BOTPA are significantly too small compared to PMILs, and the ratio of r2/r1 for Gd-BOTPA is approximately 1.2, which indicates that it can be used only as a positive contrast agent (T1 mode) (Fig. 6).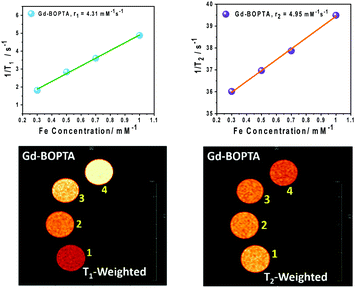 | ||
| Fig. 6 T 1 and T2 weighted MR images and relaxivity (r1 and r2) of Gd-BOPTA at various Gd concentrations. | ||
The osmolarity values for the PMILs are the total number of constituents of any species present in their solution by weight. The values were found to be in the range of 3 Osmol kg−1 for the investigated PMILs, which are comparable to the Gd-BOTA contrast agent. Low osmolality assists with reducing pain and other contrary effects during injection.59 The osmolality value of PMILs are given in Table 2.
3.5 Advantages of the investigated PMILs
Amino acid-based PMILs have several advantages over Gd-based or other available contrast agents. For example, Gwinn et al. reviewed the pros and cons of nanoparticle-based MRI contrast agents regarding health and concluded that the toxic effect of these nanoparticles is similar to that which results from exposure to airborne ultra-fine particles (UFPs), which causes diseases with long latency.5Tang et al. recently reviewed the various adverse effects of NPs on cell organelles, and reported that NPs cause mitochondrial dysfunction, endoplasmic reticulum stress, and lysosomal rupture.60 Gd-based contrast agents (GBCAs) used for MRI also adversely affect health. A report from an FDA drug safety newsletter has criticized GBCAs because of the drastic effect of Gd on health, and their detrimental effect upon the kidneys, such as fibrosing disease, NSF (nephrogenic systemic fibrosis) with acute or chronic severe renal (kidney) insufficiency, and renal dysfunction. Researchers have found accumulated gadolinium in the renal tissue of patients who developed NSF after the administration of GBCAs.40 The investigated PMILs in this manuscript have the following advantages:
(1) The synthesis process is simple, less time consuming, and cost-effective. Synthesis is carried out in an ethanol solvent medium to overcome the detrimental effect of methanol.
(2) Like metal–ligand-based MRI contrast agents, there is no requirement of a tedious pre-synthesis of ligands, costly precursors, reactants, toxic reagents, or volatile organic solvents for synthesis. Thus, such MRI contrast agents will be inexpensive products and can be prepared according to the principles of green synthesis.
(3) The problems regarding thermodynamic instability of the ligand-metal complexes are unlikely to occur with PMILs. Thus, metal leaching will not occur.
(4) The use of Fe metal in ionic liquids excludes the severe health problems and adverse effects that result from the use of toxic metals such as Gd.
4. Conclusions
Novel amino acid-based paramagnetic ionic liquids (PMILs) were synthesized via two methods: (1) without esterification and (2) with methyl esterification. The suitability of these PMILs to act as contrast agents in MRI applications was examined by studying their interactions with DNA, and determining if any alteration of structure or instability occurred in the DNA. The results indicated that DNA was stable and maintained its structural constancy up to a 3 mmol L−1 PMIL concentration (in terms of Fe).Solutions from 0.1 to 1 mmol L−1 concentration underwent in vitro MRI analysis. T1-weighted and T2-weighted image analysis confirmed their dual-mode behaviour as contrast agents. Comparisons of relaxivity and other physical properties of synthesized PMILs with those of commercially available Gd-based MRI contrast agents showed that PMILS are prominent contrast agents that can be used for MRI applications. Hence, further investigations such as in vivo MRI analysis are being conducted. Synthesized PMILs are appropriate for use as potential dual contrast agents for MRI, and further studies can be carried out to explore their real-time applications in medical science.
Conflicts of interest
There are no conflicts to declare.Acknowledgements
PRIS number CSIR-CSMCRI-47/2020. Financial support through a Senior Research Fellowship to P. S. G. from the University Grant Commission (UGC, Govt. of India) is also acknowledged here. The Department of Science and Technology (DST), India is acknowledged for financial support (No. EMR/2016/004747). The authors acknowledge the central instrumentation facility of CSIR-CSMCRI for assisting with sample characterization.References
- P. A. Bottomley, T. H. Foster, R. E. Argersinger and L. M. Pfeifer, Med. Phys., 1984, 11, 425–448 CrossRef CAS PubMed.
- T. Tegafaw, W. Xu, M. W. Ahmad, J. S. Baeck, Y. Chang, J. E. Bae, K. S. Chae, T. J. Kim and G. H. Lee, Nanotechnology, 2015, 26, 365102 CrossRef PubMed.
- Y. Xiao and J. Du, J. Mater. Chem. B, 2020, 8, 354–367 RSC.
- C. Tapeinos, M. Battaglini, A. Marino and G. Ciofani, J. Mater. Chem. B, 2020, 8, 6233–6251 RSC.
- M. R. Gwinn and V. Vallyathan, Environ. Health Perspect., 2006, 1818–1825 CrossRef CAS PubMed.
- T.-H. Shin, J.-s. Choi, S. Yun, I.-S. Kim, H.-T. Song, Y. Kim, K. I. Park and J. Cheon, ACS Nano, 2014, 8, 3393–3401 CrossRef CAS PubMed.
- Z. Yi, X. Li, W. Lu, H. Liu, S. Zeng and J. Hao, J. Mater. Chem. B, 2016, 4, 2715–2722 RSC.
- T. Hyeon, K. Na, D. Ling and W. Park, US Pat., 20160089455A1, 2016 Search PubMed.
- H. Satoshi and H. Hiro-o, Chem. Lett., 2004, 33, 1590–1591 CrossRef.
- H. V. Ersoz, US Pat., 20130314080A1, 2013 Search PubMed.
- G. M. Whitesides, A. Ellerbee and S. Tricard, US Pat., 13989725, 2016 Search PubMed.
- T. Yao, S. Yao, C. Pan, X. Dai and H. Song, Energy Fuels, 2016, 30, 4740–4749 CrossRef CAS.
- F. Shi, J. Peng and Y. Deng, J. Catal., 2003, 219, 372–375 CrossRef CAS.
- T. Chatzimitakos, C. Binellas, K. Maidatsi and C. Stalikas, Anal. Chim. Acta, 2016, 910, 53–59 CrossRef CAS PubMed.
- M. J. Trujillo-Rodríguez, O. Nacham, K. D. Clark, V. Pino, J. L. Anderson, J. H. Ayala and A. M. Afonso, Anal. Chim. Acta, 2016, 934, 106–113 CrossRef PubMed.
- J. Merib, D. A. Spudeit, G. Corazza, E. Carasek and J. L. Anderson, Anal. Bioanal. Chem., 2018, 410, 4689–4699 CrossRef CAS PubMed.
- K. F. Wang, L. Zhang, R. R. Zhuang and F. F. Jian, Transition Met. Chem., 2011, 36, 785–791 CrossRef CAS.
- S. Kim, C. Bellouard, J. Eastoe, N. Canilho, S. E. Rogers, D. Ihiawakrim, O. Ersen and A. Pasc, J. Am. Chem. Soc., 2016, 138, 2552–2555 CrossRef CAS PubMed.
- A. Klee, S. Prevost and M. Gradzielski, ChemPhysChem, 2014, 15, 4032–4041 CrossRef CAS PubMed.
- A. Khalafi-Nezhad and S. Mohammadi, ACS Comb. Sci., 2013, 15, 512–518 CrossRef CAS PubMed.
- D. K. Bwambok, M. M. Thuo, M. B. Atkinson, K. A. Mirica, N. D. Shapiro and G. M. Whitesides, Anal. Chem., 2013, 85, 8442–8447 CrossRef CAS PubMed.
- J. Thévenot, H. Oliveira, O. Sandre and S. Lecommandoux, Chem. Soc. Rev., 2013, 42, 7099–7116 RSC.
- M. Döbbelin, V. Jovanovski, I. Llarena, L. J. C. Marfil, G. Cabañero, J. Rodriguez and D. Mecerreyes, Polym. Chem., 2011, 2, 1275–1278 RSC.
- A. Klee, S. Prevost, W. Kunz, R. Schweins, K. Kiefer and M. Gradzielski, Phys. Chem. Chem. Phys., 2012, 14, 15355–15360 RSC.
- A. Khalafi-Nezhad and S. Mohammadi, RSC Adv., 2014, 4, 13782–13787 RSC.
- E. Santos, J. Albo, A. Rosatella, C. A. Afonso and Á. Irabien, J. Chem. Technol. Biotechnol., 2014, 89, 866–871 CrossRef CAS.
- K. D. Clark, O. Nacham, J. A. Purslow, S. A. Pierson and J. L. Anderson, Anal. Chim. Acta, 2016, 934, 9–21 CrossRef CAS PubMed.
- J. L. Anderson and K. D. Clark, Anal. Bioanal. Chem., 2018, 410, 4565–4566 CrossRef CAS PubMed.
- A. Joseph, G. Żyła, V. I. Thomas, P. R. Nair, A. Padmanabhan and S. Mathew, J. Mol. Liq., 2016, 218, 319–331 CrossRef CAS.
- A. Kulshrestha, G. Kumar, N. H. Khan and A. Kumar, J. Mol. Liq., 2019, 112157, DOI:10.1016/j.molliq.2019.112157.
- M. Konwar, H. M. F. Elnagdy, P. S. Gehlot, N. D. Khupse, A. Kumar and D. Sarma, J. Chem. Sci., 2019, 131, 80 CrossRef.
- P. Brown, A. Bushmelev, C. P. Butts, J. Cheng, J. Eastoe, I. Grillo, R. K. Heenan and A. M. Schmidt, Angew. Chem., Int. Ed., 2012, 51, 2414–2416 CrossRef CAS PubMed.
- K. D. Clark, M. Sorensen, O. Nacham and J. L. Anderson, RSC Adv., 2016, 6, 39846–39851 RSC.
- K. D. Clark, O. Nacham, H. Yu, T. Li, M. M. Yamsek, D. R. Ronning and J. L. Anderson, Anal. Chem., 2015, 87, 1552–1559 CrossRef CAS PubMed.
- A. Kulshrestha, P. S. Gehlot and A. Kumar, J. Mater. Chem. B, 2020, 8, 3050–3057 RSC.
- C. I. Daniel, F. N. Vaca Chávez, C. A. Portugal, J. G. Crespo and P. J. Sebastiao, J. Phys. Chem. B, 2015, 119, 11740–11747 CrossRef CAS PubMed.
- P. S. Gehlot, H. Gupta and A. Kumar, Colloid Interface Sci. Commun., 2018, 26, 14–23 CrossRef CAS.
- A. Kumar, H. Gupta, P. Singh Gehlot and S. Mangal Rathore, Indian Pat., IN201711043528, 2019 Search PubMed.
- S. Ye, Y. Liu, Y. Lu, Y. Ji, L. Mei, M. Yang, X. Gong, Q. Gu, D. Li, F. Yang and C.-J. Li, J. Mater. Chem. B, 2020, 8, 447–453 RSC.
- W. A. High, R. A. Ayers, J. Chandler, G. Zito and S. E. Cowper, J. Am. Acad. Dermatol., 2007, 56, 21–26 CrossRef PubMed.
- M. Agarwal, M. Murugan, A. Sharma, R. Rai, A. Kamboj, H. Sharma and S. K. Roy, Int. J. Curr. Microbiol. Appl. Sci., 2013, 2, 39 Search PubMed.
- N. Hoshyar, S. Gray, H. Han and G. Bao, Nanomedicine, 2016, 11, 673–692 CrossRef CAS PubMed.
- J. Li and Y. Sha, Molecules, 2008, 13, 1111–1119 CrossRef CAS PubMed.
- M. Li, S. L. De Rooy, D. K. Bwambok, B. El-Zahab, J. F. DiTusa and I. M. Warner, Chem. Commun., 2009, 6922–6924 RSC.
- A. Bhadani and S. Singh, Langmuir, 2011, 27, 14033–14044 CrossRef CAS PubMed.
- H. Gupta, P. Paul, N. Kumar, S. Baxi and D. P. Das, J. Colloid Interface Sci., 2014, 430, 221–228 CrossRef CAS.
- T. Bäcker, O. Breunig, M. Valldor, K. Merz, V. Vasylyeva and A.-V. Mudring, Cryst. Growth Des., 2011, 11, 2564–2571 CrossRef.
- M. S. Sitze, E. R. Schreiter, E. V. Patterson and R. G. Freeman, Inorg. Chem., 2001, 40, 2298–2304 CrossRef CAS PubMed.
- W. Dariusz, S. Artur, K. Julia, M. Jerzy, S. Emilia and W. Zygmund, Z. Anorg. Allg. Chem., 2009, 635, 1249–1253 CrossRef.
- C. P. Fredlake, J. M. Crosthwaite, D. G. Hert, S. N. Aki and J. F. Brennecke, J. Chem. Eng. Data, 2004, 49, 954–964 CrossRef CAS.
- Y.-M. Chang, C. K.-M. Chen and M.-H. Hou, Int. J. Mol. Sci., 2012, 13, 3394–3413 CrossRef CAS PubMed.
- J.-B. Le Pecq and C. Paoletti, Anal. Biochem., 1966, 17, 100–107 CrossRef CAS PubMed.
- A. Chandran, D. Ghoshdastidar and S. Senapati, J. Am. Chem. Soc., 2012, 134, 20330–20339 CrossRef CAS PubMed.
- S. Satpathi, A. Sengupta, V. Hridya, K. Gavvala, R. K. Koninti, B. Roy and P. Hazra, Sci. Rep., 2015, 5, 9137 CrossRef.
- K. Rawat, J. Pathak and H. Bohidar, Phys. Chem. Chem. Phys., 2013, 15, 12262–12273 RSC.
- S. Hou, N. Ziebacz, S. A. Wieczorek, E. Kalwarczyk, V. Sashuk, T. Kalwarczyk, T. S. Kaminski and R. Holyst, Soft Matter, 2011, 7, 6967–6972 RSC.
- Z. Ziraksaz, A. Nomani, M. Ruponen, M. Soleimani, M. Tabbakhian and I. Haririan, Eur. J. Pharm. Sci., 2013, 48, 55–63 CrossRef CAS PubMed.
- S. Eastman, C. Siegel, J. Tousignant, A. Smith, S. Cheng and R. Scheule, Biochim. Biophys. Acta, Biomembr., 1997, 1325, 41–62 CrossRef CAS.
- J. A. Peters and K. Djanashvili, Reference Module in Materials Science and Materials Engineering, Elsevier, 2016 DOI:10.1016/B978-0-12-803581-8.01826-9.
- N. Liu and M. Tang, J. Appl. Toxicol., 2020, 40, 16–36 CrossRef CAS PubMed.
Footnote |
| † Electronic supplementary information (ESI) available. See DOI: 10.1039/d0ma00339e |
| This journal is © The Royal Society of Chemistry 2020 |


