 Open Access Article
Improved catalytic effect and metal nanoparticle stability using graphene oxide surface coating and reduced graphene oxide for hydrogen generation from ammonia–borane dehydrogenation†
Samikannu
Prabu
 and
Kung-Yuh
Chiang
 *
*
Graduate Institute of Environmental Engineering, National Central University, Tao-Yuan city, 32001, Taiwan. E-mail: kychiang@ncu.edu.tw
First published on 28th July 2020
Abstract
The development of high catalytic effective catalysts for hydrogen generation through dehydrogenation (hydrolysis) of aqueous NH3BH3 (AB) solution is discussed in this work. Bimetallic NiPt, CoPt and monometallic Ni, Co, Pt nanoparticles (NPs) supported on mixed graphene oxide (GO) and reduced graphene oxide rGO (carbon materials) were produced and studied for hydrogen generation from AB hydrolytic dehydrogenation. Herein, we have developed fine, spherically-shaped bimetallic and monometallic Ni, Co, Pt NPs on mixed GO and rGO for extremely high reactant productivity in aqueous AB hydrolysis. The Co0.8Pt0.2/GO and rGO, Ni0.8Pt0.2/GO and rGO catalysts show high catalytic performance and high turnover frequency (TOF) of 230.76 and 214.28 (H2) mol. (cat. metal) mol−1 min−1 at 25 °C. This is the greatest efficiency ever shown for transition metal-doped GO and rGO catalysts. The catalysts additionally show superior catalytic stability by maintaining up to 98% activity after 7 runs at 25 °C. The development of well-organized and inexpensive Co0.8Pt0.2/GO and rGO, Ni0.8Pt0.2/GO and rGO catalysts improve the possibility of using aqueous AB as chemical hydrogen storage. This permits the discovery of additional hydrogen fuel-cell applications. The simple and facile production of other GO and rGOs can assist in transition metal NPs.
1. Introduction
The rapid consumption and decrease of fossil fuels have pushed the focus towards economical energy techniques for producing hydrogen gas. Hydrogen gas is a wonderful energy carrier that addresses the difficulties in energy conservation and future energy alternatives. Still, after several years of development, the H2 storage efficiency is one of the interesting barriers in hydrogen generation techniques. Characteristic H2 storage in chemicals mixtures, such as formic acid (HCOOH), hydrous hydrazine (N2H4·H2O), methanol (CH3OH), and ammonia borane (NH3BH3) has the hydrogen limit of 4.4, 8.0, 18.8, and 19.6 wt%, respectively. AB is a remarkable H2 storage catalyst due to its high hydrogen content (19.6 wt%), high durability in the liquid state at room temperature (25 °C), and non-toxicity.1,2 It can also generate hydrogen quickly at room temperature (at 25 °C) in a safe system by the use of catalysts, which is truly a reasonable method for hydrogen generation from AB solution.3 Effective catalysts are normally built from suitable metals (such as, Pt Pd, Au, and Ru),4 which profoundly constrain economical applications. Hence, research in non-conventional metal-based catalysts for AB hydrolysis in the generation of hydrogen is really important.Some transition metal NPs have shown amazing catalytic efficiencies.5,6 Therefore, studying the reasonable relationship between the catalytic performance and the metal support is essential. The quantitative recognition of the nature of metal–support interfaces in the absence of detailed information on hydrolysis reaction and catalytic active sites remains a field of interest. The established hydrolysis reaction methods under homogeneous catalysis cannot be straightforwardly connected to heterogeneous catalysis in the presence of the phase interface and complex active sites in heterogeneous catalysis.7
Hydrogen generation by means of thermal decomposition, for example, aqueous AB solution hydrolysis in the presence of an acceptable catalyst produces three moles of hydrogen gas per mole of AB solution at 25 °C (eqn (1)). This makes it a compelling catalyst for hydrogen generation from AB.
| NH3BH3(aq) + 2H2O (l) → NH4 + (aq) + BO2 − (aq) + 3H2 (g) | (1) |
For the most part, Pt,8–12 Ru,13–15 and Pd16 based catalysts outshine non-noble metals, such as Ni, Cr,17 Co,18–20 RuPd@GO,21 Ag/Pd,22,23 Fe,24,25 Ag–Ni based nanoparticles,26 Au–Pd,27 mesoporous carbon nitride supported Pd and Pd–Ni NPs,28 PdNi–CeO2,29 NiPt NPs with supported CeO230 (efficient hydrogen generation from an alkaline solution of hydrazine), N-doped graphene supported Co–CeOx,31 and transition metal nanoparticles with GO32 for hydrogen generation under the above conditions. Though there has been development in the catalytic efficiencies of bimetallic catalysts, for example, Co–Pd33,34 and core–shell species such as Au@Co,35 and monometallic catalysts, the general utilization of these noble metals is restricted by their high cost and the extraordinary amount required. To solve this issue, the search for abundant metal catalysts with durable catalytic activities that can be utilized at 25 °C is very urgent and essential.
One useful surface approach is to modulate the contribution of active metal NPs. A single-atom two-dimensional material exhibits interesting properties, such as a high specific surface area, high catalytic efficiency, fine and spherically-shaped particles, and conserved charge transfer, and is, therefore, an ideal substrate for the advancement and affixing of metal NPs such as, graphene, GO, and carbon nanotubes.36,37 In spite of the staggering expense of graphene, graphene-supported metal NPs have become noteworthy supports because of their potential applications in a few specialized areas such as catalysis, devices, and energy conversion.38 Of late, metal oxides such as TiO2, SnO2, Fe3O4, SiO2, and CeO2 have been commonly utilized as catalyst promoters to build reactant stability and metal nanocatalyst activity.39 Among the examined metal oxides, the rare-earth metal oxide CeO2 is of considerable importance because of its rich oxygen defects, high oxygen storage capacity, and cost-effectiveness.40–45 In this situation, the presence of an M/CeO2/graphene triple convergence with the CeO2 mixture, a metal, and graphene may potentially produce a catalyst with remarkably improved catalytic activity for the dehydrogenation of aqueous AB as well as dispensability in the catalytic process.
Herein, we report a green and facile preparation for the synthesis of well-dispersed Co0.8Pt0.2/GO and rGO, Ni0.8Pt0.2/GO rGO catalysts that were utilized for catalytic hydrogen generation from AB hydrolytic dehydrogenation at 25 °C. Incredibly, the prepared noble-metal Co0.8Pt0.2/GO and rGO, Ni0.8Pt0.2/GO and rGO catalysts demonstrate higher catalytic performance, 100% hydrogen selectivity, and strong durability for hydrogen generation from AB, with 3 equivalents per mmole of AB generated within 0.6 and 0.5 min, respectively. The CoPt/GO and rGO, NiPt/GO and rGO catalysts demonstrate that they have the most important role in improving the metal NP catalytic efficiency. Because of the synergistic effect among CoPt and NiPt NPs supported on GO and rGO and the strong metal–support interface between the metals and the supporter, the prepared Co0.8Pt0.2/GO and rGO, Ni0.8Pt0.2/GO and rGO catalysts showed greater catalytic efficiency for hydrogen generation from aqueous AB solution, with TOF of 230.76 and 214.28 min−1 at 25 °C, respectively.
2. Experimental section
2.1 Chemicals and reagents
Graphite, sodium nitrate (NaNO3) (Fischer synthetic chemicals), sulfuric acid (H2SO4) (Sigma Aldrich), potassium permanganate (KMnO4), hydrogen peroxide (H2O2), cobalt(II) nitrate hexahydrate (Co(NO3)2·6H2O), nickel(II) nitrate hexahydrate (Ni(NO3)2·6H2O), chloroplatinic corrosive hexahydrate (H2PtCl6), and ammonia borane (NH3BH3).2.2 Graphene oxide (GO) preparation
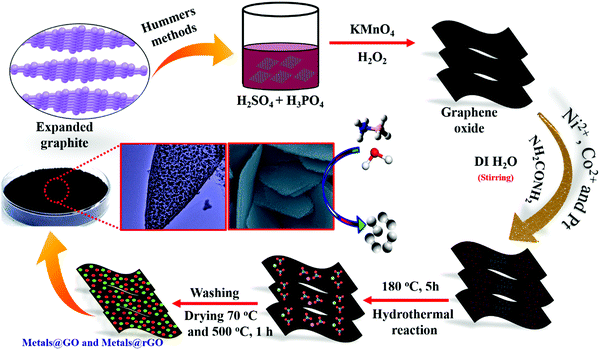
In the characteristic synthetic method, pure graphite powder was first oxidized using a modified Hummers’ procedure to procure graphene oxide (GO). In this strategy, 2 g of graphite powder and one gram of sodium nitrate (NaNO3) were mixed in 40 mL sulfuric acid solution (H2SO4) (Sigma Aldrich) under continuous magnetic stirring for 3 h at room temperature. Eight grams of potassium permanganate (KMnO4) was then added slowly into the solution and the solution was constantly stirred until it turned a dull dark color. Deionized (DI) water (100 mL) was delicately added to the solution and the solution was kept at 70 °C for 30 min. Finally, 250 mL of DI water was added to remove the excess of KMnO4. Next, 0.675 mL of hydrogen peroxide (H2O2) was added slowly and continuously stirred for 15 min. Next, hydrochloric acid and H2O in the 1![[thin space (1/6-em)]](https://www.rsc.org/images/entities/char_2009.gif) :
:![[thin space (1/6-em)]](https://www.rsc.org/images/entities/char_2009.gif) 3 ratio were added and centrifuged utilizing a Table Top Centrifuge at 7000 rpm for 5 min. At that point, the supernatant was washed with DI water a few times. The washed GO supernatant was dried utilizing a stove at 70 °C for 24 h to obtain the graphene oxide powder.
3 ratio were added and centrifuged utilizing a Table Top Centrifuge at 7000 rpm for 5 min. At that point, the supernatant was washed with DI water a few times. The washed GO supernatant was dried utilizing a stove at 70 °C for 24 h to obtain the graphene oxide powder.
2.3 Metal-doped GO and rGO NP preparation
CoNi@GO and rGO, CoPt@GO and rGO, NiPt@GO and rGO, Pt@GO, Co@GO, Ni@GO, 0.2 g of GO, and 0.0049 M urea were suspended in 20 mL of DI water and sonicated to obtain the dispersed GO solution. 5 mL of an aqueous solution containing Co(NO3)2·6H2O (0.1 M), and Ni(NO3)2·6H2O and H2PtCl6 (0.012 M) was added into the above solution and sonicated for 5 min. Subsequently, the solution was transferred into a 50 mL Teflon-lined stainless-steel autoclave. The autoclave was fixed and heated at 180 °C for 5 h in an oven. Accordingly, after the hydrothermal reaction, the acquired product was gathered through centrifugation and washed with DI water five times. The final product M@GO and rGO (M–Co, Ni, and Pt) was obtained after it was dried under an oxygen environment at 70 °C for 24 h. The product M@GO and rGO was also toughened with calcination at 500 °C for 1 h. The final composition of the catalysts was determined by ICP-AES (Table S1, ESI†). This scheme led to the synthesis of Co0.4Ni0.6/GO, Co0.6Ni0.4/GO, Co0.8Pt0.2/GO, and Ni0.8Pt0.2/GO catalysts.2.4 Characterization
Powder X-ray diffraction (XRD) patterns were obtained utilizing a Bruker D8 PHASER X-ray diffractometer with GO monochromatized Cu Kα radiation (λ = 1.5406 Å) at a scanning rate of 5° min−1. The microstructure and particle sizes of the catalysts were obtained from a transmission electron microscope (TEM). A field emission scanning electron microscope (FESEM, JEOL JSM 7600F) along with an energy dispersive X-ray detector (EDX) was utilized for investigating the morphology and FT-IR spectroscopy was used for identifying the hydrogen and oxygen molecular cell arrangements.2.5 AB hydrogenation
Reaction devices were utilized for hydrogen generation from aqueous AB solution hydrolysis. Typically, the solution (10 mL) with the catalyst was placed in a two-necked round bottom flask. A hydrogen gas burette filled with water was linked with one neck of the reaction flask (the other neck was shut with a stopper) to determine the volume (mL) of hydrogen gas. The reaction flask temperature was kept steady at 25 °C using a flowing water bath under ambient atmosphere. The catalytic reaction was activated once 2 mmol of the AB (0.0686 g) solution was added into the reaction flask using a syringe. The volume of H2 generated was determined by recording the water displacement in the gas burette, as shown in Fig. S1 (ESI†). The reaction was considered to be complete when H2 generation was observed.The above method was also utilized for characterizing the catalytic efficiency of other catalysts for H2 generation from aqueous AB solution hydrolysis. The nM/AB molar ratio for each one of the reactions was maintained at 0.04 M. The improvement in the catalytic performance over the Ni0.8Pt0.2/GO and rGO (optimum catalyst), Co0.8Pt0.2/GO and rGO NPs was observed at various temperatures (278 K, 283 K, 288 K, 293 K, 298 K, and 303 K) to determine the actuation energy (Ea) for the aqueous AB hydrolysis reaction. An equivalent procedure was additionally helpful to for determining the catalytic performance of the catalytic reaction with 100 mg of nanoparticles as the catalyst in the presence of different added substances (NaOH, KOH, NaH2PO4, NH4OH, and NaCl). However, the above-mentioned substances were added prior to adding the aqueous AB solutions into the reaction flask.
2.6 Durability test
For the durability test, after the catalytic hydrolysis reaction of the aqueous AB solution was completed, the catalyst was kept in the reaction flask and a further aliquot of aqueous AB solution (2 mmol (0.0686 g)) was consequently added to it. The catalyst recovery tests for aqueous AB solution hydrolysis were carried out for 10 runs at 25 °C.2.7 Calculation method
The turnover frequency (TOF) values described at this time equal the TOF values established from the number of metal atoms in the catalyst, as calculated from eqn (S1):| TOF = nH2/(nM × t) | (S1) |
3. Results and discussion
3.1 Structure and morphology
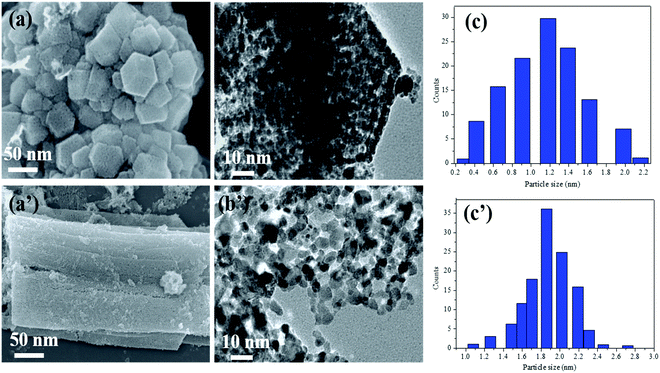
An advanced chemical reduction method was utilized for the combination of Ni–Pt/GO, Co–Pt, and Ni–Co NPs (Scheme 1). Typically, for the preparation of Ni0.8Pt0.2/GO and rGO, Co0.8Pt0.2/GO and rGO, Co(NO3)2·6H2O (0.1 M), and Ni(NO3)2·6H2O and H2PtCl6 (0.012 M) were mixed with 5 mL of an aqueous solution containing highly dispersed GO (0.2 g) and the above solution was sonicated for 5 min. The solution was moved to a 50 mL Teflon-lined stainless-steel autoclave. The autoclave was fixed and heated at 180 °C for 5 h in an oven. After completion, Ni0.8Pt0.2/GO and rGO, Co0.8Pt0.2/GO and rGO NPs were obtained as the products and were utilized as catalysts for hydrogen generation from AB hydrolysis at 25 °C (for details, see the Experimental section).The Ni0.8Pt0.2/GO and rGO, Co0.8Pt0.2/GO and rGO NPs morphologies were characterized using scanning electron microscopy (FESEM) and transition electron microscopy (TEM) images, as shown in Fig. 1. The process can be seen in Fig. 1b; NiPt NPs with fine and small sizes of about 1.5 nm (Fig. 1c) are well-spread onto the GO and rGO sheets, as shown by the FESEM result (Fig. 1a). In any case, the synthesized CoPt/GO and rGO NPs have a small, spherically-shaped particle size of about 1.9 nm (Fig. 1b′ and c′). By observing the TEM images of Ni0.8Pt0.2/GO and rGO NPs, Co0.8Pt0.2/GO and rGO NPs, it can be clearly seen that CoO doping into the NiO NPs can cause a decrease in the metal NP sizes. In order to further investigate, the metal-doped GO NPs obtained with a different (Co + Ni) molar ratio are named as CoNi/GO. The typical FESEM and TEM images of the obtained CoNi/GO catalysts are demonstrated in Fig. S3 (ESI†). The nanosheet shape of GO is wide-ranging and uniform after the CoNi NPs are loaded via the reduction reaction. It can be seen from the FESEM (Fig. S3a, ESI†) and bright-field TEM (Fig. S3b, ESI†) images that the CoNi NPs acquired through the rapid reduction process (Co + Ni) are highly distributed into the Co0.6Ni0.4/GO and Co0.4Ni0.6/GO NPs. The mean particle sizes are about 3.2 nm and 4.2 nm (Fig. S3c and f, ESI†), respectively, with further evidence of the existence of Co, Ni, and Pt in the doped samples. EDX was used to observe the elemental composition of the doped samples. After the EDX spectroscopy investigation, the results obtained reveal that the samples are composed of C, O, Co, Ni, and Pt elements that are found in all the catalysts and the total compositional atomic percentages of C, O, Co, Ni, and Pt were estimated. Table summarizes (inside the EDX spectrum) the elements in the nanostructures (Fig. S4, ESI†) and the occurrence of Ni, Co, C, and O was recognized by elemental mapping (Fig. S5 and S6, ESI†). It can be obviously seen that the distribution of Ni, Co, C, and O elements is very consistent with that shown in the FESEM images.
For investigating the feasibility of the NPs, we observed and associated the monometallic Pt/GO and Co/GO catalyst microstructure in the as-prepared catalysts. The TEM images of monometallic Pt/GO and Co/GO show that separate Pt/GO and Co/GO NPs are homogeneously dispersed on GO with an average particle size of about 4.3 nm and 30.2 nm (Fig. S7, ESI†), respectively. The particle sizes of the Pt and Co NPs in this study are smaller. Histograms of the NPs were achieved by including at least 50 particles. The Pt and Co NPs size of the Pt/GO catalyst is about 4.3 nm, whereas the Co size of the Co/GO catalyst is distributed at about 30.2 nm. The mean particle size of Pt/GO is smaller than that of the Co/GO NPs.
Fig. 2 demonstrates the characteristic powder-XRD patterns of the as-obtained GO and rGO and the metal mixtures. All the peaks could be correlated with the face-centered cubic (fcc) structures. The first graphene oxide (GO) sample demonstrated a strong diffraction peak centered at 2θ = 13.01, corresponding to an interlayer spacing of about 0.76 nm, compared to the (001) reflection of graphene oxide, which is broader than that of pristine graphite. After surface doping, the metal-doped (Ni, Co, and Pt) GO revealed negligible C (001) peaks compared to GO. For the metal-doped materials after minor heat treatment, the GO peak widened and the rGO (2θ = 26.39) (022) peak plane with an interlayer spacing of about 0.34 nm was obtained, representing the reduction of graphene oxide to rGO. The GO peak broadens on exposure to high temperature. Furthermore, as observed from the XRD pattern in Fig. 2, the diffraction peaks at 2θ = 39.64°, 46.36°, and 67.55° could be indexed to the characteristic (111), (200), and (220) planes of the cubic crystalline structured Pt, respectively. The NiO and CoO (PDF#96-900-8619) peaks are very strong for Co support to that NiO, CoO is improved detached on the GO, and rGO support with smaller and fine particles demonstrating their high crystallinity. These observed results clearly confirm the formation of the Ni, Co, and Pt/GO NPs. Moreover, the wide peaks at 31.16°, 36.64°, and 59.14° were likewise observed for the three metal oxides, representing the formation of rGO and GO doped with metal NPs. Compared with the monometallic catalysts, the bimetallic catalysts were determined to undergo considerably more structural alteration and therefore, a greater number of active sites were created om them for the catalytic reactions.
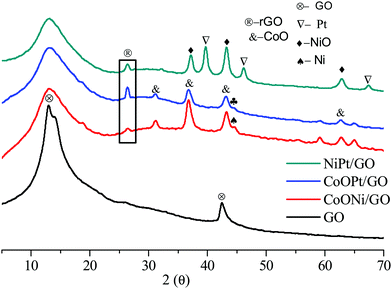 | ||
| Fig. 2 The typical XRD patterns of the as-prepared GO nanosheet (a), CoNi/GO and rGO, (b), CoOPt/GO and rGO (c), and NiPt/GO and rGO NPs. | ||
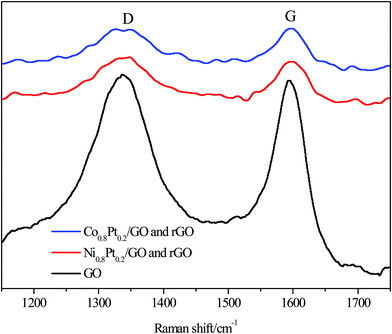
Raman spectroscopy was used to further distinguish the reduction of GO, with two prominent peaks at 1338.26 and 1594 cm−1 conforming to the D and G bands of the C atomic crystals, respectively. The peaks for the NiPt/GO and rGO, CoPt/GO and rGO catalysts were red-shifted to 1339.06, 1346.48 and 1598.74, 1596.86 cm−1 for the D and G bands, respectively, after 1 h reduction at 500 °C, as shown in Fig. 3. The D-peak represents the defects in the lattice of the C atom, while the G-peak in-plane stretching vibration represents the sp2 hybridization of the C atom. Furthermore, the D/G intensity ratio was significantly broadened after reduction, from 0.83 for GO to 0.84 and 0.84 for NiPt/GO and rGO, CoPt/GO and rGO after 1 h reduction, representing that large amounts of graphitic carbon were present in the samples, respectively. The red-shift of the G band and an increase in the D/G intensity ratio both indicate the increase in the sp2 carbon regions.
3.2 Catalytic hydrolysis of aqueous AB
To evaluate the catalytic efficiency of the catalysts, the hydrolysis of AB catalyzed by M/GO and rGO (M–Co, Ni, and Pt) was examined. The hydrogen generation curves are shown in Fig. 4. Ni0.8Pt0.2/GO and rGO, Co0.8Pt0.2/GO and rGO NPs completed the hydrolysis reaction within 0.5 and 0.6 min at 25 °C, respectively, and exhibited higher catalytic efficiency than monometallic Ni/GO, Co/Pt, and pure materials. To determine the optimal ratio of Pt/Co for Co0.8Pt0.2/GO and rGO NPs, a series of composite catalysts with constant Pt content were prepared. Their catalytic activities show a volcano-shaped change with increasing Pt/Co ratios, as shown in Fig. 4, and reach a peak value at a certain Pt/Co ratio. Further increasing the Co content ([Co]) led to a sharp decrease in the activity. GO and rGO without metal doping showed an improvement over the organized progressive nanostructure, while the contact between GO and rGO enhanced the dispersion of metal NPs. This energy is obtained due to the reduced amount of loaded Ni, Co, and Pt NPs, which were fundamental for the catalytic hydrolysis of AB. The presence of Ni0.8Pt0.2/GO and rGO, Co0.8Pt0.2/GO and rGO NPs assisted in the production of well-scattered and ultrafine metal NPs and increased the loading amount of the metal NPs. The activity was maintained as the amount of Pt metal increased to 0.3 wt% and 0.5 wt% but decreased when the added amount of Pt metal reached 5 wt%, which may be attributed to the thick Pt shell that prevents the diffusion and hydrolysis of AB molecules on the surface of the nanoparticles. Optimal catalytic activity can be realized on a catalytic surface with median binding energies of the reactive intermediates. If the reactant binds to the catalyst surface too weakly, then it cannot be activated. However, if it binds to the surface too strongly, it will occupy all the available surface sites and poison the catalyst. Thus, it is believed that there is an optimal Pt/Co ratio for achieving the highest catalytic activity for the hydrolysis of the AB complex. Monometallic Ni/GO, Co/GO, and Pt/GO NPs showed slightly less catalytic efficiency for AB hydrolysis due to their hierarchical nanostructure. These effects demonstrate that the arranged hierarchical nanostructure required an increase in the catalytic performance of the B–H bond. Other catalysts, including Ni/GO, did not display promising catalytic efficiencies. Subsequently, Ni0.8Pt0.2/GO and rGO, Co0.8Pt0.2/GO and rGO NPs performed as the main catalytic species in AB hydrolysis. The best catalyst was chosen considering the H2 selectivity and the amount of Ni, Co, and Pt NPs loaded. The optimized Ni0.8Pt0.2/GO and rGO, Co0.8Pt0.2/GO and rGO NPs exhibited the highest TOF value of 230.76 and 214.28 min−1 for AB hydrolysis, respectively, as shown in Fig. 5 and Table S2 (ESI†).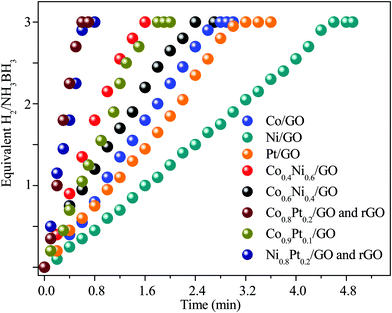 | ||
| Fig. 4 Hydrogen productivity vs. reaction time for hydrogen release from an aqueous AB solution (100 mM, 10 mL) catalyzed by M/GO and rGO (M–Co, Ni, and Pt) at 298 K (nNi/nAB = 0.04). | ||
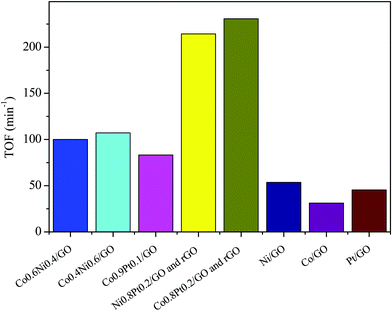 | ||
| Fig. 5 The corresponding TOF values for the dehydrogenation of ammonia borane solution (100 mM, 10 mL) catalyzed by M/GO and rGO (M–Co, Ni, and Pt) at 298 K (nNi/nAB = 0.04). | ||
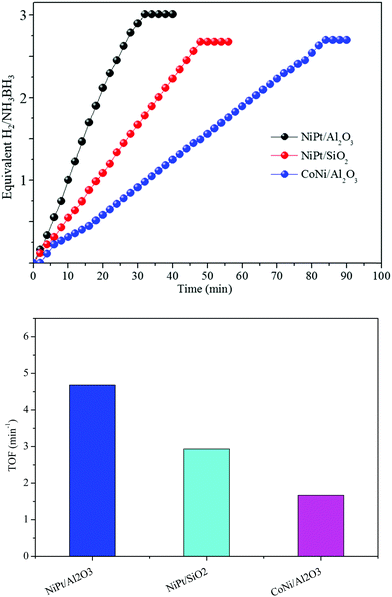
Various supports changed the structures, bringing about different catalytic performances. At that point, the absorbent inorganic catalysts, Al2O3 and SiO2, were utilized as supports for the synthesis of Ni and Co NP catalysts using a similar method to that for NiPt/GO and rGO. The TEM images show that the Ni and Co NPs in NiPt/Al2O3, CoNi/Al2O3, and NiPt/SiO2 likewise have a small size (Fig. S8, ESI†). However, they were greater than those of NiPt/GO and rGO. The synergistic catalysts in NiPt/Al2O3, CoNi/Al2O3, and NiPt/SiO2 showed lower reactant dehydrogenation than NiPt/GO and rGO (Fig. 6) but their catalytic performance was still higher than that of the other reported noble-metal free catalysts (Table S3, ESI†). These distinctive catalyst efficiencies may be due to various materials, among which the high specific surface area of the metal NPs and the solid adsorption of NH3BH3 into their pores led to the quick reactant dehydrogenation of AB. In addition, these consequences, including various types of supports, can be additionally attributed to the assumption of improved synergistic effect over amorphous metal NPs.
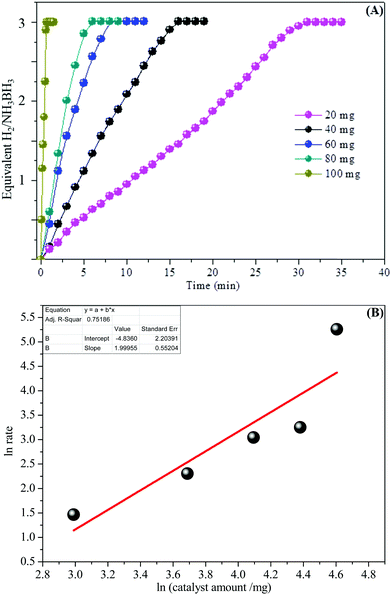
In addition, the detailed examination of the kinetic reaction for the aqueous AB hydrolysis reaction was undertaken by changing the number of catalysts with the similar amount of AB at room temperature (25 °C). Fig. 7A shows the influence of the amount of catalyst on the catalytic hydrogen generation reaction, where the amount of AB was kept at 2 mmol at 25 °C and the catalytic amounts were set at 20, 40, 60, 80, and 100 mg. We can see that the catalysts can effectively start the AB complex hydrolysis. The hydrogen generation efficiency was improved with increasing catalyst amount within the measured range. Fig. 7B demonstrates the plot of moles of hydrogen generated versus the catalyst amount on a logarithmic scale. The slope of 1.99 shows that the catalytic hydrolysis reaction of aqueous AB is first-order with respect to the catalyst amount and the observation is in acceptable understanding.
3.3 Kinetic study
Fig. 8 demonstrates the plots of time versus the moles of hydrogen generated at various temperatures. For a known temperature, hydrogen is created directly in a stoichiometric volume of six moles. For the temperature rise from 25 °C to 60 °C, hydrogen is generated rapidly, proposing quicker reaction kinetics. The reaction rate constant (k) is determined by the condition (eqn (2)) below, | (2) |
The activation energy is accordingly calculated from the Arrhenius equation (eqn (3)) between ln![[thin space (1/6-em)]](https://www.rsc.org/images/entities/char_2009.gif) k and 1/T as follows
k and 1/T as follows
 | (3) |
To demonstrate the temperature effect on aqueous AB hydrolytic dehydrogenation, the kinetics of Ni0.8Pt0.2/GO and rGO, Co0.8Pt0.2/GO and rGO catalyzed hydrogen generation were studied at different temperatures (25–60 °C). Fig. 8a and c shows the hydrolytic dehydrogenation amount of AB catalyzed by Ni0.8Pt0.2/GO and rGO, Co0.8Pt0.2/GO and rGO NPs. The reaction was carried out at increased temperature in the range of 25–60 °C. The rate of the reaction is significantly improved on increasing the temperature. As indicated by the Arrhenius plot in Fig. 8b and d, the achieved activation energy (Ea) of AB hydrolysis catalyzed by Ni0.8Pt0.2/GO and rGO, Co0.8Pt0.2/GO and rGO NPs is 23.94 kJ mol−1 and 23.60 kJ mol−1, respectively, which is lower than those of the recently reported noble-metal catalysts.31 As shown in Fig. S9 (ESI†), the hydrogen generation rate increases with increasing temperature. The catalytic reactions for hydrogen generation from aqueous AB solution were completed in 0.6, 0.5, 0.4, 0.3, 0.2 min (Ni0.8Pt0.2/GO and rGO), 0.62, 0.55, 0.42, 0.33, 0.21 min (Co0.8Pt0.2/GO and rGO), and 25, 30, 40, 50, 60 °C, whose corresponding TOF values are 214.0, 250.0, 333.3, 500.0 and 750.0 min−1 (Ni0.8Pt0.2/GO and rGO), and 176.4, 230.7, 300.0, 428.5, 681.8 min−1 (Co0.8Pt0.2/GO and rGO) (Fig. S9, ESI†).
Seeing the significance of the catalytic stability in practical application, the recyclability and stability of the Ni0.8Pt0.2/GO and rGO, Co0.8Pt0.2/GO and rGO NPs were studied at 25 °C by adding the same amount of the AB solution. When the first cycle was completed, as shown in Fig. 9, the hydrogen generation volume was unaltered after 10 cycles. The initial activity was maintained, showing its great recyclability. However, the hydrogen generation amount displayed a slight decrease. After the stability test, the Ni0.8Pt0.2/GO and rGO, Co0.8Pt0.2/GO and rGO NPs were then characterized by TEM. The TEM image of the used Ni0.8Pt0.2/GO and rGO, Co0.8Pt0.2/GO and rGO NP catalysts clearly showed that no great change could be recognized for the morphology of the reused catalysts. The CoPt and NiPt NPs in the GO support were still well-scattered without the presence of clusters. The effective catalytic performance and stability can be similarly obtained with smaller-sized CoPt and NiPt NPs. In addition, the pyrolytically-obtained GO layer could likewise help to assist the CoPt and NiPt NPs.
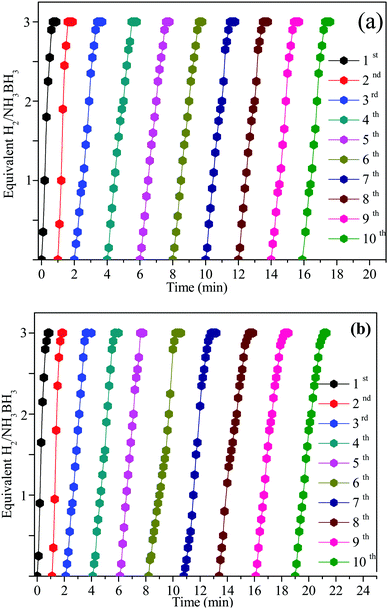 | ||
| Fig. 9 Reusability of the Ni0.8Pt0.2/GO and rGO, Co0.8Pt0.2/GO and rGO nanocatalysts for AB hydrolysis for 10 successive cycles at 25 °C. | ||
In further analysis, as shown in Fig. S10 (ESI†), the morphology of Ni0.8Pt0.2/GO and rGO, Co0.8Pt0.2/GO and rGO was well preserved. Although some mixing was detected, which might be the reason for the slight decrease in the activity during the durability test, the TEM images of the recovered catalyst show no significant variation in the particles (Fig. S10c, d, ESI†). Moreover, there is a small change in the particle size and agglomeration is observed, signifying that the structure of the Ni0.8Pt0.2/GO and rGO, Co0.8Pt0.2/GO and rGO NPs remains unchanged after usage. The Ni0.8Pt0.2/GO and rGO, Co0.8Pt0.2/GO and rGO catalysts demonstrate very high catalytic stability and durability towards AB hydrolytic dehydrogenation. In addition, Fig. S11 (ESI†) shows the X-ray diffraction (XRD) pattern of the reused catalyst for Ni0.8Pt0.2/GO and rGO NPs. Obviously, in addition to the GO (2θ = 13.26°) diffraction peak, only one broad diffraction peak at about 2θ = 43.0°, representing the disappearance of rGO, was observed. This indicates that the Ni0.8Pt0.2/GO and rGO NPs have a low crystalline structure, as shown in Fig. S11 (ESI†).
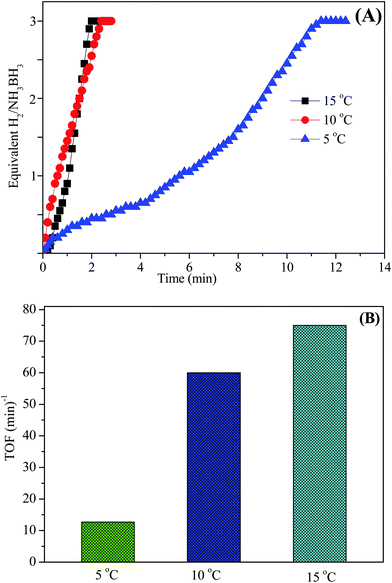
The aqueous AB solution catalytic efficiency was confirmed and studied at various temperatures in the range of 5–15 °C starting with Ni0.8Pt0.2/GO and rGO and 100 mM AB in 10 mL of H2O. As shown in Fig. 10A, the hydrogen generation rate steadily increased with increasing temperature and the TOF value reached the maximum at 15 °C. Thus, the Ni0.8Pt0.2/GO and rGO catalyst was chosen in all the further experiments.
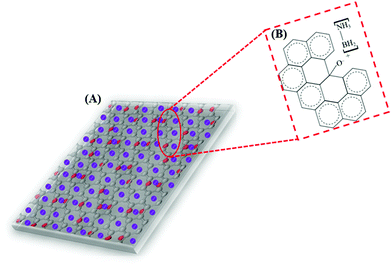
Based on the above presumptions and the consequences of the following investigations, a mechanism to explain the GO–AB cross-type nanostructure arrangement has been proposed, as shown in Fig. 11, which states that the GO nanosheets have their basal planes brightened with hydroxyl groups. These groups empower the proto analysis of the B–H bond in a portion of the AB molecules, which were present in the middle of the isolated GO sheets. This causes the development of the cationic AB connected to the oppositely charged oxygen through electrostatic interactions (Fig. 11B). On the other hand, the other AB atoms are not protonated and circulated inside the interlayer space, and the GO sheets are inclined to restack to make a sandwiched GO–AB–GO structure as the dissolvable material is evacuated. AB and its cationic initiator moved towards becoming encapsulated inside the GO interlayer.
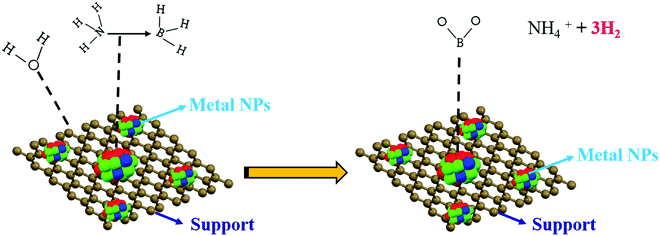
For the current metal-catalyzed reaction, the initiation procedure happens on the metal catalyst surface, as proposed by the zero-order kinetic reaction. A plausible mechanism is shown in Fig. 12. It proposes that there is an interface between the AB molecules and the metal particle surface that creates an initiated complex species in the rate-determining step, on which attack by a water molecule readily results in the deliberate separation of the B–N bond and hydrolysis at the center of BH3 to form the borate ion together with H2 (eqn (1)). According to literature, without water, dehydrocoupling between the AB molecule occurs, which produces new B–N bonds, probably by means of a thorough connection in between, on the metal surface.46–50
4. Conclusion
In summary, we have developed graphene oxide supported transition metals NiCo, NiPt, and CoPt NPs catalysts that were essentially prepared using hydrothermal reactions at 180 °C for 5 h in an oven under the ambient atmosphere. The enhanced bimetallic Ni0.8Pt0.2/GO and rGO, Co0.8Pt0.2/GO and rGO catalysts show incredible catalytic efficiency towards H2 generation from aqueous AB solution hydrolysis in association with their bimetallic supplements at 25 °C with a TOF value of 214.28 min−1 and 230.76 min−1, respectively, which are the highest values with respect to all of the GO and rGO-supported transition-metal catalysts ever studied for this reaction. The Ni–Pt and Co–Pt oxide maintenance can adsorb and break the B–H bonds in BH4− and weaken the H–O bonds in H2O via the hydrogen generation electron transmission effect. The highly efficient Co0.4Ni0.6/GO, Co0.9Pt0.1/GO, and Co0.6Ni0.4/GO catalysts likewise show great catalytic efficiency for hydrogen generation from aqueous AB solution at 25 °C. The catalysts also demonstrate the best recycling properties, with a conserved catalytic activity of about 98% after the seventh reaction cycle. This outstanding GO and rGO-supported transition metal heterogeneous catalyst activity demonstrates a promising methodology towards the improvement of AB as a plausible chemical hydrogen storage material for application in fuel cells. In addition, this technique can be effectively extended to the preparation of other graphene oxide-supported transition-metal modified methods for several other applications.Conflicts of interest
The authors declare no competing financial interest.References
- L. L. Long, X. Y. Liu, J. J. Chen, J. Jiang, C. Qian, G. X. Huang and H. Q. Yu, ACS Appl. Nano Mater., 2018, 1, 6800–6807 CrossRef CAS.
- P. Z. Li, A. Aijaz and Q. Xu, Angew. Chem., Int. Ed., 2012, 51, 6753–6756 CrossRef CAS PubMed.
- L. Wang, H. Li, W. Zhang, X. Zhao, J. Qiu, A. Li and J. Zeng, Angew. Chem., Int. Ed., 2017, 56, 4712–4718 CrossRef CAS PubMed.
- Z. Li, T. He, D. Matsumura, S. Miao, A. Wu, L. Liu and P. Chen, ACS Catal., 2017, 7, 6762–6769 CrossRef CAS.
- H. Cheng, X. Qian, Y. Kuwahara, K. Mori and H. Yamashita, Adv. Mater., 2015, 27, 4616–4621 CrossRef CAS PubMed.
- A. Aijaz, T. Akita, N. Tsumori and Q. Xu, J. Am. Chem. Soc., 2013, 135, 16356–16359 CrossRef CAS PubMed.
- M. Nielsen, E. Alberico, W. Baumann, H. J. Drexler, H. Junge, S. Gladiali and M. Beller, Nature, 2013, 495, 85–89 CrossRef CAS PubMed.
- Q. Yao, Z. H. Lu, W. Huang, X. Chen and J. Zhu, J. Mater. Chem. A, 2016, 4, 8579–8583 RSC.
- Q. Yao, Z. H. Lu, R. Zhang, S. Zhang, X. Chen and H. L. Jiang, J. Mater. Chem. A, 2018, 6, 4386–4393 RSC.
- P. Lara, K. Philippot and A. Suárez, ChemCatChem, 2019, 11, 766–771 CrossRef CAS.
- A. Uzundurukan and Y. Devrim, Int. J. Hydrogen Energy, 2019, 44, 26773–26782 CrossRef CAS.
- H. Zhang, D. Ke, L. Cheng, X. Feng, X. Hou, J. Wang and S. Han, Prog. Nat. Sci.: Mater. Int., 2019, 29, 1–9 CrossRef CAS.
- K. Mori, K. Miyawaki and H. Yamashita, ACS Catal., 2016, 6, 3128–3135 CrossRef CAS.
- H. Ren and P. Cui, Front. Mater., 2019, 6, 223 CrossRef.
- L. Luconi, U. B. Demirci, M. Peruzzini, G. Giambastiani and A. Rossin, Sustainable Energy Fuels, 2019, 3, 2583–2596 RSC.
- R. M. Brooks, I. M. Maafa, A. M. Al-Enizi, M. M. El-Halwany, M. Ubaidullah and A. Yousef, J. Nanomater., 2019, 9, 1082 CrossRef CAS PubMed.
- P. Xi, F. Chen, G. Xie, C. Ma, H. Liu, C. Shao and Z. Zeng, Nanoscale, 2012, 4, 5597–5601 RSC.
- L. Qian, D. Jia and Y. Miao, J. Electrochem. Soc., 2019, 166, F18–F23 CrossRef CAS.
- S. Oh, D. Song, H. Kim, D. Sohn, K. Hong, M. Lee and H. Kwon, J. Alloys Compd., 2019, 806, 643–649 CrossRef CAS.
- X. Yang, Q. Li, L. Li, J. Lin, X. Yang, C. Yu and C. Tang, J. Power Sources, 2019, 431, 135–143 CrossRef CAS.
- H. Göksu, Y. Yıldız, B. Çelik, M. Yazıcı, B. Kılbaş and F. Sen, ChemistrySelect, 2016, 1, 953–958 CrossRef.
- N. Z. Shang, C. Feng, S. T. Gao and C. Wang, Int. J. Hydrogen Energy, 2016, 41, 944–950 CrossRef CAS.
- H. Can and O. Metin, Int. J. Hydrogen Energy, 2019, 44, 25642–25651 CrossRef CAS.
- J. M. Yan, X. B. Zhang, S. Han, H. Shioyama and Q. Xu, Angew. Chem., Int. Ed., 2008, 47, 2287–2289 CrossRef CAS PubMed.
- C. C. Hou, Q. Li, C. J. Wang, C. Y. Peng, Q. Q. Chen, H. F. Ye and Y. Chen, Energy Environ. Sci., 2017, 10, 1770–1776 RSC.
- L. Hostert, E. G. Neiva, A. J. Zarbin and E. S. Orth, J. Mater. Chem. A, 2018, 6, 22226–22233 RSC.
- Z. L. Wang, J. M. Yan, H. L. Wang, Y. Ping and Q. Jiang, J. Mater. Chem. A, 2013, 1, 12721–12725 RSC.
- W. Wang, Z. H. Lu, Y. Luo, A. Zou, Q. Yao and X. Chen, ChemCatChem, 2018, 10, 1620–1626 CrossRef CAS.
- Y. H. Zhou, Z. Zhang, S. Wang, N. Williams, Y. Cheng, S. Luo and J. Gu, Int. J. Hydrogen Energy, 2018, 43, 18745–18753 CrossRef CAS.
- Y. Men, J. Su, X. Wang, P. Cai, G. Cheng and W. Luo, Chin. Chem. Lett., 2019, 30, 634–637 CrossRef CAS.
- Y. Men, J. Su, C. Huang, L. Liang, P. Cai, G. Cheng and W. Luo, Chin. Chem. Lett., 2018, 29, 1671–1674 CrossRef CAS.
- C. Wang, R. Ciganda, L. Yate, J. Tuninetti, V. Shalabaeva, L. Salmon and D. Astruc, J. Mater. Chem. A, 2017, 5, 21947–21954 RSC.
- D. Sun, V. Mazumder, O. Metin and S. Sun, ACS Nano, 2011, 5, 6458–6464 CrossRef CAS PubMed.
- D. Sun, V. Mazumder, O. Metin and S. Sun, ACS Catal., 2012, 2, 1290–1295 CrossRef CAS.
- L. Yang, W. Luo and G. Cheng, ACS Appl. Mater. Interfaces, 2013, 5, 8231–8240 CrossRef CAS PubMed.
- Q. Yao, Z. H. Lu, Y. Yang, Y. Chen, X. Chen and H. L. Jiang, Nano Res., 2018, 11, 4412–4422 CrossRef CAS.
- J. Wang, X. B. Zhang, Z. L. Wang, L. M. Wang and Y. Zhang, Energy Environ. Sci., 2012, 5, 6885–6888 RSC.
- X. Wang, D. Liu, S. Song and H. Zhang, J. Am. Chem. Soc., 2013, 135, 15864–15872 CrossRef CAS PubMed.
- X. Wang, D. Liu, J. Li, J. Zhen and H. Zhang, NPG Asia Mater., 2015, 7, 158 CrossRef.
- Y. Long, J. Li, L. Wu, Q. Wang, Y. Liu, X. Wang and H. Zhang, Nano Res., 2019, 12, 869–875 CrossRef CAS.
- G. Chen, S. Sun, X. Sun, W. Fan and T. You, Inorg. Chem., 2009, 48, 1334–1338 CrossRef CAS PubMed.
- F. Zhu, G. Chen, S. Sun and X. Sun, J. Mater. Chem. A, 2013, 1, 288–294 RSC.
- X. Du, C. Liu, C. Du, P. Cai, G. Cheng and W. Luo, Nano Res., 2017, 10, 2856–2865 CrossRef CAS.
- X. Zhou, X. F. Meng, J. M. Wang, N. Z. Shang, T. Feng, Z. Y. Gao and C. Wang, Int. J. Hydrogen Energy, 2019, 44, 4764–4770 CrossRef CAS.
- Q. Yao, K. Yang, X. Hong, X. Chen and Z. H. Lu, Catal. Sci. Technol., 2018, 8, 870–877 RSC.
- M. Mahyari and A. Shaabani, J. Mater. Chem. A, 2014, 2, 16652–16659 RSC.
- Q. Xu and M. Chandra, J. Power Sources, 2006, 163, 364–370 CrossRef CAS.
- C. A. Jaska, K. Temple, A. J. Lough and I. Manners, J. Am. Chem. Soc., 2003, 125, 9424–9434 CrossRef CAS PubMed.
- C. A. Jaska and I. Manners, J. Am. Chem. Soc., 2004, 126, 9776–9785 CrossRef CAS PubMed.
- Q. Zhuo, Y. Zhang, Q. Du and C. Yan, J. Colloid Interface Sci., 2015, 457, 243–247 CrossRef CAS PubMed.
Footnote |
| † Electronic supplementary information (ESI) available. See DOI: 10.1039/d0ma00441c |
| This journal is © The Royal Society of Chemistry 2020 |

