 Open Access Article
An in vitro study of the cytotoxicity of TTF·TCNQ nanoparticles to mammalian cells†
Hongjie
Chen‡
a,
Géraldine
Albérola‡
b,
Dominique
de Caro
a,
Christophe
Faulmann
a,
Muriel
Golzio
b,
Lydie
Valade
 *a and
Marie-Pierre
Rols
 *b
*b
aLCC-CNRS, Université de Toulouse, CNRS, UPS, Toulouse, France. E-mail: lydie.valade@lcc-toulouse.fr
bInstitut de Pharmacologie et de Biologie Structurale, Université de Toulouse, CNRS, Université Paul Sabatier, 31400 Toulouse, France. E-mail: Marie-Pierre.Rols@ipbs.fr
First published on 31st July 2020
Abstract
Molecular conductors such as tetrathiafulvalene–tetracyanoquinodimethane (TTF·TCNQ) are of interest for applications in biomedical devices. In this context, toxicity data should be available. Although separate TTF and TCNQ toxicity studies were reported, that of TTF·TCNQ had not been investigated, mainly because of its low solubility in biological media. Recently, the preparation of TTF·TCNQ in the presence of octylamine (OA), acting as a growth controller, afforded soluble nanoparticles (NPs). These particles can further host a biologically active species, for example, trans-decenoic acid (TRANS). In order to study the integration of TTF·TCNQ-based NPs into biomedical devices, we prepared and studied the cytotoxicity of TTF·TCNQ-OA and TTF·TCNQ-OA@TRANS NPs because (i) the chemical nature of TTF and TCNQ is different in separate compounds (neutral molecules) and the adduct (charged molecules), and (ii) nanomaterials may show cell toxicity. The collected data provide evidence that TTF·TCNQ-OA and TTF·TCNQ-OA@TRANS NPs do not induce cell death in normal cells, human dermal fibroblasts, and cancer cells, HCT-116, for concentrations up to 50 μg mL−1, but do induce an arrest in cell division at a concentration of 100 μg mL−1. These data are encouraging for the use of these TTF·TCNQ-based NPs in biomedical devices.
Introduction
The first isolated organic metal,1 TTF·TCNQ (Fig. 1), tetrathiafulvalene·tetracyanoquinodimethane, is a typical one-dimensional material: its structure consists of independent stacks of TTF and TCNQ moieties and its conductive properties arise from partial charge transfer between the TTF and TCNQ molecules, leading to the TTF0.59+TCNQ0.59− adduct. The material grows as needles. Its conductivity at room temperature (σRT = 600 S cm−1) is the highest along the needle axis which corresponds to the molecular stacking direction.1TTF·TCNQ was prepared and studied in numerous forms such as single crystals,1 crystalline powders,2 thin films,3,4 molecular wires,5,6 and, more recently, nanoparticles (NPs) through the addition of a growth controller to the reaction medium.7,8
TTF·TCNQ NPs were isolated by using (i) stearic or octanoic acid, (ii) butyl-, octyl- or hexadecyl-amine, (iii) 1-butyl-3-methylimidazolium salts9 ([BMIM]X with X = BF4− or [N(CF3SO2)2]−) or (iv) poly(vinylpyrrolidone).10 Note that stable colloidal solutions (10 g L−1 in tetrahydrofuran, THF) of TTF·TCNQ NPs were obtained using n-octylamine (OA) as a growth controller.7
TTF·TCNQ has been studied for gas sensing applications,11,12 reticulate doping,13 as electrodes in OFETs14,15 and as a mediator for biosensors.16 It exhibits an electrochemical stability domain2 suitable for biosensing various chemical species (glucose, choline, lactate, dopamine, etc.). In such applications, TTF·TCNQ is part of the electrode composition and is incorporated using various methods.11,17–26 For example, biosensors containing TTF·TCNQ and acetylcholine esterase enzyme were fabricated for the detection of therapeutic drugs.27,28 The performance of the TTF·TCNQ biosensors is sensitive to the morphology of the material. As a monolayer, the salt exhibits enhanced electrocatalytic properties vs. bulk powder imbedded in, e.g., carbon paste. These enhanced properties are explained by more efficient contacts with the active centres of the enzymes supported on the TTF·TCNQ surface. Therefore, the preparation of TTF·TCNQ supported on carbon nanotubes was suggested to build nanosensors offering large active areas.
Another route for increasing the surface-over-volume ratio in solid materials consists of preparing NPs. This is possible for TTF·TCNQ7,8 and could be beneficial for applications in biosensors. To our knowledge, TTF·TCNQ NPs have only been evaluated for electronic applications: as electrodes in OFETs9 and as charge materials in composites for electromagnetic shielding.29
In the context of biosensor applications, TTF and TCNQ have been reported separately as being soluble in biological media and to have low toxicity,30 but the toxicity of the TTF·TCNQ adduct has not been investigated either as bulk or as NPs. Nanomaterials based on metals, metal chalcogenides or carbon are of high health concern today31 because they have entered medical application domains32 including nanomedicine where they have sometimes shown cell toxicity.33–35 Therefore, as the safety of using biomedical devices is essential, the cytotoxicity of the TTF·TCNQ adduct needs to be studied, particularly in the form of NPs. Due to their size, they can easily be internalized by cells via endocytic pathways.36 This internalization also raises concerns over their potential cytotoxicity and unknown biological activities.
We report here a study of the cytotoxicity of TTF·TCNQ NPs stabilized by octylamine (TTF·TCNQ-OA) and further covered by a bioactive chemical, as a first step to evaluate their potential use as a supporting media in biomedical devices. We selected trans-2-decenoic acid (TRANS) which is isolated from royal jelly and has been reported to show weak oestrogenic activity.37 The TRANS molecule is characterized by a hydrophobic long alkyl chain ended by a polar carboxylic COOH function and including a C=C double bond located in ∝ of the COOH group: these features are in favour of a well-organized structure of TRANS molecules as a second shell around TTF·TCNQ-OA NPs.
Numerous commercial cell viability assays exploit different cellular processes to quantify cytotoxicity, each highlighting the variability that can be obtained from different methodologies.38–40 Unlike endpoint approaches, real-time assay systems allow for the tracking of cellular growth over the entire time course of an experiment. This is particularly effective for assessing the impact of cytostatic compounds, where subtle growth inhibitory effects are easily noticeable but may be missed while using endpoint-based methods. In the present work, we performed real-time assays, using equipment capable of capturing images at regular intervals, quantifying cellular surface area coverage as a measure of proliferation, and allowing the visualization of drug-induced cell morphology changes.41
Results and discussion
We have selected TTF·TCNQ-OA NPs for conducting the study of the cytotoxicity of TTF·TCNQ-OA NPs because they can afford stable solutions. We further prepared TTF·TCNQ-OA NPs covered by TRANS in order to evaluate their potential use as the support media for biologically active species.37Synthesis and solubility of the NPs
TTF·TCNQ-OA NPs were prepared as reported previously.7 They were isolated as well-dispersed spherical NPs with a mean diameter of 40 nm (Fig. 2a). UV-vis, IR and Raman spectroscopy results are in agreement with the formation of the TTF·TCNQ-OA species (ESI†).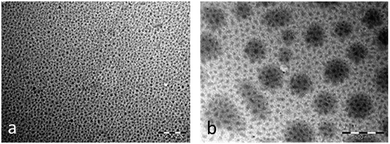 | ||
| Fig. 2 TEM images of (a) TTF·TCNQ-OA NPs (from ref. 7) and (b) TTF·TCNQ-OA@TRANS NPs (this work); scale bars = 500 nm. | ||
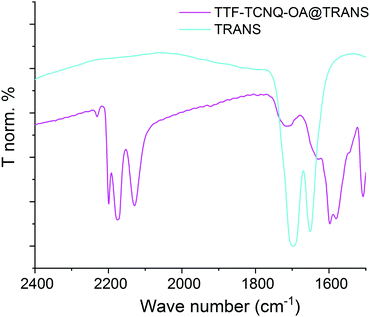
The TTF·TCNQ-OA@TRANS sample was prepared by adding TRANS to a THF solution of TTF·TCNQ-OA NPs. A majority of smaller NPs (∼25 nm, Fig. 2b) are observed after the addition of TRANS. The surface erosion and reorganization of the nano-objects due to the combined presence of OA and TRANS in an ethanolic solution could explain the smaller particle sizes observed by TEM. The TRANS molecules are bound to the surfaces of TTF·TCNQ-OA NPs via hydrogen bonds between the NH2 groups of OA and the OH groups of TRANS. These hydrogen bonds have little influence on the carbonyl stretching frequency of TRANS. As a matter of fact, TTF·TCNQ-OA@TRANS exhibits a νCO infrared band at 1710 cm−1, a value that is very close to that of free TRANS (1700 cm−1) (Fig. 3). The Raman spectrum is identical to that of TTF·TCNQ-OA because the highly polar CO group of TRANS has low polarizability and is not conjugated with the C![[double bond, length as m-dash]](https://www.rsc.org/images/entities/char_e001.gif) C groups of TTF and TCNQ surface molecules, explaining why no additional bands are observed. The UV-vis spectrum is identical to that of TTF·TCNQ-OA: it is not affected by the TRANS molecules constituting the protecting organic shell because bands are only due to the charge transfer between TTF and TCNQ and to the intramolecular transitions in TCNQ.
C groups of TTF and TCNQ surface molecules, explaining why no additional bands are observed. The UV-vis spectrum is identical to that of TTF·TCNQ-OA: it is not affected by the TRANS molecules constituting the protecting organic shell because bands are only due to the charge transfer between TTF and TCNQ and to the intramolecular transitions in TCNQ.
In order to perform cytotoxicity experiments, NPs must be soluble in a solvent compatible with biological media. TTF·TCNQ-OA and TTF·TCNQ-OA@TRANS are not soluble in diethyl ether and lead to unstable dispersions in water, but they form stable solutions in ethanol. A concentration of 2.5 g L−1 is obtained in ethanol at room temperature (Table 1). The integrity and size of TTF·TCNQ-OA and TTF·TCNQ-OA@TRANS NPs are maintained within the ethanol solution (Fig. 4).
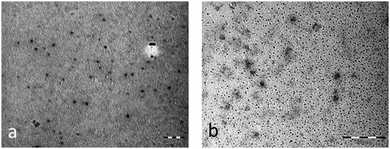 | ||
| Fig. 4 TEM images of (a) TTF·TCNQ-OA NPs and (b) TTF·TCNQ-OA@TRANS NPs from the 2.5 g L−1 solutions in ethanol; scale bars = 200 nm. | ||
For toxicity experiments, a 2.5 g L−1 solution is added to the culture medium containing fibroblasts or HCT-116 cancer cells.
Ethanol cytotoxicity
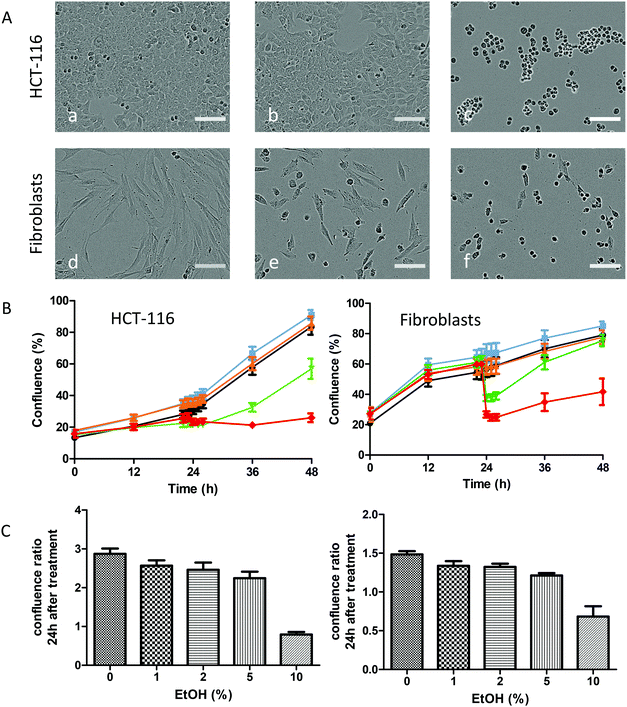
With the solubility of TTF·TCNQ-OA of TTF·TCNQ-OA@TRANS being obtained using ethanol, we first had to study the effect of ethanol alone on cell viability, before studying the toxicity of the NPs solubilized in ethanol. Results obtained by adding successive quantities of ethanol, from 1 to 10%, show that both HCT-116 and fibroblast cells are not significantly affected by ethanol doses of up to 5% (Fig. 5).Moreover, as shown in Fig. 5A, the morphology of cells and their density did not change in the presence of EtOH up to 5% but were dramatically affected at 10%, a concentration where cells are no longer elongated but adopt a spherical shape. However, the fact that the cells are still present and attached to the Petri dishes reveals that even the affected cells are still viable.
We next quantified the percentage of confluence as a function of time, a value directly linked to the density of cells. As shown in Fig. 5B, the percentage of confluence of control cells increased with time, which is the signature of cell growth. The addition of EtOH at 24 hours induced a rapid drop in confluency for EtOH concentrations above 5%, which can be explained by the rapid but reversible change in the shape of the cells. This drop is more visible for fibroblasts than for HCT-116 cells, which can be explained by the difference in their initial shapes. At 48 hours, i.e. 24 hours of incubation with EtOH, these values were still dramatically affected by 10% EtOH that correlates well with the phase contrast micrographs. For HCT-116 cells, this percentage decreased to 40% for fibroblasts and 70% for HCT-116 cells as shown in Fig. 5C.
Therefore, experiments on the cytotoxicity of NPs were conducted by diluting the NPs in a volume containing 5% ethanol, a concentration that permits a maximum NP concentration of 0.1 mg mL−1.
Cytotoxicity of NPs
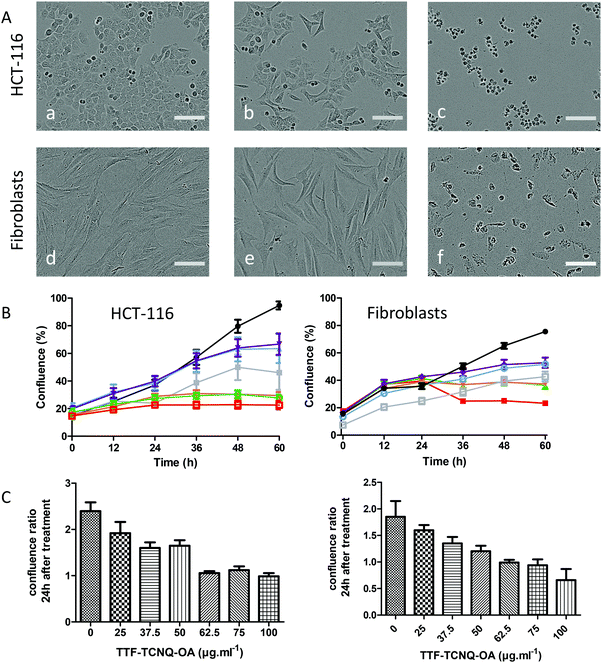
It was previously reported that neutral TTF and TCNQ species show low toxicity towards cells30 (LD50 TCNQ = 1225 mg kg−1 and LD50 TTF = 750 mg mL−1, oral administration in mice). However, this work does not report on the toxicity of the TTF·TCNQ adduct, probably because of the lack of solubility of the bulk material. Indeed, bulk TTF·TCNQ, which prevented this toxicity study, does not contain neutral species but partially charged TTF0.59+ and TCNQ0.59− species at the origin of its conductive properties. As soluble NPs could be isolated, we have studied their cytotoxicity in order to determine if the TTF·TCNQ adduct may be considered as a potential support material for therapeutic applications. The study was performed with both TTF·TCNQ-OA and TTF·TCNQ-OA@TRANS NPs.Our first objective was to characterize the cytotoxicity of TTF·TCNQ-OA in vitro toward cancerous and normal cells. As above, two cell cultures, HCT-116 and human dermal fibroblasts, were incubated in the presence of increasing concentrations of TTF·TCNQ-OA (0.0012–0.1 mg mL−1) for an average of 72 (±12) hours, and cell growth was monitored by real time in vitro micro-imaging using the IncuCyte System (Sartorius, Germany). The IncuCyte System allows for the hourly monitoring of cell growth by determining the confluence of the cells and displaying the morphological changes associated with treatment.
As shown in Fig. 6A, the morphology of cells and their density did not significantly change in the presence of up to 50 μg mL−1 TTF·TCNQ-OA but was dramatically affected at 100 μg mL−1, a concentration where cells are no longer elongated but adopt a spherical shape. As shown in Fig. 6B, the percentage of confluence of cells increased with time but in a TTF·TCNQ-OA concentration-dependent way. The addition of TTF·TCNQ-OA induced a decrease in confluency for concentrations above 25 μg mL−1 that can be explained by the change in the shape of the cells. For concentrations between 37.5 and 62.5 μg mL−1, the percentage of confluence increased for HCT-116 cells but less than that for the control one. At 75 and 100 μg mL−1, confluence was affected since this percentage did not increase at all. These observations correlate well with the phase contrast micrographs. The same observations can be done for the fibroblasts. As shown in Fig. 6, the cell viability of HCT-116 was affected highly significantly in the presence of 50 μg mL−1 of TTF·TCNQ-OA, whereas the fibroblast cell viability appears to be highly affected from a TTF·TCNQ-OA concentration of 75 μg mL−1, a difference that may be explained by the alteration of the shape probably due to the change in the metabolism of the cells and in their generation time.
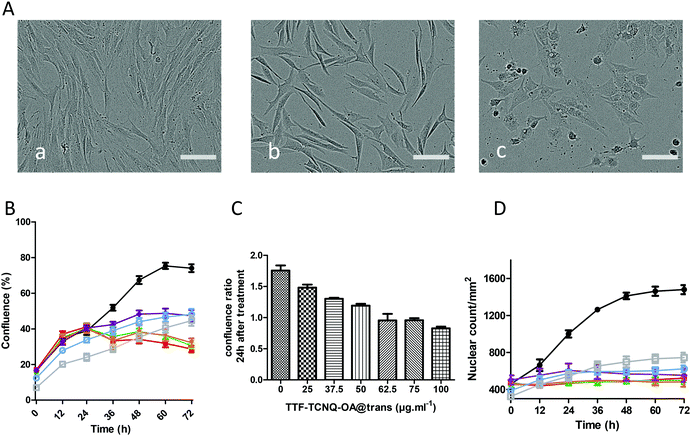
In order to evaluate the influence of TRANS supported on the NPs, the cytotoxicity of TTF·TCNQ-OA@TRANS was studied on fibroblasts, which remain viable at a higher concentration of TTF·TCNQ-OA compared to HCT-116 cells. In addition, fibroblasts have been chosen for this experiment since further development of the use of TTF·TCNQ-OA will be performed on normal cells and not on cancerous ones. The fibroblast cell viability was affected highly significantly from a concentration of 62.5 μg mL−1 of TTF·TCNQ-OA@TRANS as shown in Fig. 7. Therefore, the cell viability is similar in the presence or absence of the fatty acid. On the other hand, from a concentration of 50 μg mL−1, a morphological change of the cells was observed: dermal fibroblasts appeared to differentiate into myofibroblasts (Fig. 7A(b)).
To overcome the morphological change in our cell viability analyses, we then labelled the nuclei of fibroblast living cells with NucLight Red (EssenBio) and analysed the nuclear count per mm2 as a function of time for different concentrations of TTF·TCNQ-OA@TRANS (Fig. 7D). The IncuCyte® NucLight Rapid Red Reagent for cell labeling is a cell permeable DNA stain that specifically stains nuclei in live cells and is ideally suited to the mix-and-read, real-time quantification of cell counting. The addition of the IncuCyte NucLight Rapid Red Reagent to normal healthy cells is non-perturbing to cell growth and morphology and provides homogenous staining of nuclei. When added to the tissue culture medium, the inert stain crosses the cell membrane and has excellent specificity for DNA without the need for a wash step. Results show that the TTF·TCNQ-OA@TRANS NPs affected the cell shape and confluence but the number of nuclei, meaning the number of cells, remained stable 72 hours post-treatment.
Experimental
Preparation of TTF·TCNQ-OA NPs
Typically, 1 mmol (204 mg) of TTF, 1 mmol (204 mg) of TCNQ, and 1 mmol (160 μL) of n-octylamine are added at room temperature to 120 mL of tetrahydrofuran and the solution is stirred for one hour. The nanoparticle powder is obtained after the evaporation of the THF solvent, washing with pentane, and finally drying under vacuum for 2 hours at 30 °C. The isolated powder is soluble in various solvents: acetone, ethanol, and THF. IR (cm−1): νNH 3208; νCN 2199, 2169, 2133.Preparation of TTF·TCNQ-OA@TRANS NPs
Typically, 0.1 mmol (50 mg) of TTF·TCNQ-OA and 0.5 mmol (85 μL) of trans-2-decenoic acid are added at room temperature to 5 mL of tetrahydrofuran (THF) and the solution is stirred for 30 min. The nanoparticle powder is obtained after the evaporation of THF, washing with pentane and finally drying under vacuum for 2 hours at 55 °C. IR (cm−1): νNH 3197; νCN 2199, 2177, 2128; νCO 1710.Solubility tests
The solubility of TTF·TCNQ-OA and TTF·TCNQ-OA@TRANS was studied by adding successive quantities of ethanol to 1 mg of the NP powder. The total dissolution of NPs is obtained after adding 0.4 mL of ethanol. The corresponding concentration of the solutions is 2.5 g L−1.Cell culture
The human colorectal carcinoma cell line HCT-116 was purchased from ATCC (# CCL-247). Dermis native tissue and human cells of primary human dermal fibroblasts isolated from the foreskin of a 3-year-old child were purchased from Icelltis (Toulouse, France) as previously described.42Briefly, after overnight incubation in Dispase II enzyme (10 mg mL−1, Gibco-Invitrogen, Carlsbad, USA), the epidermis was carefully peeled off, and part of the fresh native dermis was used for the enzymatic isolation of fibroblasts with collagenase type 1 (1 mg mL−1, Abnova, Taipei, Taiwan). 5 days after primary fibroblast isolation and expansion, cells at precocious passage 1, from the same batch, were used to seed and produce monolayer cells.
HCT-116 and primary human dermal fibroblasts were grown in Dulbecco's modified Eagle's medium (Invitrogen), supplemented with 10% heat-inactivated fetal calf serum, 100 U mL−1 penicillin and 100 μg mL−1 streptomycin. The cells were maintained at 37 °C in a humidified atmosphere containing 5% CO2.
Cell viability
HCT-116 and primary human dermal fibroblast cells were seeded at, respectively, 2 × 10⁴ cells and 8 × 10³ cells per well into a 96-well plate, in 200 μL complete growth medium at 37 °C, 5% CO2 incubation. After overnight incubation, the cells were treated with different concentrations of NPs dissolved in 5% EtOH or 5% EtOH alone for controls, and the plate was inserted into the IncuCyte Zoom for real-time imaging, with one image per well under 10× magnification every 1 h for an average of 72 (±12) hours. Data were analysed using the IncuCyte Confluence version 1.5 software, which quantified the cell surface area coverage as confluence values. All IncuCyte experiments were performed in triplicate and each condition was performed 6 times (in the same plate).Toxicity assay
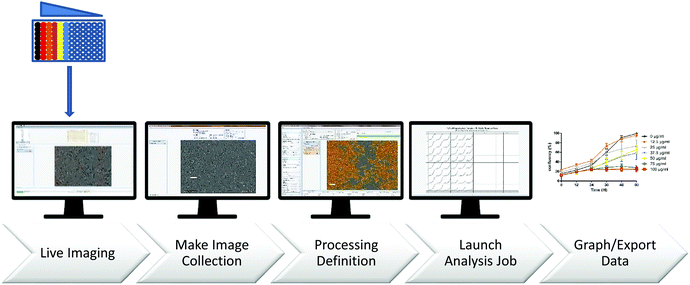
The cytotoxicity of TTF·TCNQ-OA and TTF·TCNQ-OA@TRANS NPs was evaluated on cell monolayers 24 h after seeding. Different concentrations were tested, ranging from 0 to 0.1 mg mL−1 in DMEM complemented with 10% FBS. The two cell cultures HCT-116 and human dermal fibroblasts were incubated in the presence of increasing concentrations of TTF·TCNQ-OA (0.0012–0.1 mg mL−1) for an average of 72 (±12) hours, and cell growth was monitored by “real time in vitro micro-imaging” using the IncuCyte System (Sartorius, USA, Fig. 8). The IncuCyte System allows for the hourly monitoring of cell growth by determining the confluence of the cells and displaying the morphological changes associated with treatment. The tests are performed on 96-well microplates, in the presence of increasing doses of the TTF·TCNQ-OA@TRANS product on the different cell types. The fluorescent dye NucLight was used as needed. Live imaging represents the images captured over time from the cells as a function of processing and is used to compile collections of training images. The analysis parameters have been optimized to allow the analysis of each treatment condition.Phase contrast and fluorescence images were obtained using the IncuCyte Zoom time interval microscopy system. The established processing definitions during the training phase were used for real-time image processing, followed by statistical analysis.
Statistical analysis
We used unpaired Student t-test analysis to determine statistical differences (with a p value < 0.05 considered significant) in the confluence ratio between different concentrations of EtOH or TTF·TCNQ-OA/TTF·TCNQ-OA@TRANS. The analysis was performed with Prism 5 software (GraphPad Software, San Diego, CA, USA).Conclusions
The integration of molecular conductors into biomedical devices depends on their stability and safety towards biological media. The cytotoxicity of the organic conductor TTF·TCNQ could be studied, thanks to its availability in the form of NPs which can be solubilized unlike the bulk material, without the change of their chemical nature. All of the collected data reported in this work give evidence that TTF·TCNQ-OA and TTF·TCNQ-OA@TRANS NPs do not induce cell death in normal cells, human dermal fibroblasts, and cancer cells, HCT-116, for concentrations up to 50 μg mL−1, but induced an arrest in cell division at 100 μg mL−1. These data show promise for their use in biomedical devices.Conflicts of interest
There are no conflicts to declare.Acknowledgements
H. Chen thanks CNRS-LCC for financial support, and K. Jacob and A. de Caro for their punctual help during this work. This research was partly funded through the NUMEP Plan Cancer PC201615 grant.Notes and references
- D. E. Schafer, F. Wudl, G. A. Thomas, J. P. Ferraris, D. O. Cowan and A. Bloch, Bull. Am. Phys. Soc., 1974, 19, 222 Search PubMed.
- C. D. Jaeger and A. J. Bard, J. Am. Chem. Soc., 1979, 101, 1690–1699 CrossRef CAS.
- J. Fraxedas, S. Molas, A. Figueras, I. Jimenez, R. Gago, P. Auban-Senzier and M. Goffman, J. Solid State Chem., 2002, 168, 384–389 CrossRef CAS.
- S. Caillieux, D. de Caro, L. Valade, M. Basso-Bert, C. Faulmann, I. Malfant, H. Casellas, L. Ouahab, J. Fraxedas and A. Zwick, J. Mater. Chem., 2003, 13, 2931–2936 RSC.
- M. Sakai, M. Iizuka, M. Nakamura and K. Kudo, J. Appl. Phys., 2005, 97, 053509 CrossRef.
- D. De Caro, J. Sakah, M. Basso-Bert, C. Faulmann, J. P. Legros, T. Ondarçuhu, C. Joachim, L. Ariès, L. Valade and P. Cassoux, C. R. Acad. Sci., Ser. IIc: Chim., 2000, 3, 675–680 CrossRef CAS.
- D. de Caro, M. Souque, C. Faulmann, Y. Coppel, L. Valade, J. Fraxedas, O. Vendier and F. Courtade, Langmuir, 2013, 29, 8983–8988 CrossRef CAS.
- D. de Caro, L. Valade, C. Faulmann, K. Jacob, D. Van Dorsselaer, I. Chtioui, L. Salmon, A. Sabbar, S. El Hajjaji, E. Perez, S. Franceschi and J. Fraxedas, New J. Chem., 2013, 37, 3331–3336 RSC.
- D. de Caro, K. Jacob, H. Hahioui, C. Faulmann, L. Valade, T. Kadoya, T. Mori, J. Fraxedas and L. Viau, New J. Chem., 2011, 35, 1315–1319 RSC.
- T. Kadoya, D. de Caro, K. Jacob, C. Faulmann, L. Valade and T. Mori, J. Mater. Chem., 2011, 21, 18421–18424 RSC.
- J.-Y. Liao and K.-C. Ho, Sens. Actuators, B, 2008, 130, 343–350 CrossRef CAS.
- K.-C. Ho and J.-Y. Liao, Sens. Actuators, B, 2003, 93, 370–378 CrossRef CAS.
- J. Jeszka, Pol. J. Chem., 2002, 76, 201–218 CAS.
- T. Mori, in Molecular Materials: Preparation, Characterization, and Applications, ed. S. Malhotra, B. L. V. Prasad and J. Fraxedas, CRC, 2017, ch. 10, pp. 241–270 Search PubMed.
- S. Georgakopoulos, A. Pérez-Rodríguez, A. Campos, I. Temiño, S. Galindo, E. Barrena, C. Ocal and M. Mas-Torrent, Org. Electron., 2017, 48, 365–370 CrossRef CAS.
- R. Pauliukaite, A. Malinauskas, G. Zhylyak and U. E. Spichiger-Keller, Electroanalysis, 2007, 19, 2491–2498 CrossRef CAS.
- P. Calvo-Marzal, K. Y. Chumbimuni-Torres, N. F. Höehr, G. de Oliveira Neto and L. T. Kubota, Sens. Actuators, B, 2004, 100, 333–340 CrossRef CAS.
- U. Korell and U. E. Spichiger, Anal. Chem., 1994, 66, 510–515 CrossRef CAS PubMed.
- S. A. M. Marzouk, V. V. Cosofret, R. P. Buck, H. Yang, W. E. Cascio and S. S. M. Hassan, Anal. Chem., 1997, 69, 2646–2652 CrossRef CAS PubMed.
- E. S. Forzani, G. A. Rivas and V. M. Solís, J. Electroanal. Chem., 1999, 461, 174–183 CrossRef CAS.
- R. Kataky, M. R. Bryce, L. Goldenberg, S. Hayes and A. Nowak, Talanta, 2002, 56, 451–458 CrossRef CAS.
- G. F. Khan, Sens. Actuators, B, 1996, 36, 484–490 CrossRef CAS.
- P. C. Pandey, S. Upadhyay and S. Sharma, Electroanalysis, 2003, 15, 1115–1119 CrossRef CAS.
- F. Palmisano, P. G. Zambonin, D. Centonze and M. Quinto, Anal. Chem., 2002, 74, 5913–5918 CrossRef CAS PubMed.
- Q.-S. Li, B.-C. Ye, B.-X. Liu and J.-J. Zhong, Biosens. Bioelectron., 1999, 14, 327–334 CrossRef CAS PubMed.
- M. Cano, J. Luis Ávila, M. Mayén, M. L. Mena, J. Pingarrón and R. Rodríguez-Amaro, J. Electroanal. Chem., 2008, 615, 69–74 CrossRef CAS.
- L.-G. Zamfir, L. Rotariu and C. Bala, Biosens. Bioelectron., 2013, 46, 61–67 CrossRef CAS PubMed.
- K. Yavir, Ł. Marcinkowski, R. Marcinkowska, J. Namieśnik and A. Kloskowski, Anal. Chim. Acta, 2019, 1054, 1–16 CrossRef CAS PubMed.
- M. Souque, O. Vendier, L. Valade, D. de Caro, J.-M. Desmarres and F. Courtade, France Pat., FR2957460, 2013 Search PubMed.
- J. Kulys, V. Simkeviciene and I. J. Higgins, Biosens. Bioelectron., 1992, 7, 495–501 CrossRef CAS PubMed.
- M. A. Zoroddu, S. Medici, A. Ledda, V. M. Nurchi, J. I. Lachowicz and M. Peana, Curr. Med. Chem., 2014, 21, 3837–3853 CrossRef CAS PubMed.
- X. Chen and J.-H. Ahn, J. Mater. Chem. B, 2020, 8, 1082–1092 RSC.
- M. D. Mauricio, S. Guerra-Ojeda, P. Marchio, S. L. Valles, M. Aldasoro, I. Escribano-Lopez, J. R. Herance, M. Rocha, J. M. Vila and V. M. Victor, Oxid. Med. Cell. Longevity, 2018, 2018, 20 Search PubMed.
- P. Dubey, I. Matai, S. U. Kumar, A. Sachdev, B. Bhushan and P. Gopinath, Adv. Colloid Interface Sci., 2015, 221, 4–21 CrossRef CAS PubMed.
- H. Bahadar, F. Maqbool, K. Niaz and M. Abdollahi, Iran. Biomed. J., 2016, 20, 1–11 Search PubMed.
- P. Gehr, M. J. D. Clift, C. Brandenberger, A. Lehmann, F. Herzog and B. Rothen-Rutishauser, Compr. Physiol., 2011, 1, 1159–1174 Search PubMed.
- K.-M. Suzuki, Y. Isohama, H. Maruyama, Y. Yamada, Y. Narita, S. Ohta, Y. Araki, T. Miyata and S. Mishima, Evid. Based Complement Alternat. Med., 2008, 5, 295–302 CrossRef PubMed.
- G. K. Y. Chan, T. L. Kleinheinz, D. Peterson and J. G. Moffat, PLoS One, 2013, 8, e63583 CrossRef CAS PubMed.
- O. Kepp, L. Galluzzi, M. Lipinski, J. Yuan and G. Kroemer, Nat. Rev. Drug Discovery, 2011, 10, 221–237 CrossRef CAS PubMed.
- V. M. C. Quent, D. Loessner, T. Friis, J. C. Reichert and D. W. Hutmacher, J. Cell. Mol. Med., 2010, 14, 1003–1013 CrossRef CAS PubMed.
- A. Single, H. Beetham, B. J. Telford, P. Guilford and A. Chen, J. Biomol. Screening, 2015, 20, 1286–1293 CrossRef CAS PubMed.
- L. Gibot, T. Galbraith, J. Huot and F. A. Auger, Tissue Eng., Part A, 2010, 16, 3199–3206 CrossRef CAS PubMed.
Footnotes |
| † Electronic supplementary information (ESI) available: IR, Raman and UV-vis spectra of TTF⋅TCNQ-OA. See DOI: 10.1039/d0ma00129e |
| ‡ These authors contributed equally to this work. |
| This journal is © The Royal Society of Chemistry 2020 |


