 Open Access Article
Synthesis of non-toxic inorganic blue pigments in the melilite-type structure†
Georg
Gramm
a,
Gerda
Fuhrmann
a,
Kevin
Ploner
b,
Simon
Penner
 b and
Hubert
Huppertz
 *a
*a
aInstitute of General, Inorganic, and Theoretical Chemistry, University of Innsbruck, Innrain 80-82, 6020 Innsbruck, Austria. E-mail: Hubert.Huppertz@uibk.ac.at
bInstitute of Physical Chemistry, University of Innsbruck, Innrain 52c, 6020 Innsbruck, Austria
First published on 7th September 2020
Abstract
A series of novel melilite-type structured compounds of the general formula Sr2Mg1−xMnxGe2−ySiyO7+δ (0 ≤ x ≤ 1; 0 ≤ y ≤ 2) was produced by conventional solid-state syntheses and subsequently characterized by X-ray powder diffraction (XRPD) and Rietveld analysis. All prepared compounds crystallize in the tetragonal space group P![[4 with combining macron]](https://www.rsc.org/images/entities/char_0034_0304.gif) 21m with the unit cell dimensions varying dependent on the elements contained in the structure. The diffuse reflectance spectra of the obtained powders were recorded, and the color properties were determined by means of the CIE 1976 L*a*b* color coordinates. With the aim of developing new, non-toxic inorganic blue materials that might be of interest for industrial applications, the expensive element Ge was substituted with Si, while the Mg to Mn ratio was simultaneously varied for color optimization. XPS measurements provided evidence that the blue color displayed by some of the candidates in the melilite-type structure is attributable to the presence of the manganese in a mixed oxidation state of 2+/3+. Finally, the highest blue color value was achieved for Sr2Mg0.2Mn0.8Si2O7+δ with b* = −31.3, a remarkable value for an environmentally safe inorganic blue pigment.
21m with the unit cell dimensions varying dependent on the elements contained in the structure. The diffuse reflectance spectra of the obtained powders were recorded, and the color properties were determined by means of the CIE 1976 L*a*b* color coordinates. With the aim of developing new, non-toxic inorganic blue materials that might be of interest for industrial applications, the expensive element Ge was substituted with Si, while the Mg to Mn ratio was simultaneously varied for color optimization. XPS measurements provided evidence that the blue color displayed by some of the candidates in the melilite-type structure is attributable to the presence of the manganese in a mixed oxidation state of 2+/3+. Finally, the highest blue color value was achieved for Sr2Mg0.2Mn0.8Si2O7+δ with b* = −31.3, a remarkable value for an environmentally safe inorganic blue pigment.
1. Introduction
While various ions like Cu2+, Fe2+/3+, Co2+, Mn3+/5+/6+, Ni2+, V4+, and S3− are known to function as blue chromophores, currently, the most used inorganic blue pigments are based on cobalt compounds, such as cerulean blue (CoO·nSnO2), cobalt silicate blue (Co2SiO4), or “Cobalt blue” (CoAl2O4).1–5 These materials exhibit exceptional properties providing intense hues in combination with a high stability against heat and chemicals. For these reasons, they can be used in both indoor and outdoor applications without a loss of color quality over time. However, the big drawback accounted in the widespread application of these materials is the dependence on the rare, expensive, and toxic element Co. Thus, the demand for alternatives is constantly rising and safer materials are keenly wanted.4The discovery of YIn1−xMnxO3 caused a lot of stir in the field of pigment research, as the material contains exclusively non-toxic elements, is chemically stable, and shows brilliant blue colors.3,6 Unfortunately, one major component in the blend is the expensive element In, which drives the production costs so high that the pigment cannot be produced on an industrial scale in a financially feasible way.
Furthermore, the purple and blue compounds YGa1−xMnxO3,7 Ca6Ba(P1−xMnx)4O171 and Sr2Mg1−xMnxGe2O7+δ2 have been recently published. Their likewise attractive coloristic appearances also arise from the introduction of Mn3+ or Mn5+ as chromophores in different host structures. For Sr2Mg1−xMnxGe2O7+δ (0 ≤ x ≤ 1), Kim et al. reported structural changes that were achieved by substituting Mg with Mn leading to blue color shades of the samples.2 The incorporation of the Mn cation in a mixed oxidation state of 2+ and 3+ afforded the formation of a MnO5 trigonal bipyramid and a GeO5 square pyramid with an additional oxygen anion in an interstitial site, which is different to the undoped SrMgGe2O7 melilite-type structure, that is built up by MgO4 and GeO4 tetrahedra.2 However, while these substances show promising color properties, they also share some of the afore-mentioned problems with respect to high production costs, owing to the major amount of the expensive element Ge in the material.
Following up these works and with the aim to develop inorganic pigments with improved characteristics also from an economical point of view, we systematically investigated the substitution of Ge with various elements that are cheaper and environmentally friendly. Included in our studies were various melilite-type compounds, which are already known for example as dielectric materials or as phosphors from other application areas.8–15 Particular attention was given on the substitution with Si, as the corresponding Si-phases Sr2MgSi2O7 and Sr2MnSi2O7 crystallize in isotypic structures, due to the fact that the ionic radius of Si4+ is similar to that of Ge4+ (Si4+ = 0.40 Å, Ge4+ = 0.53 Å).16
In the present paper, we disclose the successful preparation of new inorganic blue pigments in the melilite-type structure. To optimize the color properties and the manufacturing costs of the new materials, the variation of the Ge to Si and Mg to Mn ratios in the system Sr2Mg1−xMnxGe2−ySiyO7+δ was systematically investigated. The obtained samples were thoroughly analyzed by XRPD-, XPS-, particle size measurements, and UV-VIS spectroscopy.
2. Experimental section
2.1 Materials and syntheses
As starting materials MnCO3 (99.9%) and SrCO3 (99%) from Alfa Aesar, SiO2 nanopowder (99.5%) from Sigma-Aldrich, GeO2 (99.999%) from ChemPur, and MgO (97%) from Merck were used as received.Products of the general formula Sr2Mg1−xMnxGe2−ySiyO7+δ (0 ≤ x ≤ 1; 0 ≤ y ≤ 2) were produced by high-temperature solid-state reactions under ambient atmosphere. For this, stoichiometric mixtures of the educts were homogenized in an agate mortar, transferred in a corundum crucible, and heated in a chamber furnace to 1250 °C with a heating rate of 250 °C per hour. The temperature was kept for 10 hours before the furnace was switched off.
2.2 Characterization
The X-ray powder diffraction (XRPD) patterns were collected in transmission geometry using a Stadi P powder diffractometer (STOE, Germany), with Mo-Kα1 (λ = 70.93 pm) radiation, focused by a Ge(111) primary beam monochromator over a 2Θ range from 2° to 40° with increments of 0.015°. As detector a Mythen 1K silicon microstrip solid-state detector was used and the phases were identified with the aid of the ICDD PDF-2 database. Rietveld structure refinements were performed with the software suite TOPAS 4.2, using a LaB6 standard to adjust the hardware parameters and the reflection shapes.The diffuse reflectance spectra of the samples were collected with an Agilent Cary 5000 UV-VIS spectrometer equipped with a DRA2500 integrating sphere in the range from 360 to 830 nm. The reflectance spectra were used to specify the hues of the products in terms of the CIE 1976 L*a*b* color coordinates, by using the Cary WinUV Color Software (Version 4.20 (468)). Barium sulfate was used as a reference substance and as setup for the measurements a D65 standard illuminate, a data interval of 1 nm, a scan rate of 600 nm min−1, and a 10° complementary observer were chosen. The coordinates in the Cartesian coordination system of the CIE L*a*b* color space are labeled as L*, standing for the lightness, a* representing the red (+) to green (−) axis, and b* representing the yellow (+) to blue (−) axis.
A Mastersizer 2000 (MALVERN INSTRUMENTS, United Kingdom) equipped with a He–Ne laser (λ = 633 nm, 18 mm beam diameter) was used to quantify the particle sizes of the powdered compounds. The particle sizes were calculated from the obtained signals on basis of Mie scattering theory and the data processing was conducted with the MALVERN MASTERSIZER 2000 5.12G software package. Before the measurements, the samples were dispersed in ethanol and homogenized by ultra-sonication to minimize particle agglomeration. The resulting values d0.1, d0.5, and d0.9 represent the diameters, where 10, 50, or 90% of all particles are smaller than the obtained mean value, respectively.
X-ray photoelectron spectroscopy (XPS) was performed using a Thermo Scientific MultiLab 2000 spectrometer. The base pressure was in the low 10−10 mbar region and the instrument utilizes monochromated Al-Kα radiation for the generation of the photoelectrons, which are analyzed according to their kinetic energy by a hemispherical sector analyzer. The charging of the sample is compensated with a flood gun, which applies electrons with a kinetic energy of 6 eV to the sample. The quantification of the oxidation states of Mn was accomplished by fitting the Mn 2p3/2 peaks with the deconvolutions of MnO, Mn2O3, and MnO2 reference samples according to Biesinger et al.17 For this procedure, a Shirley function describing the background was employed and the fixed component parameters (relative peak area and position, FWHM) of each oxidation state were convoluted to one complex peak per Mn species. These complex peaks were then fitted to the experimental data of the Mn 2p3/2 peak, yielding the relative amounts of the oxidation states of Mn.
3. Results and discussion
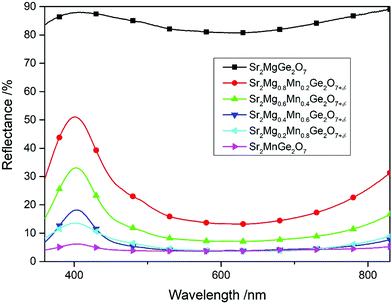
At first, a series of compounds with the general formula Sr2Mg1−xMnxGe2O7+δ (x = 0.0, 0.2, 0.4, 0.6, 0.8, 1.0) has been synthesized and characterized. The materials, first found by Kim et al., were reproduced to serve as reference materials for our newly synthesized products.2 As already described, the colors of the compounds crystallizing in the melilite-type structure vary in dependence on the substitution rate of Mg with Mn. The replacement of Mg with Mn, corresponding to 0 < x ≤ 0.4, caused a change of color from white for Sr2MgGe2O7 to samples providing various blue shades. Higher Mn proportions (x > 0.4) led to dark blue materials, while the complete substitution of Mg with Mn resulted in a black powder. The recorded UV-VIS spectra of the samples (Fig. 1) support this observation. While the white Sr2MgGe2O7 shows an almost flat reflectance curve at high reflectance values, the Mn-substituted pigments exhibit a peak in the wavelength region around 400 nm, which gradually lowers. The samples with a major share of Mn (x > 0.5) display therefore again flat curves but at low reflectance values without distinctive peaks, corresponding to their black color. The respective CIE L*a*b* values of the products, which are listed in Table S1 of the ESI,† mirror these observations and the sample Sr2Mg0.8Mn0.2Ge2O7+δ, which shows the most pronounced reflectance peak, reveals the best blue b* value of −26.2.In addition to the replacement of Mg with Mn, the substitution of Ge with Si in Sr2Mg1−xMnxGe2−ySiyO7+δ (0 ≤ x ≤ 1; 0 ≤ y ≤ 2) was attempted in the next step and the effects on the products were investigated. Both compounds Sr2MgSi2O7 and Sr2MnSi2O7 crystallize in a melilite-type structure, isotypic to the afore-mentioned Ge-based pigments. Accordingly, samples in the full miscibility range of Sr2Mg1−xMnxGe2−ySiyO7+δ (0 ≤ x ≤ 1; 0 ≤ y ≤ 2) could be prepared. The phase purity of the pigments was controlled and occurring side phases were identified via XRD measurements. Accordingly, all samples crystallize in the melilite-type structure, but the purity was depending on the Mg to Mn ratio. For instance, the samples prepared with a major share of Mg (x < 0.5) always show a certain amount of side phase, whose type is dependent on the Ge to Si ratio. Compounds with a major amount of Ge, like Sr2MgGe2O7, were obtained with SrGeO3 as a side phase, while the Si-rich samples, like Sr2MgSi2O7, contained SrSiO3 and Sr2SiO4 as a side phase. However, the samples with a major Mn share, corresponding to x > 0.50 in Sr2Mg1−xMnxGe2−ySiyO7+δ (0 ≤ y ≤ 2), present greatly enhanced phase purities and the targeted phases could be synthesized without the occurrence of side phases.
Attempts to substitute Ge4+ with other cations than Si4+ in the same oxidation state and with similar ionic radii (Ge4+ = 0.53 Å) were unsuccessful. The syntheses with Ti4+ (0.56 Å), Sn4+ (0.69 Å), and Zr4+ (0.73 Å) according to the formula Sr2Mg0.6Mn0.4Ge1.5M0.5O7 (M = Ti, Sn, Zr) resulted in grey mixtures of Sr2MgGe2O7 and the respective side phases SrTiO3, SrSnO3, or SrZrO3.
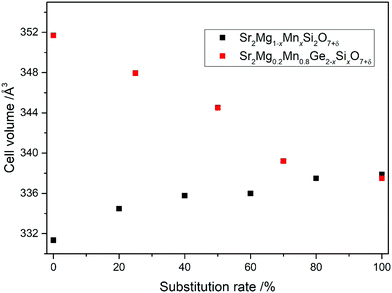
The structural changes caused by the substitution of Ge with Si and Mg with Mn were then investigated in detail by Rietveld analysis. The crystallographic data of the calculations are collected in Table S2 and the corresponding Rietveld plots are depicted in Fig. S1 and S2 (ESI†). In Fig. 2, the alteration of the cell volumes in accordance with the respective substitution rate is visualized. As can be seen, the Si4+ incorporation causes a gradual and rather large decrease of the cell volumes, from 351.73 Å3 for Sr2Mg0.2Mn0.8Ge2O7+δ to 337.49 Å3 for Sr2Mg0.2Mn0.8Si2O7+δ, corresponding to the smaller ionic radius of the Si4+ cation (Si4+ = 0.40 Å; Ge4+ = 0.53 Å). On the other hand, the substitution of Mg2+ (0.71 Å) with Mn2+ (0.80 Å) is accompanied by only small changes in the cell dimensions, with an increase from 331.33 Å3 for Sr2MgSi2O7 to 337.88 Å3 for Sr2MnSi2O7. This indicates that some of the Mn ions in the structure could also occur as Mn3+, as the ionic radius of Mn3+ is more similar to Mg2+ (Mg2+ = 71 Å (coordination number CN = 4); Mn3+ = 72 Å (CN = 5)). Furthermore, these structural changes are also observable in the average interatomic distances, which are listed in Tables 1 and 2. As the amount of Mn in Sr2Mg1−xMnxSi2O7+δ (x = 0.0, 0.2, 0.4, 0.6, 0.8, 1.0) is raised, the average interatomic distances between Mg/Mn and O become larger, from 1.94 Å in Sr2MgSi2O7 to 2.08 Å in Sr2MnSi2O7. The substitution of Ge with Si in Sr2Mg0.2Mn0.8Ge2−xSixO7+δ (x = 0.0, 0.5, 1.0, 1.5, 2.0) is accompanied by a decrease of the interatomic distances between Ge/Si and O from 1.73 Å in Sr2Mg0.2Mn0.8Ge2O7+δ to 1.58 Å in Sr2Mg0.2Mn0.8Si2O7+δ. The average Sr–O distances, on the other hand, are always ranging from 2.66 to 2.69 Å.
| x = 0.0 | x = 0.2 | x = 0.4 | x = 0.6 | x = 0.8 | x = 1.0 | |
|---|---|---|---|---|---|---|
| ∅ Sr–O (Å) | 2.6803 | 2.6854 | 2.6905 | 2.6794 | 2.6927 | 2.6845 |
| ∅ Mg/Mn–O (Å) | 1.9409 | 1.9126 | 1.9480 | 2.0356 | 2.0304 | 2.0886 |
| ∅ Si–O (Å) | 1.6000 | 1.6394 | 1.6107 | 1.5919 | 1.5833 | 1.5736 |
| x = 0.0 | x = 0.5 | x = 1.0 | x = 1.5 | x = 2.0 | |
|---|---|---|---|---|---|
| ∅ Sr–O (Å) | 2.6697 | 2.6615 | 2.6522 | 2.6870 | 2.6927 |
| ∅ Mg/Mn–O (Å) | 1.9951 | 1.9803 | 1.9920 | 2.0453 | 2.0305 |
| ∅ Ge/Si–O (Å) | 1.7354 | 1.7329 | 1.7162 | 1.5911 | 1.5833 |
Subsequently, all synthesized products have been characterized by UV-VIS spectroscopy and their coloristic appearances have been determined (Table S1, ESI†). In the series Sr2Mg1−xMnxGe2−ySiyO7+δ, samples with a Ge to Si ratio according to 0 < y < 1.5 display similar colors as the pure Ge pigments for the whole substitution range of Mg with Mn. The compounds Sr2MgGe2−ySiyO7 (0 < y < 1.5) are colourless powders, while the marginal replacement of Mg with Mn, forming blends of the formula Sr2Mg1−xMnxGe2−ySiyO7+δ (0 < x < 0.4; 0 < y < 1.5), led again to blue shaded pigments and at high Mn shares (x > 0.5) to dark blue and black colored samples. The best blue colors were again found at low Mn ratios (0.2 ≤ x ≤ 0.4). For example, the compound Sr2Mg0.6Mn0.4GeSiO7+δ still reaches a b* value of −25.1, even though half of the Ge4+ atoms are substituted with Si4+.
Clearly brighter colors were achieved when the Si ratio was further increased according to y > 1.5 in Sr2Mg1−xMnxGe2−ySiyO7+δ. Consequently, the samples containing a major share of Mg (x < 0.5) show light blue shades with worse chromatic values. However, the substances containing a higher Mn amount (x > 0.6), display improved blue colors, superior to the known Ge-pigments, with the best values usually at a Mn proportion of x = 0.8.
The effect, provided by the substitution of Ge with Si, becomes evident by comparing the UV-VIS spectra of samples in which the Mg to Mn ratio is kept constant. Exemplary, Fig. 3, displays the reflectance spectra of the compounds Sr2Mg0.8Mn0.2Ge2−ySiyO7+δ (y = 0.0, 0.5, 1.0, 1.5, 2.0) with Mn shares of 20 at%. As can be seen, the Ge-rich phases display distinctive peaks in the purple wavelength region reaching the above-mentioned best b* values of −26.2 for Sr2Mg0.8Mn0.2Ge2O7+δ. On the other hand, the bright Si-rich compounds display higher curvatures with smaller peaks in the purple/blue wavelength region. Accordingly, their b* values are slightly lower, with values of −21.0 for Sr2Mg0.8Mn0.2Ge0.2Si1.8O7+δ or −25.5 for Sr2Mg0.8Mn0.2Si2O7+δ.
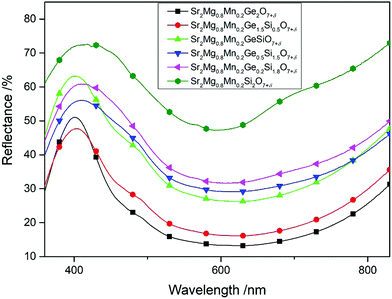 | ||
| Fig. 3 UV-VIS spectra of Mg-rich samples, with varying Ge/Si ratios, of the general formula Sr2Mg0.8Mn0.2Ge2−xSixO7+δ (x = 0.0, 0.5, 1.0, 1.5, 1.8, and 2.0). | ||
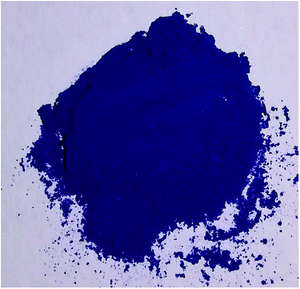
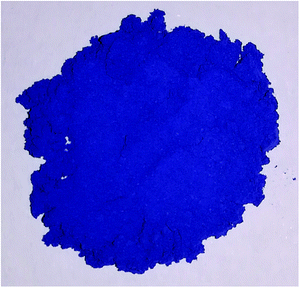
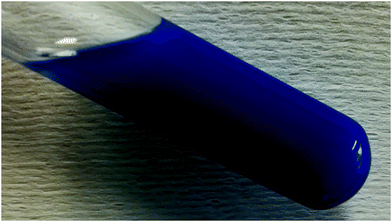
However, increasing the Mn amount to 80 at% affords materials of the formula Sr2Mg0.2Mn0.8Ge2−ySiyO7+δ (y = 0.0, 0.5, 1.0, 1.5, 2.0) that have a much lower reflectance and a narrower reflectance peak in their UV-VIS spectra (Fig. 4). The Ge-rich phases (y ≤ 1) generally reflect less light, hence, they appear dark in color, which is portrayed by their poor blue values, i.e. Sr2Mg0.2Mn0.8Ge2O7+δ with b* = −16.7. On the other hand, the Si-rich compounds display higher reflectance curves with marked peaks, which are additionally redshifted from 400 nm into the blue wavelength regions of 430 nm (Fig. 4). As a result, the color values of these samples, like Sr2Mg0.2Mn0.8Si2O7+δ or Sr2Mg0.2Mn0.8Ge0.2Si1.8O7+δ, are superior, reaching blue b* values of −31.0. Photographs of these two pigments are illustrated in Fig. 5 and 6.
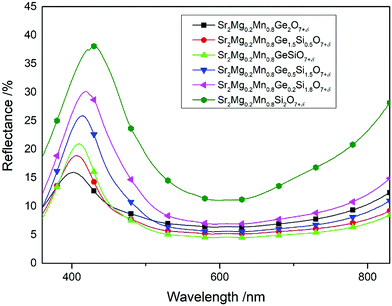 | ||
| Fig. 4 UV-VIS spectra of Mn-rich samples, with varying Ge/Si ratios, of the general formula Sr2Mg0.2Mn0.8Ge2−xSixO7+δ (x = 0.0, 0.5, 1.0, 1.5, 1.8, and 2.0). | ||
The optical and coloristic properties of the newly developed Si-based pigments Sr2Mg0.2Mn0.8Ge0.2Si1.8O7+δ and Sr2Mg0.2Mn0.8Si2O7+δ have then been compared to the commercially available blue pigment CoAl2O4 (“Cobalt blue”, PB28) and the previously reported pigment Sr2Mg0.8Mn0.2Ge2O7+δ. The UV-Vis spectra of the four compounds are shown in Fig. 7 and the corresponding CIE L*a*b* color coordinates are listed for comparison in Table 3. Clearly visible is the redshift of the reflectance peak provided by the Si-rich compounds (Sr2Mg0.2Mn0.8Ge0.2Si1.8O7+δ and Sr2Mg0.2Mn0.8Si2O7+δ) compared to the isotypic compound Sr2Mg0.8Mn0.2Ge2O7+δ. Further, the peak of the Si-pure material Sr2Mg0.2Mn0.8Si2O7+δ is higher than that of Sr2Mg0.2Mn0.8Ge0.2Si1.8O7+δ, reaching a similar reflectance value as the commercial “Cobalt blue” pigment. These findings are reflected in the CIE L*a*b* color coordinates that show for Sr2Mg0.2Mn0.8Si2O7+δ the best b* value of −31.3, in combination with a high lightness value of L* = 45.1, and for Sr2Mg0.2Mn0.8Ge0.2Si1.8O7+δ a slightly minor b* value with −31.2 with a lower lightness L* value of 35.7. In comparison, the Ge-rich compound Sr2Mg0.8Mn0.2Ge2O7+δ displays an equally high lightness value as the pure silicon compound, but an inferior b* value of −26.2.
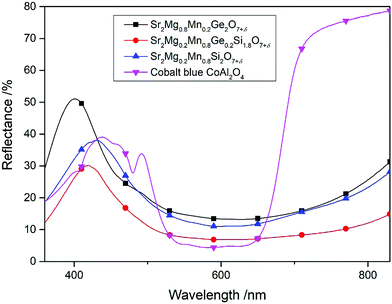 | ||
| Fig. 7 UV-VIS spectra of Sr2Mg0.8Mn0.2Ge2O7+δ, Sr2Mg0.2Mn0.8Ge0.2Si1.8O7+δ, Sr2Mg0.2Mn0.8Si2O7+δ, and “Cobalt blue, PB28”. | ||
| Sample | L* | a* | b* |
|---|---|---|---|
| Sr2Mg0.8Mn0.2Ge2O7+δ | 47.1 | 6.9 | −26.2 |
| Sr2Mg0.2Mn0.8Ge0.2Si1.8O7+δ | 35.7 | 10.9 | −31.2 |
| Sr2Mg0.2Mn0.8Si2O7+δ | 45.1 | 7.3 | −31.3 |
| Cobalt blue PB 28 (CoAl2O4) | 39.4 | 3.8 | −46.0 |
Conclusively, although the color performance of the blue cobalt pigment displaying a blue b* value of −46.0 could not be reached, the newly developed Si-rich pigments clearly outperform the isotypic Ge compounds and they are most likely to serve as alternatives not only on account of their enhanced color properties, but also because of their cheaper components.
Normally, the color of pigments is affected by the size of the particles, which they comprise. Pigments consisting of larger sized particles show more intense colors, while those of smaller particles are brighter. In order to confirm that the color changes were due to the substitution of Ge with Si and not related to particle size effects, the particle dimensions of the two isotypic compounds Sr2Mg0.2Mn0.8Si2O7+δ and Sr2Mg0.8Mn0.2Ge2O7+δ were compared. The samples were dispersed in ethanol (Fig. 9) and the resulting values d0.1, d0.5, and d0.9, which represent the diameters, where 10, 50, or 90% of all particles are smaller than the obtained mean value, are collected in Table 4.
| Sample | d 0.1/μm | d 0.5/μm | d 0.9/μm |
|---|---|---|---|
| Sr2Mg0.8Mn0.2Ge2O7+δ | 4.47 | 12.58 | 35.97 |
| Sr2Mg0.2Mn0.8Si2O7+δ | 2.17 | 6.89 | 25.61 |
Generally, both materials consist of rather small particles in the range from 5 to 30 μm. Sr2Mg0.2Mn0.8Si2O7+δ, however, shows a narrower particle size distribution for all d values than the reference material Sr2Mg0.8Mn0.2Ge2O7+δ, which implies that the improved blue hues originate from the changed composition and not from particle size effects.
To better understand the role of Mn in the color formation of the newly developed Sr2Mg1−xMnxGe2−ySiyO7+δ compounds, the oxidation states of the Mn cations in Sr2Mg0.2Mn0.8Ge0.5Si1.5O7+δ and Sr2Mg0.6Mn0.4Si2O7+δ were additionally investigated with the help of XPS measurements. Herein, the oxidation state of the Mn was determined via the Mn 2p3/2 peak, as the 3s region of Mn could not be used due to the overlapping Mg 2s peak. The Mn 2p3/2 peaks were fitted using the deconvolutions of MnO, Mn2O3, and MnO2 reference samples according to Biesinger et al.17 By fitting these deconvolutions of each oxidation state with their specific peak area ratios, FWHM values and relative binding energy shifts to the experimental data employing a Shirley function for the background, the relative amount of the oxidation states could be evaluated and are given in Table 5. The fitted spectra are illustrated in Fig. 8.
| Sample | Relative amount of species/at% | ||
|---|---|---|---|
| Mn2+ | Mn3+ | Mn4+ | |
| Sr2Mg0.6Mn0.4Si2O7+δ | 40 | 57 | 3 |
| Sr2Mg0.2Mn0.8Ge0.5Si1.5O7+δ | 45 | 52 | 3 |
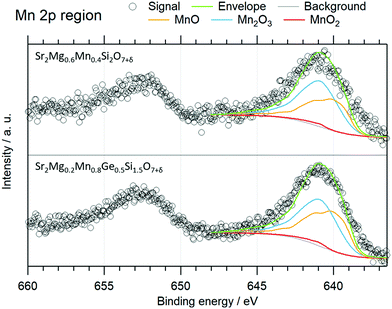 | ||
| Fig. 8 XP spectra of the 2p region of Mn with the 2p3/2 peak fitted with the components of MnO, Mn2O3, and MnO2. | ||
The Mn4+ traces suggested by the fits are not significant due to the low signal-to-noise ratio as the quantification error of XPS measurements lies in this percentage range. Thus, the Mn cation occurs in a mixed oxidation state of 2+ and 3+, with the two species in similar relative amounts. This not only offers an explanation for the minor changes of the cell dimensions after the substitution of Mg with Mn, as Mn3+ has almost the same ionic radius (Mn3+ = 0.72 Å (CN = 5), Mg2+ = 0.71 (CN = 4), Mn2+ = 0.80 Å (CN = 4)), but also confirms that the colors of the Si-containing compounds arise from the same mechanism as proposed for Sr2Mg1−xMnxGe2O7+δ by Kim et al.2 Therefore, the blue coloring of the samples can be attributed to the presence of Mn3+, as the Mn2+ ion does not act as such a strong chromophore. On the other hand, Mn3+ in trigonal bipyramidal coordination is well known as a blue chromophore, with absorption bands arising from symmetry-allowed Mn 3dx2−y2,xy to Mn 3dz2 transitions.2,6,18 The excessive positive charge is compensated by interstitial oxygen atoms and small deviations in the structure, as already reported for various melilite-type structures.2 However, the modification of the structure is so minimal, that no changes are detectable in the XRD patterns and as an exact measurement of the oxygen concentration was not possible the factor δ was used in the formulas to indicate this discrepancy.
Finally, the stability and possible applications of the new Si-based blue pigment holding the best color properties, namely Sr2Mg0.2Mn0.8Si2O7+δ, were evaluated. The material provides an exceptionally high heat stability as the blue color of the pigment is maintained even after heating at 1250 °C for 12 hours. Furthermore, the pigment is stable in aqueous alkaline conditions for a limited time period, as soaking the pigment for an hour in a NaOH solution with pH = 13 does not result in any color change. After 24 hours in this milieu, the colors faded. In acidic aqueous conditions the pigment is less stable and in an HCl solution with pH = 3, the color immediately starts to fade, while the pigment dissolves at lower pH-values. Long term chemical stability is therefore only given at neutral pH-conditions.
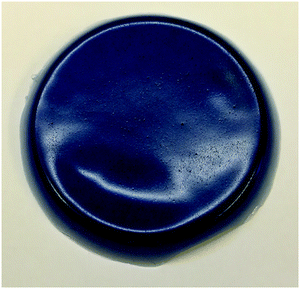
The use of the pigment for coloring plastic has been investigated by means of incorporating the pigment into a PVC matrix. For this purpose, 45 mg of the pigment were mixed with 495 mg PVC, 15 ml THF (tetrahydrofuran), and 990 mg DOS (dioctyl sebacate). The mixture was stirred at a temperature of 80 °C for an hour and then poured into a glass bowl to let the solvent evaporate. The resulting material is depicted in Fig. 10.
4. Conclusion
In this work, a series of new blue pigments with the formula Sr2Mg1−xMnxGe2−ySiyO7+δ (0 ≤ x ≤ 1; 0 ≤ y ≤ 2) has been synthesized and characterized. The substitution of Ge with the cheaper element Si, and of Mg with Mn for color improvements has been systematically investigated. All prepared samples have been characterized by XRD analysis and their crystallization in the melilite-type structure has been confirmed. The cell dimensions were determined by Rietveld analysis and the presence of the manganese ion in a mixed oxidation state of 2+ and 3+ was confirmed by XPS measurements. The samples with the general formula Sr2Mg1−xMnxGe2−ySiyO7+δ (x = 0.8; y ≥ 1.8), comprising high Mn- and Si-shares, were found as the most promising materials, and especially the compound Sr2Mg0.2Mn0.8Si2O7+δ, providing a b* value of −31.4, represents an auspicious alternative to the popular cobalt based pigments, as it displays a satisfactory intense blue color, but contrary to known pigments consists of non-toxic and cheap elements.Conflicts of interest
There are no conflicts to declare.References
- S. W. Kim, G. E. Sim, J. Y. Ock, J. H. Son, T. Hasegawa, K. Toda and D. S. Bae, Dyes Pigm., 2017, 139, 344–348 CrossRef CAS.
- T.-G. Kim, S.-J. Kim, C. C. Lin, R.-S. Liu, T.-S. Chan and S.-J. Im, J. Mater. Chem. C, 2013, 1, 5843–5848 RSC.
- A. E. Smith, M. C. Comstock and M. Subramanian, Dyes Pigm., 2016, 133, 214–221 CrossRef CAS.
- M. Llusar, A. Forés, J. Badenes, J. Calbo, M. Tena and G. Monrós, J. Eur. Ceram. Soc., 2001, 21, 1121–1130 CrossRef CAS.
- M. Llusar, A. Zielinska, M. Tena, J. Badenes and G. Monrós, J. Eur. Ceram. Soc., 2010, 30, 1887–1896 CrossRef CAS.
- A. E. Smith, H. Mizoguchi, K. Delaney, N. A. Spaldin, A. W. Sleight and M. A. Subramanian, J. Am. Chem. Soc., 2009, 131, 17084–17086 CrossRef CAS.
- S. Tamilarasan, D. Sarma, M. Reddy, S. Natarajan and J. Gopalakrishnan, RSC Adv., 2013, 3, 3199–3202 RSC.
- M. Xiao, Y. Wei and P. Zhang, J. Electron. Mater., 2019, 48, 1652–1659 CrossRef CAS.
- T. Endo, Y. Doi, M. Wakeshima and Y. Hinatsu, Inorg. Chem., 2010, 49, 10809–10814 CrossRef CAS.
- T. Kim, Y. Kim and S. Kang, Appl. Phys. B: Lasers Opt., 2012, 106, 1009–1013 CrossRef CAS.
- S. Yao, Y. Li, L. Xue and Y. Yan, J. Am. Ceram. Soc., 2010, 93, 3793–3797 CrossRef CAS.
- S. Nishiura and S. Tanabe, IEEE J. Sel. Top. Quantum Electron., 2009, 15, 1177 CAS.
- J. Yan, C. Liu, J. Vlieland, J. Zhou, P. Dorenbos, Y. Huang, Y. Tao and H. Liang, J. Lumin., 2017, 183, 97–101 CrossRef CAS.
- C. Li, C. Yin, J. Chen, H. Xiang, Y. Tang and L. Fang, J. Eur. Ceram. Soc., 2018, 38, 5246–5251 CrossRef CAS.
- W. Chen, Y. Cheng, L. Shen, C. Shen, X. Liang and W. Xiang, J. Alloys Compd., 2018, 762, 688–696 CrossRef CAS.
- H.-J. Koo, Solid State Commun., 2012, 152, 1116–1118 CrossRef CAS.
- M. C. Biesinger, B. P. Payne, A. P. Grosvenor, L. W. Lau, A. R. Gerson and R. S. C. Smart, Appl. Surf. Sci., 2011, 257, 2717–2730 CrossRef CAS.
- H. Mizoguchi, A. W. Sleight and M. Subramanian, Inorg. Chem., 2011, 50, 10–12 CrossRef CAS.
Footnote |
| † Electronic supplementary information (ESI) available. See DOI: 10.1039/d0ma00541j |
| This journal is © The Royal Society of Chemistry 2020 |

