 Open Access Article
Different electronic states of isomorphous chiral vs. racemic organic conducting salts, β′′-(BEDT-TTF)2(S- and rac-PROXYL-CONHCH2SO3)†‡
Hiroki
Akutsu
 *a,
Akiko
Kohno
a,
Scott S.
Turner
 b,
Satoshi
Yamashita
a and
Yasuhiro
Nakazawa
a
aDepartment of Chemistry, Graduate School of Science, Osaka University, 1-1 Machikaneyama, Toyonaka, Osaka 560-0043, Japan. E-mail: akutsu@chem.sci.osaka-u.ac.jp
bDepartment of Chemistry, University of Surrey, GU2 7XH, Guildford, Surrey, UK
First published on 28th September 2020
Abstract
The chiral and racemic salts β′′-(BEDT-TTF)2(S- and rac-PROXYL-CONHCH2SO3) (S-2 and rac-2) are almost isomorphous apart from a deviation in the C–H bond direction at the chiral centre. Both salts are metallic at room temperature, with similar broad metal-insulator transitions. Band structure calculations of the chiral and racemic salts indicate that both electronic structures are quite similar. However, at 30 K, S-2 has a resistivity that is nearly three orders of magnitude higher than that of rac-2. The results suggest a significant effect of the broken inversion symmetry, due to the positional change of only one atom.
Introducing chirality into electrical conductors1 has been extensively reported, for example, chirality introduced into donors,1a,b,f–n anions,1d and guest molecules.1c This is, in part, due to the observation of magnetochiral anisotropy as seen in carbon nanotubes2 and TTF-based materials3 (TTF = tetrathiafulvalene). Chiral conductors, since the inversion symmetry is broken, may exhibit directional propagation of conducting electrons. For example, where the ‘rightward’ and ‘leftward’ currents differ from each other.4 Moreover, the conductivities of polar conductors may be higher than those of their non-polar counterparts because of the imperfect cancelation of the ‘rightward’ and ‘leftward’ currents. However, where some chiral donor-based salts are conductors, many are insulators. But usually the donors have two chiral centres,5 whose dipole moments oppose each other, and essentially become cancelled. Here we introduce BEDT-TTF-based organic conductors where only one chiral centre is introduced via a counter anion. The chiral and racemic salts are almost isomorphous, the structures and electrical properties of which have been reported (BEDT-TTF = bis(ethylenedithio)tetrathiafulvalene).
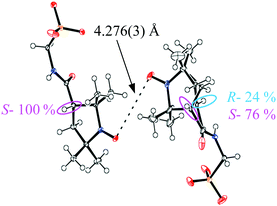
Racemic PROXYL-COOH (PROXYL = 2,2,5,5-tetramethyl-pyrrolidin-1-oxyl free radical) and its optical resolution were achieved according to the literature methods.6,7 The S- and R-PROXYL-CONHCH2SO3 anions (S- and R-1), obtained as tetraphenylphosphonium (PPh4) salts, were prepared by the same synthetic procedure as for the racemic form (rac-1) reported in ref. 8. PPh4S-1 and PPh4R-1 are almost isomorphous to PPh4rac-1 except at the chiral centre (see Fig. S1 and Table S1, ESI‡). Black plate crystals of the BEDT-TTF salt S-2 were obtained by constant current electrocrystallisation in a mixed solvent of PhCl (18 mL) and CH3CN (2 mL) with 15 mg of BEDT-TTF and 70 mg of PPh4S-1. The typical crystal size is 0.5–1.5 × 0.5–1.5 × 0.2–1.0 mm. X-ray diffraction data of S-2 were collected at 290, 106 and 29 K. There are four crystallographically independent BEDT-TTF molecules and two independent anions. The space group is P1 at all temperatures, and the Flack parameters are 0.13 (6), 0.11(6) and −0.01(3) at 290, 106, and 29 K, respectively. However, the space group is almost P![[1 with combining macron]](https://www.rsc.org/images/entities/char_0031_0304.gif) , since there are pseudo-inversion centres except at the chiral centre: the C–H atoms are circled in pink in Fig. 1.
, since there are pseudo-inversion centres except at the chiral centre: the C–H atoms are circled in pink in Fig. 1.
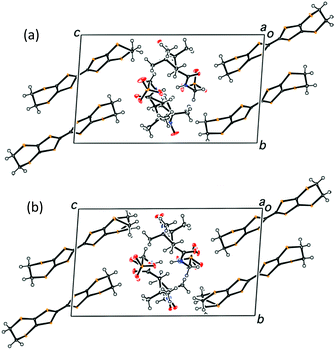
For comparison purposes the crystal structure of rac-2, which we have already reported at room temperature,8 was re-determined at 106 and 28 K. Table S2, ESI‡ shows the crystallographic data, indicating that S-2 and rac-2 are almost isomorphous. However, S-2 shows disorder of the chiral centre C–H atoms at 29 K (Fig. 1). One independent anion has no disorder, being 100% in the S-configuration, but the other anion has disorder in which 24% has the R-configuration (blue circle). Overall the ratio of the S- and R- configurations in S-1 of 88![[thin space (1/6-em)]](https://www.rsc.org/images/entities/char_2009.gif) :
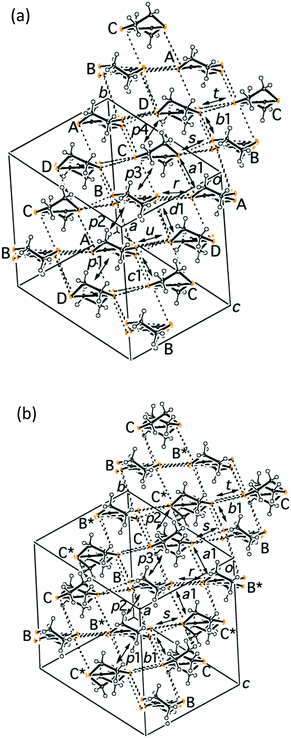
:![[thin space (1/6-em)]](https://www.rsc.org/images/entities/char_2009.gif) 12 and 76% e.e. was estimated. Fig. 2a and b shows the crystal structures of S- and rac-2 at 29 and 28 K, respectively, indicating that they are almost isomorphous. Fig. 3 shows the donor arrangements within S-2 and rac-2 at 29 and 28 K, respectively. S-2 has four crystallographically independent BEDT-TTF molecules (A, B, C and D) and rac-2 has two (B and C).
12 and 76% e.e. was estimated. Fig. 2a and b shows the crystal structures of S- and rac-2 at 29 and 28 K, respectively, indicating that they are almost isomorphous. Fig. 3 shows the donor arrangements within S-2 and rac-2 at 29 and 28 K, respectively. S-2 has four crystallographically independent BEDT-TTF molecules (A, B, C and D) and rac-2 has two (B and C).
The structures are almost isomorphous so that B* and C* in rac-2 correspond to A and D in S-2, respectively. Magnetic susceptibility measurements for S-2 are shown in Fig. S2a, ESI.‡ The susceptibility curve of S-2 is similar to that of rac-2 (Fig. S2b,8 ESI‡) apart from the low temperature part where the χT value at 2 K for S-2 is approximately half of that for rac-2. This decrease is caused by the interaction between the radical parts of the anions as shown in Fig. 1. The O⋯O distance in S-2 of 4.276(3) Å (Fig. 1) at 29 K is approximately 0.2 Å shorter than the equivalent distance in rac-2 at 28 K (4.429(5) Å shown in Fig. S5, ESI‡). The shorter interaction in S-2 results in a large decrease in χT due to the more negative coupling constant J (−3.8 K) than that for rac-2 (J = −1.1 K).8
The temperature-dependent electrical resistivities of S-2 and rac-2 are shown in Fig. 4. The rac-2 data were re-measured using the same instrument (HUSO-994C1 multi-channel 4-terminal conductometer) at the same cooling and heating rate (≈0.5 K min−1) as that for S-2 by the conventional 4-probe method. The black arrows in the inset indicate the metal-insulator (MI) transition temperatures. Both salts have the same transition temperatures, 220 K for the cooling experiment and 270 K for heating. The large hysteresis indicates that the MI transition is 1st order. Since both salts are almost isomorphous, it is expected that they would have almost the same MI transition temperature (TMI). In addition, rac-2 shows a larger deviation between the cooling and heating curves than S-2, a tendency which was observed for all the four crystals that we measured. Furthermore, the ρ/ρRT value of S-2 at the lowest temperature as shown in Fig. 4 is almost three orders of magnitude higher than that of rac-2. The room temperature resistivity of S-2 (ρS-2(RT)) of 0.195 Ω cm is slightly higher than that of rac-2 (ρrac-2(RT)) of 0.126 Ω cm, but at the lowest temperature ρS-2(30 K) = 2.42 × 10⁵ and ρrac-2(30 K) = 4.55 × 10² Ω cm. The stark difference suggests that the electronic states of these salts are significantly different.
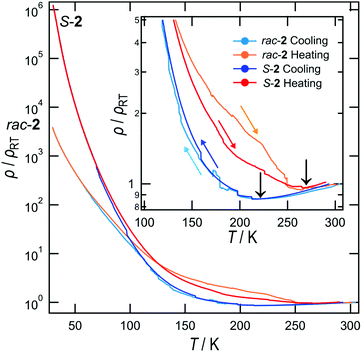 | ||
| Fig. 4 Temperature-dependent electrical resistivities of S-2 and rac-2. The inset shows an expansion of the high temperature region. | ||
To confirm this, we calculated the band structures9 for S-2/rac-2 at 29/28 and 106/106 K. The results at 106 K shown in Fig. 5a suggest that the band dispersions and the Fermi surfaces are almost the same. The texture of the Fermi surfaces is likely semi-metallic, that is electron and hole pockets exist, which is typical of salts with β′′- arrangements of BEDT-TTF.10–12 The results clearly indicate that the chiral and racemic salts have quite similar band electronic structures.
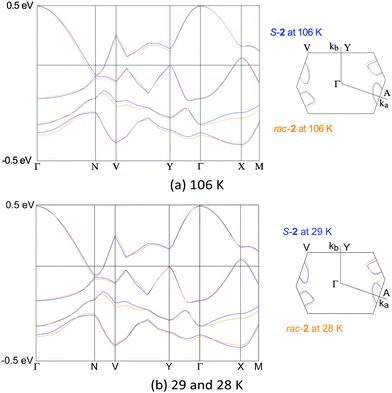 | ||
| Fig. 5 Electronic band structures calculated for S-2 (blue lines) and rac-2 (orange lines). Transfer integrals are shown in Table S3, ESI.‡ | ||
The activation energies at 40 K for S-2 (EaS-1(40 K)) and rac-2 (Earac-1(40 K)) are 14.3 and 5.8 meV, respectively. The value for S-2 is approximately 2.5 times larger than that for rac-2. Previously we reported that the racemic salt has a charge-ordered ground state, which is common for β′′-type salts.8 This implies that the insulating state of S-2 has a unique character.
The S-2 crystal is chiral and polar, which is caused only by a chiral centre C–H bond because the other bonds of the anion have pseudo-inversion pairs. We estimated the dipole moment using MOPAC201613 and Winmostar V9.2.5 as shown in Fig. S3, ESI.‡ A net dipole moment of 0.6 Debye per anion was determined. The effective voltage applied by the anion can be estimated14 and was found to be 0.36 eV.
The molecular charges of each crystallographically independent donor molecule at each temperature are estimated from the C![[double bond, length as m-dash]](https://www.rsc.org/images/entities/char_e001.gif) C and C–S bond lengths.15 The results are summarized in Table 1.
C and C–S bond lengths.15 The results are summarized in Table 1.
| rac- | S- | ||||||
|---|---|---|---|---|---|---|---|
| 28 K | 106 K | 295 K | 28 K | 106 K | 295 K | ||
| A = B | 0.480 | 0.457 | 0.352 | A | 0.475 | 0.511 | 0.369 |
| B | 0.480 | 0.457 | 0.352 | B | 0.514 | 0.440 | 0.502 |
| C | 0.520 | 0.543 | 0.648 | C | 0.542 | 0.462 | 0.479 |
| D = C | 0.520 | 0.543 | 0.648 | D | 0.469 | 0.587 | 0.650 |
| C + F | 1.040 | 1.086 | 1.296 | C + D | 1.011 | 1.049 | 1.129 |
| A + B | 0.960 | 0.914 | 0.704 | A + B | 0.989 | 0.951 | 0.871 |
| Diff. | 0.080 | 0.172 | 0.592 | Diff. | 0.022 | 0.098 | 0.258 |
| B + C | 0.500 | 0.500 | 0.500 | B + C | 1.056 | 0.902 | 0.981 |
| A + D | 0.500 | 0.500 | 0.500 | A + D | 0.944 | 1.098 | 1.019 |
| Diff. | 0.000 | 0.000 | 0.000 | Diff. | 0.112 | −0.196 | −0.038 |
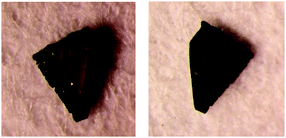
The charges of the A and B or C and D donors are the same in rac-2 because crystallographically A = B* (Fig. 3) = B and D = C* (Fig. 3) = C. In this circumstance, the charge differences can be observed between the C-D and A-B dimers (hereafter named CD and AB, respectively). On the other hand, there are no differences between the B-C and A-D dimers (BC and AD) because BC and AD are related by inversion symmetry. For the S-2 salt, no such symmetry relationships exist because of the P1 space group. At room temperature, both salts have relatively large charge disproportionation between the CD and AB dimers despite both being metallic. The differences are larger than those between BC and AD for S-2. For rac-2, the charge disproportionation between BC and AD is zero crystallographically and between CD and AB becomes small on lowering the temperature, reaching only 0.080 at the lowest temperature. S-2 has a similar tendency to rac-2 and the difference between CD and AB becomes almost zero at 29 K. The difference in S-2 between BC and AD becomes negative −0.196 at 106 K but then changes to positive 0.112 at the lowest temperature. Therefore the CD-AB and BC-AD charge disproportionations for rac-2 and S-2, respectively, are dominant at the lowest temperature. It is also evident that the CD-AB charge disproportionation does not provide any dipole moments but the BC-AD charge disproportionation does as shown in Fig. S4, ESI‡ and a schematic diagram for S-2 is shown in Fig. 6. Normally in β′′-salts, one of the two independent dimers protrudes marginally in one direction, normal to the stacking direction and the nearest neighbouring dimer protrudes in the opposite direction. In other words, the β′′-layer has hollows, as schematically shown in Fig. 6, in which the counter anions are located. Thus, charge rich BC and charge poor AD protrude in the opposite directions, which provides a dipole moment normal to the donor stacking layer as shown in Fig. 6. Each anion layer also has a net dipole moment in a direction almost coincident with the long direction of the BEDT-TTF molecules. The directions of the cation and anion dipole moments are opposite as shown in Fig. 6, suggesting that the dipole moments of the donor layers cancel the net dipole moment of the crystal at the lowest temperature. In addition, the crystal has a net dipole moment at room temperature; therefore, there is a significant difference between the opposite surfaces, as shown in Fig. 7, which is known for some polar crystals16 and our previously reported salt.17 Here one surface (right in Fig. 7) is smoother than the opposite surface (left in Fig. 7).
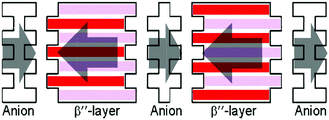 | ||
| Fig. 6 Schematic diagram of the polarities in S-2. Red and pink bars indicate the B-C and A-D dimers, respectively. | ||
I–V curve measurements were performed at 50 K using a FET-1E system (TOYO corporation) as shown in Fig. S6, ESI.‡ Both samples did not show ferroelectric behaviours.
In addition, the ratio of the activation energies of S-2 and rac-2 is 2.5, suggesting that S-2 has a 2.5 times more strongly localized insulating state compared to rac-2, and the polarized distribution of the holes makes S-2 less conductive. However, this explanation contradicts the conjecture that polar conductors are more conductive than non-polar conductors. Nevertheless, we believe that a band-insulating and near metallic polar conductor might show a higher conductivity than a non-polar conductor. The preparation of such polar salts is now in progress.
In conclusion, we have prepared almost isomorphous β′′-(BEDT-TTF)2(S- and rac-PROXYL-CONHCH2SO3) molecular conductors. The structural difference is that only one chiral centre carbon atom in the counter anion breaks the inversion symmetry. However, the chirality leads to an electronic state change which is a unique insulating state. Ultimately, this novel state provides almost three orders of magnitude higher resistivity compared to that in the racemic salt at ca. 30 K.
Conflicts of interest
There are no conflicts to declare.Acknowledgements
This work has been supported by Grant-in-Aid for Scientific Research (No. 17K05751) from the Japan Society for the Promotion of Science. Low temperature X-ray measurements were performed at the Institute for Molecular Science, for which we are grateful to Dr Yoshinori Okano, supported by the Nanotechnology Platform Program “Molecule and Material Synthesis” (JPMXP09S19MS1046) of the Ministry of Education, Culture, Sports, Science and Technology (MEXT), Japan.Notes and references
- (a) J. I. Short, T. J. Blundell, S. J. Krivickas, S. Yang, J. D. Wallis, H. Akutsu, Y. Nakazawa and L. Martin, Chem. Commun., 2020, 56, 9497–9500 RSC; (b) N. Avarvari and J. D. Wallis, J. Mater. Chem., 2009, 19, 4061–4076 RSC; (c) L. Martin, P. Day, H. Akutsu, J. I. Yamada, S. Nakatsuji, W. Clegg, R. W. Harrington, P. N. Horton, M. B. Hursthouse, P. McMillan and S. Firth, CrystEngComm, 2007, 9, 865–867 RSC; (d) L. Martin, H. Akutsu, P. N. Horton and M. B. Hursthouse, CrystEngComm, 2015, 17, 2783–2790 RSC; (e) L. Martin, H. Akutsu, P. N. Horton, M. B. Hursthouse, R. W. Harrington and W. Clegg, Eur. J. Inorg. Chem., 2015, 1865–1870 CrossRef CAS; (f) N. Mroweh, F. Pop, C. Mézière, M. Allain, P. Auban-Senzier, N. Vanthuyne, P. Alemany, E. Canadell and N. Avarvari, Cryst. Growth Des., 2020, 20, 2516–2526 CrossRef CAS; (g) N. Mroweh, P. Auban-Senzier, N. Vanthuyne, E. Canadell and N. Avarvari, J. Mater. Chem. C, 2019, 7, 12664–12673 RSC; (h) F. Pop, P. Auban-Senzier, E. Canadell and N. Avarvari, Chem. Commun., 2016, 52, 12438–12441 RSC; (i) S. Yang, F. Pop, C. Melan, A. C. Brooks, L. Martin, P. Horton, P. Auban-Senzier, G. L. J. A. Rikken, N. Avarvari and J. D. Wallis, CrystEngComm, 2014, 16, 3906–3916 RSC; (j) S. Yang, A. C. Brooks, L. Martin, P. Day, M. Pilkington, W. Clegg, R. W. Harrington, L. Russo and J. D. Wallis, Tetrahedron, 2010, 66, 6977–6989 CrossRef CAS; (k) R. J. Brown, A. C. Brooks, J. P. Griffiths, B. Vital, P. Day and J. D. Wallis, Org. Biomol. Chem., 2007, 5, 3172–3182 RSC; (l) J. R. Galáln-Mascarós, E. Coronado, P. A. Goddard, J. Singleton, A. I. Coldea, J. D. Wallis, S. J. Coles and A. Alberolá, J. Am. Chem. Soc., 2010, 132, 9271–9273 CrossRef; (m) F. Pop, S. Laroussi, T. Cauchy, C. J. Gomez-Garcia, J. D. Wallis and N. Avarvari, Chirality, 2013, 25, 466–474 CrossRef CAS; (n) F. Pop, P. Auban-Senzier, A. Fraìckowiak, K. Ptaszyński, I. Olejniczak, J. D. Wallis, E. Canadell and N. Avarvari, J. Am. Chem. Soc., 2013, 135, 17176–17186 CrossRef CAS.
- G. L. J. A. Rikken, J. Folling and P. Wyder, Phys. Rev. Lett., 2001, 87, 236602 CrossRef CAS.
- F. Pop, P. Auban-Senzier, E. Canadell, G. L. J. A. Rikken and N. Avarvari, Nat. Commun., 2014, 5, 4757 CrossRef.
- D. Choe, M.-J. Jin, S.-I. Kim, H.-J. Choi, J. Jo, I. Oh, J. Park, H. Jin, H. C. Koo, B.-C. Min, S. Jong, H.-W. Lee, S.-H. Baek and J. W. Yoo, Nat. Commun., 2019, 10, 4510 CrossRef.
- F. Pop, P. Auban-Senzier, E. Canadell and N. Avarvari, Chem. Commun., 2016, 52, 12438–12441 RSC.
- K. Yamada, Y. Kinoshita, T. Yamasaki, H. Sadasue, F. Mito, M. Nagai, S. Matsumoto, M. Aso, H. Suemune, K. Sakai and H. Utsumi, Arch. Pharm. Chem. Life. Sci., 2008, 341, 548–553 CrossRef CAS.
- B. Chion, J. Lajzerowicz, D. Bordeaux, A. Collet and J. Jacques, J. Phys. Chem., 1978, 82, 2682–2688 CrossRef CAS.
- H. Akutsu, K. Sato, S. Yamashita, J. Yamada, S. Nakatsuji and S. S. Turner, J. Mater. Chem., 2008, 18, 3313–3315 RSC.
- T. Mori, A. Kobayashi, Y. Sasaki, H. Kobayashi, G. Saito and H. Inokuchi, Bull. Chem. Soc. Jpn., 1984, 57, 627–633 CrossRef CAS.
- K. Furuta, H. Akutsu, J. Yamada, S. Nakatsuji and S. S. Turner, J. Mater. Chem., 2006, 16, 1504–1506 RSC.
- T. Mori, Bull. Chem. Soc. Jpn., 1998, 71, 2509–2526 CrossRef CAS.
- S. Uji, Y. Iida, S. Sugiura, T. Isono, K. Sugii, N. Kikugawa, T. Terashima, S. Yasuzuka, H. Akutsu, Y. Nakazawa, D. Graf and P. Day, Phys. Rev. B., 2018, 97, 144505 CrossRef.
- J. J. P. Stewart, Stewart Computational Chemistry, Colorado Springs, CO, USA, http://OpenMOPAC.net.
- M. Suda, N. Kameyama, A. Ikegami and Y. Einaga, J. Am. Chem. Soc., 2009, 131, 865–870 CrossRef CAS.
- P. Guionneau, C. J. Kepert, G. Bravic, D. Chasseau, M. R. Truter, M. Kurmoo and P. Day, Synth. Met., 1997, 86, 1973 CrossRef CAS.
- A. N. Mariano and R. E. Hanneman, J. Appl. Phys., 1963, 34, 384–388 CrossRef CAS.
- H. Akutsu, K. Ishihara, J. Yamada, S. Nakatsuji, S. S. Turner and Y. Nakazawa, CrystEngComm, 2016, 18, 8151–8154 RSC.
Footnotes |
| † This article is dedicated to the memory of Professor Peter Day (1938–2020). |
| ‡ Electronic supplementary information (ESI) available: CCDC 2022034, 2022036, 2022037, 2022039, 2022041, 2022042 and 2022046. For ESI and crystallographic data in CIF or other electronic format see DOI: 10.1039/d0ma00694g |
| This journal is © The Royal Society of Chemistry 2020 |


