 Open Access Article
Creative Commons Attribution 3.0 Unported Licence
Nitrogen and sulphur co-doped carbon quantum dots and their optical power limiting properties†
Senqiang
Zhu
a,
Kunyan
Wang
b,
Jinyang
Hu
a,
Rui
Liu
 *a and
Hongjun
Zhu
 *a
*a
aSchool of Chemistry and Molecular Engineering, Nanjing Tech University, Nanjing 211816, China. E-mail: rui.liu@njtech.edu.cn; zhuhj@njtech.edu.cn
bSchool of Material Engineering, Jinling Institute of Technology, Nanjing 211169, China
First published on 22nd October 2020
Abstract
For the sake of good performance in nonlinear optical (NLO) applications, two S,N-codoped carbon quantum dots (CQDs) were synthesized from 3,7-dinitro-10H-phenothiazine under different conditions of alkaline solution (D-1 from NaOH, D-2 from ammonia). The synthesized carbon quantum dots D-1 and D-2 are monodisperse with narrow size distribution (average 2.8 and 3.1 nm). These CQDs exhibit strong π–π* transition in the UV region and broad intramolecular charge transfer (1ICT) transition absorption bands in the visible region. The PL properties of CQDs are excitation and pH dependent. In addition, the PL intensity of the CQDs remains stable under high ionic strength and 100 W UV light irradiation. Moreover, D-1 and D-2 exhibit delightful NLO response and OPL performance at 532 nm and 1000 nm laser pulses, and the results further elucidate that these CQDs are promising nonlinear optical materials for optical power limiting applications.
Introduction
Since the first carbon quantum dots (CQDs) were reported by Scrivens et al. in 2004,1 they have caught much attention in many fields for their unique photophysical properties. CQDs exhibit excitation- and pH-dependent emission, excellent photostability, high quantum yield and up-conversion properties, which make them act as outstanding optoelectronic materials.2,3 Recent research progress further proved that CQDs have great potential applications in lasing,4 solar cells,5 photodetectors,6 and light-emitting diodes.7,8 As is well known, two classical synthetic approaches have been demonstrated in the preparation of CQDs. The former one is top-down methods, which cleave larger carbon structures to smaller ones by laser ablation, arc discharge or electrochemical oxidation.1,9,10 However, such methods produce CQDs in a low production yield and the processes are difficult and expensive. Therefore, more attention is focused on the bottom-up methods, which offer relatively high yields and convenient synthetic routes. The bottom-up methods are realized by the carbonization of organic precursors or fusion of organic molecules under thermal/solvothermal/hydrothermal conditions.11–13 To date, most of the optoelectronic CQDs were synthesized by bottom-up methods due to the advantage of low price, high yield, and excellent photophysical properties.To date, some investigations have focused on the nonlinear optical (NLO) properties of CQDs, because CQDs offer featureless absorption spectra which cause unique broadband optical power limiting (OPL) possibilities.14,15 Compared with other emerging types of nonlinear optical materials (such as MOFs, antimonene, MXenes, TiS2, and perovskites),16–20 CQDs exhibit comparable OPL properties. Moreover, CQDs have been regarded as promising candidates in NLO device design because of the presence of abundant delocalized π-electrons, which ensured that the materials had good nonlinear optical performance. What's more, CQDs are easy to synthesise and endowed with low-price. The mechanism of the OPL property of CQDs is attributed to nonlinear scattering of the incident laser radiation.21,22 The Couris group reported quasi-spherical sized carbon quantum dots,23 which were found to exhibit a significant nonlinear optical response under the conditions of 532 and 1064 nm, ps and ns laser pulses. The OPL threshold of CQDs was determined to be ca. 0.25 and 0.5 J cm−2 for 532 and 1064 nm laser pulses, respectively. The Liang group successfully synthesized a series of CQDs from citric acid,24 which showed positive nonlinear refractivity and negative nonlinear absorption coefficient, indicating the satisfactory performance of the nonlinear property. CQDs exhibit potential prospects in the application of NLO materials.
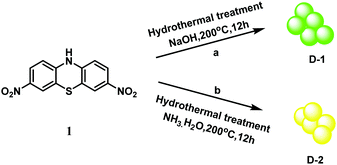
What's more, element doping is proposed to be an effective approach which could improve the fluorescence efficiency and tune the photophysical characteristics of the CQDs. Nitrogen- and sulphur-doped CQDs have shown excellent exhibition in multifunctional applications. For the sake of good performance, we synthesized the S,N-codoped CQDs D-1 and D-2 from the phenothiazine derivative by hydrothermal treatment. In the work to be reported below, we demonstrate that D-1 and D-2 exhibit excitation- and pH-dependent emission and OPL responses, indicating the potential application of NLO materials (Scheme 1).
Results and discussion
Design and synthesis
The CQDs are prepared by the bottom-up approach to obtain high emission efficiency.25 Detailed synthetic procedures and characterization data for the precursors and CQDs can be found in the Experimental section and ESI.† Hereby, we employed a hydrothermal treatment of alkaline solution to synthesize the CQDs due to its facility and effectiveness. 3,7-Dinitro-10H-phenothiazine was used as the precursor. NaOH aqueous solution and ammonia were used to compare the influence of alkaline solution. Two different CQDs were prepared under different conditions of alkaline solution (D-1 from NaOH, D-2 from ammonia). The hydrothermal conditions and reaction time were optimized to achieve the optimum quantum yield. The as-prepared CQDs were further purified by dialysis and are quite soluble in water and common polar organic solvents, which implies that these dots have good monodispersion.Characterization of CQDs
The size distribution and morphology of these CQDs were characterized by TEM (Fig. S1, ESI†) and HRTEM (Fig. 1). As shown in Fig. S1 (ESI†), the CQDs are quasispherical and monodisperse with a narrow size distribution. Fig. 1 shows the HRTEM image of D-1 and D-2, demonstrating the spherical shape and narrow size distribution which are mainly in the range of 1.5–4 nm. The average diameters of D-1 and D-2 are 2.8 and 3.1 nm, respectively. This result of HRTEM clearly certifies the successful formation of these two CQDs. Otherwise, no obvious crystalline planes and patterns were found in the HRTEM images, attesting to the amorphous structure of D-1 and D-2. The atomic force microscopy (AFM) image (Fig. S2, ESI†) further complements the HRTEM result, and it reveals that the CQDs are around 1.4 nm in thickness, which is close to 4–5 graphene layers.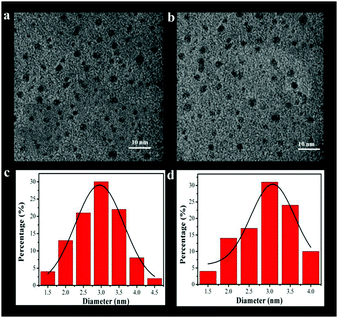 | ||
| Fig. 1 HRTEM images of the obtained D-1 and D-2 (a and b); and the images of size distribution (c and d). | ||
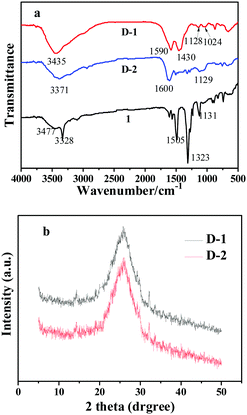
For further confirm the surface functionalities, the CQDs were characterized by Fourier transform infrared (FT-IR) spectra and X-ray powder diffraction (XRD) measurements. FT-IR spectra (Fig. 2a) of precursor 1 show two peaks centered at 3477 cm−1 and 3328 cm−1, corresponding to the stretching vibrations of O–H/N–H in the phenothiazine. Another strong peak centered at 1505 cm−1 represents the bending vibrations of the nitro unit. For the as-prepared CQDs, they showed a decrease in adsorption of the nitro unit bending vibrations at 1505 cm−1 owning to the drop of the nitro unit during the formation of nanoparticles. The D-1 nanoparticles exhibited characteristic absorption bands of N–H and O–H stretching vibrations at 3435 cm−1, N–H and O–H bending vibrations at 1430 cm−1 and 1590 cm−1, and C–N and C–O stretching vibrations at 1024 cm−1 and 1128 cm−1. Different from D-1, the D-2 CQDs exhibited characteristic absorption bands of N–H and O–H stretching vibrations at 3371 cm−1, indicating more amino group on the D-2 surfaces. The absorption bands from N–H bending vibrations were also observed at 1600 cm−1. Otherwise, no obvious absorption bands of C–S were exhibited in the FT-IR spectra. There are two possible reasons for the emission of C–S absorption bands. First, the absorption bands of C–S are similar to those of C–N and C–O stretching vibrations. Second, the small amounts of sulfur result in weak absorption bands. In addition, the XRD (Fig. 2b) shows a broad (002) peak centered at around 2θ = 24.96, which further confirms the CQD structure. The interlayer spacing distances of D-1 and D-2 are 0.534 nm and 0.551 nm, respectively. The value of interlayer spacing distance is a little larger than the graphene structure, owing to the existence of organic functional groups on the CQD surfaces. Besides, no other diffraction peaks were found owing to the amorphous structure, which is in agreement with the TEM results. Raman spectroscopy also exhibits the characteristic G band at ca. 1609 cm−1 and the D band at ca. 1309 cm−1 (Fig. S3, ESI†), the crystalline G-band (ID/IG) for the N,S-CQDs is about 0.4, indicating its high quality.
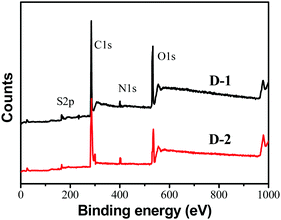
To analyze the elemental composition of the CQDs, X-ray photoelectron spectra (XPS) were recorded. As illustrated in Fig. 3, the as-prepared CQDs mainly contain carbon, oxygen, nitrogen and sulfur, similar to the composition of other CQDs in the literature.26–28Table 1 shows the concentration of C, N, O, and S in D-1 and D-2 determined by XPS. It is noted that the nitrogen percentage in D-2 is much higher than that in D-1 and the nitrogen content of D-2 reached up to 9.69% by weight (3.45% for D-1), which is because the addition of ammonia increases the nitrogen precursors. The high-resolution spectra of C1s exhibit three main peaks (Fig. S3a and S4a, ESI†). Among these, the binding energy peak at 284.3 eV confirms the graphitic structure (sp2 C–C). The peak at about 285.9 eV suggests the presence of C–N/C–O/C–S, and the peak around 285.0 eV could be assigned to C![[double bond, length as m-dash]](https://www.rsc.org/images/entities/char_e001.gif) C. Besides, the N1s spectra (Fig. S3b and S4b, ESI†) show three peaks at 398.7 eV, 399.6 eV, and 400.4 eV, which are attributed to pyridinic N, amino N and pyrrolic N, respectively. What's more, the high-resolution spectra of S2p were also studied (Fig. S3c and S4c, ESI†), and two obvious peaks reveal the presence of S2p3/2 C–S–C unit (163.5 eV) and S2p1/2 C–S–C unit (164.7 eV). These high-resolution spectra clearly show the formation of the CQDs and confirm the successful incorporation of nitrogen and sulfur into the core of the carbon dots.
C. Besides, the N1s spectra (Fig. S3b and S4b, ESI†) show three peaks at 398.7 eV, 399.6 eV, and 400.4 eV, which are attributed to pyridinic N, amino N and pyrrolic N, respectively. What's more, the high-resolution spectra of S2p were also studied (Fig. S3c and S4c, ESI†), and two obvious peaks reveal the presence of S2p3/2 C–S–C unit (163.5 eV) and S2p1/2 C–S–C unit (164.7 eV). These high-resolution spectra clearly show the formation of the CQDs and confirm the successful incorporation of nitrogen and sulfur into the core of the carbon dots.
| Samples | Element content/% | |||
|---|---|---|---|---|
| C | O | N | S | |
| 1 | 49.83 | 22.12 | 14.53 | 11.08 |
| D-1 | 55.34 | 36.15 | 3.45 | 0.83 |
| D-2 | 58.59 | 26.39 | 9.69 | 0.51 |
The ground state properties of CQDs
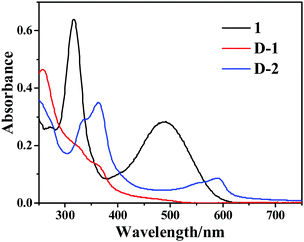
The UV-Vis absorption spectra of precursor 1, D-1 and D-2 are presented in Fig. 4. Precursor 1 exhibits two obvious absorption peaks located at 318 nm and 493 nm. The absorption band at 318 can be assigned to the π–π* transition of the conjugated π-system because of the narrow sharp and strong intensity. Another band at 493 nm corresponds to the intramolecular charge transfer (1ICT) transitions from the electron-donating phenothiazine moiety to the electron-withdrawing nitro group. The main absorption bands of D-1 and D-2 are located in the ultraviolet region and D-1 shows strong absorption intensity at 260 nm and 350 nm, corresponding to the π–π* transition of the aromatic sp2 domains and the trapping of excited-state energy by the surface states, respectively. Different from D-1, D-2 exhibits an obvious band at 600 nm, which should be due to the high conjugation and high quality of D-2, which are in line with similar CQDs reported previously.13,27 The broad ground state absorption is also beneficial to broaden the optical protection window for OPL applications.The emission properties of CQDs
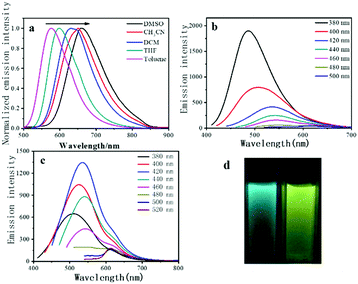
Precursor 1 exhibits a pronounced positive solvatochromic effect in different solvents (Fig. 5a). When the polarity of the solvent increases, the emission energy of the precursor 1 decreases. In a low-polarity solvent (toluene), precursor 1 shows yellowish-green emission at 577 nm, and when in a high-polarity solvent (DMSO), the emission turns to red (658 nm), which reveals the typical ICT emission. Under UV light excitation, D-1 and D-2 exhibit green and yellow emission in the aqueous solution, respectively. Like most CQDs, the emission wavelengths of the D-1 and D-2 are dependent on their excitation wavelengths.25 As shown in Fig. 5b and c, the emission wavelength of D-1 shifts from 486 to 586 nm when the excitation wavelength changes from 380 to 500 nm, whereas the emission wavelength of D-2 shifts from 535 to 618 nm when the excitation wavelength changes from 380 to 520 nm. In addition, D-1 exhibits the highest emission intensity at 486 nm under the excitation of a 380 nm xenon lamp. When the excitation wavelength decreases, the emission intensity of D-1 is also gradually increased. D-2 also shares similar properties, but exhibits the strongest emission under the excitation of 420 nm under a xenon lamp. Although there is still no convincing photoluminescence mechanism for quantum dots, according to the reported work, the obvious excitation-dependent emission could be ascribed to the surface-related defect states.26,28,29To further understand the PL properties of these CQDs, the emission intensity against pH of the medium was investigated. As displayed in Fig. 6, both D-1 and D-2 show great emission intensity when the pH changed from 4 to 10, but under acidic (pH = 2–4) and alkaline conditions (pH = 10–12), the emission intensity precipitously decreased, which may be ascribed to the protonation or deprotonation of the oxygen containing functional groups and thus shift the Fermi level of the CQDs.25,30 Otherwise, D-1 and D-2 exhibit stable emission under different ionic strengths of the medium (Fig. S6, ESI†), indicating the structural stability. The photostability of D-1 and D-2 were also examined by monitoring the change of the emission intensity with irradiation time using the xenon lamp (Fig. S7, ESI†). After irradiation for 1 h, no PL bleaching was observed (486 nm for D-1 and 535 nm for D-2), indicating that D-1 and D-2 are photostable, which is beneficial to their application as OPL materials under the irradiation and excitation of laser pulses.
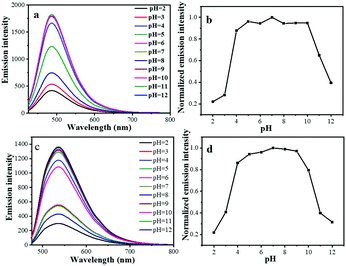 | ||
| Fig. 6 Effect of pH on the fluorescence intensity of D-1 (a and b) and D-2 (c and d), the fluorescence intensities are recorded at 486 nm and 535 nm for D-1 and D-2, respectively. | ||
The optical power limiting properties of CQDs
For several CQDs investigated as protectors against a laser due to their unique nonlinear optical response, the NLO and OPL properties of D-1 and D-2 were evaluated by using the Z-scan technique at 532 nm and C60 is used as the benchmark OPL material.31 During the experiments, when the sample with NLO behavior is moved into the focus slowly, the laser intensity increases and the NLO effect enhances. D-1 and D-2 were individually dispersed in DMF by 30 min of ultrasonic processing. To make sure that all samples were under the same conditions, the linear transmittance at 532 nm was adjusted to 70%.32 As shown in Fig. 7a, all CQDs exhibit an obvious reduction in transmission around the focus of the lens, which indicates a prominent optical limiting response. At the focal point, the input fluence reached a maximum and the transmittance at 532 nm of D-1, D-2 and benchmark OPL material C60 are reduced to a minimum (Tmin) of 72, 64 and 60%, respectively. Compared with the benchmark OPL material C60, D-1 and D-2 exhibit a slightly poorer transmittance at Z = 0 mm. The z-scan response curves were obtained at 1000 nm. Intensity dependent open-aperture Z-scan curves and close-aperture Z-scan curves (35 fs, 1000 nm optical pulses) were also studied (Fig. S8 and S9, ESI†). While the intensity increases, D-1 and D-2 exhibit better NLO responses. Furthermore, nonlinear scattering (NLS) is regarded as another important factor for the NLO effect of CQDs and their derivatives. The fluence-dependent scattering measurement at an angle of 40° to the propagation axis of the transmitted lasers is shown in Fig. 7b, and D-1 and D-2 exhibit better NLS responses than C60. All the results indicate that D-1 and D-2 are able to act as effective NLO materials.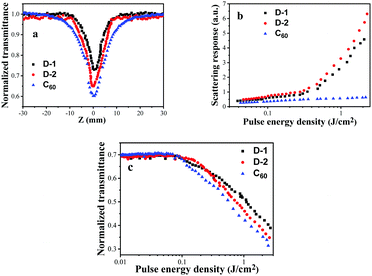 | ||
| Fig. 7 (a) Open-aperture Z-scan curves, (b) scattering response, (c) optical limiting performance of D-1, D-2 and C60 with the same linear transmittance of 70% to 4 ns, 532 nm optical pulses. | ||
Because of the Z-scan properties and good NLS responses, D-1 and D-2 are expected to show great OPL performance. To demonstrate this, non-linear transmission experiments for D-1 and D-2 in DMF were also carried out at 532 nm using a 4.1 ns laser pulse. The concentration of each sample solution was adjusted to a linear transmission of 70% at 532 nm. Fig. 7c displays the output energy density vs. input energy density for D-1, D-2 and C60. When under low energy laser excitation (<0.08 J cm−2), the output energy density was in line with the input energy density, which originates from the linear absorption. When the input energy density was increased to ∼1.5 J cm−2, the normalized transmittance decreases to ca. 46% for D-1 and 42% for D-2, respectively. It is noted that D-2 exhibits better OPL behavior than D-1 due to the larger size of the dots, which could cause stronger NLS response. The OPL effect of CQDs may be ascribed to two mechanisms. One mechanism involves the phase transition from solid to gas with the CQDs generating explosive growth of micro-plasmas. The other one corresponds to heat transfer from the CQDs to the surrounding liquid and expansion of the micro-plasma, leading to solvent bubble growth.33 As a result, D-1 and D-2 show comparable OPL performance to C60. Moreover, doping into the functional polymers is one of the potential device applications for optical power limiting. Different degrees of doping could lead to different optical responses. These dependence investigations were also proved by the Xie group and other groups.34,35 Furthermore, the cheap price and synthesis facility of D-1 and D-2 make them act as promising nonlinear optical materials for OPL applications.
Experimental section
Synthetic procedures
Conclusions
In summary, we reported the structure, photophysical and NLO properties of the S,N-codoped CQDs D-1 and D-2. The results of TEM, AFM, XRD, FT-IR and XPS confirm the successful fabrication of S, N-codoped CQDs. Additionally, their photophysical properties and steady-state fluorescence were studied systemically. D-1 and D-2 not only exhibit excitation- and pH-dependent emission, but also perform satisfactory photostability under the conditions of different ionic strengths and 100 W UV light. The NLO properties and OPL performance of D-1 and D-2 were investigated using Z-scan measurements at 532 nm with 4 ns laser pulses. Both D-1 and D-2 exhibit delightful NLO response and OPL performance. What's more, D-2 exhibits better OPL behavior due to the larger size of the dots, which could cause stronger NLS response. In addition, both CQDs show comparable OPL performance to C60. The cheap price and convenient synthesis facility make them promising nonlinear optical materials for OPL applications. Moreover, the satisfactory photophysical properties make these CQDs potential multi-functional materials for quantum dot light emitting diodes and pH sensors.Conflicts of interest
There are no conflicts to declare.Acknowledgements
The authors greatly acknowledge the financial support provided in part by the Natural Science Foundation of Jiangsu Province (BK20170118), the Natural Science Foundation of Jiangsu Province-Outstanding Youth Foundation (BK20170104), the Six Talent Peaks Project in Jiangsu Province (XCL-037) and the Strategic Pioneer Program on Space Science, Chinese Academy of Sciences (XDA15013100 and XDA15013101).References
- X. Xu, R. Ray, Y. Gu, H. J. Ploehn, L. Gearheart, K. Raker and W. A. Scrivens, J. Am. Chem. Soc., 2004, 126, 12736–12737 CrossRef CAS.
- T. Z. Xin, A. Ananthanarayanan, K. Q. Luo and C. Peng, Small, 2014, 11, 1620–1636 Search PubMed.
- S. Zhu, Q. Meng, L. Wang, J. Zhang, Y. Song, H. Jin, K. Zhang, H. Sun, H. Wang and B. Yang, Angew. Chem., Int. Ed., 2013, 125, 4045–4049 CrossRef.
- M. T. Hill and M. C. Gather, Nat. Photonics, 2014, 8, 908–918 CrossRef CAS.
- L. Yan, Y. Yang, C.-Q. Ma, X. Liu, H. Wang and B. Xu, Carbon, 2016, 109, 598–607 CrossRef CAS.
- L. Tang, R. Ji, X. Li, G. Bai, C. P. Liu, J. Hao, J. Lin, H. Jiang, K. S. Teng, Z. Yang and S. P. Lau, ACS Nano, 2014, 8, 6312–6320 CrossRef CAS.
- H. Shen, Q. Gao, Y. Zhang, Y. Lin, Q. Lin, Z. Li, L. Chen, Z. Zeng, X. Li, Y. Jia, S. Wang, Z. Du, L. S. Li and Z. Zhang, Nat. Photonics, 2019, 13, 192–197 CrossRef CAS.
- J. Luo, X. Wang, S. Li, J. Liu, Y. Guo, G. Niu, L. Yao, Y. Fu, L. Gao, Q. Dong, C. Zhao, M. Leng, F. Ma, W. Liang, L. Wang, S. Jin, J. Han, L. Zhang, J. Etheridge, J. Wang, Y. Yan, E. H. Sargent and J. Tang, Nature, 2018, 563, 541–545 CrossRef CAS.
- Y. P. Sun, B. Zhou, Y. Lin, W. Wang, K. A. S. Fernando, P. Pathak, M. J. Meziani, B. A. Harruff, X. Wang and H. Wang, J. Am. Chem. Soc., 2006, 128, 7756–7757 CrossRef CAS.
- X. Tan, Y. Li, X. Li, S. Zhou, L. Fan and S. Yang, Chem. Commun., 2015, 51, 2544–2546 RSC.
- S. Li, S. Zhou, Y. Li, X. Li, J. Zhu, L. Fan and S. Yang, ACS Appl. Mater. Interfaces, 2015, 7, 28346–28352 CrossRef.
- F. Yuan, Y. Li, X. Li, J. Zhu, L. Fan, S. Zhou, Y. Zhang and J. Zhou, ACS Appl. Bio Mater., 2018, 1, 853–858 CrossRef CAS.
- Z. Wang, F. Yuan, X. Li, Y. Li, H. Zhong, L. Fan and S. Yang, Adv. Mater., 2017, 29, 1702910 CrossRef.
- A. B. Bourlinos, M. A. Karakassides, A. Kouloumpis, D. Gournis and E. P. Giannelis, Carbon, 2013, 61, 640–643 CrossRef CAS.
- C. Zheng, L. Huang, Q. Guo, W. Chen, W. Li and H. Wang, RSC Adv., 2018, 8, 10267–10276 RSC.
- X. Jiang, L. Zhang, S. Liu, Y. Zhang, Z. He, W. Li, F. Zhang, Y. Shi, W. Lü, Y. Li, Q. Wen, J. Li, J. Feng, S. Ruan, Y.-J. Zeng, X. Zhu, Y. Lu and H. Zhang, Adv. Opt. Mater., 2018, 6, 1800561 CrossRef.
- L. Lu, X. Tang, R. Cao, L. Wu, Z. Li, G. Jing, B. Dong, S. Lu, Y. Li, Y. Xiang, J. Li, D. Fan and H. Zhang, Adv. Opt. Mater., 2017, 5, 1700301 CrossRef.
- Y. Ge, Z. Zhu, Y. Xu, Y. Chen, S. Chen, Z. Liang, Y. Song, Y. Zou, H. Zeng, S. Xu, H. Zhang and D. Fan, Adv. Opt. Mater., 2018, 6, 1701166 CrossRef.
- Y. Zhang, C.-K. Lim, Z. Dai, G. Yu, J. W. Haus, H. Zhang and P. N. Prasad, Phys. Rep., 2019, 795, 1–51 CrossRef CAS.
- X. Jiang, A. V. Kuklin, A. Baev, Y. Ge, H. Ågren, H. Zhang and P. N. Prasad, Phys. Rep., 2020, 848, 1–58 CrossRef CAS.
- I. M. Kislyakov and C. S. Yelleswarapu, Appl. Phys. Lett., 2013, 103, 151104 CrossRef.
- S. Hu, Y. Dong, J. Yang, J. Liu and S. Cao, J. Mater. Chem., 2012, 22, 1957–1961 RSC.
- I. Papagiannouli, A. B. Bourlinos, A. Bakandritsosd and S. Couris, RSC Adv., 2014, 4, 40152–40160 RSC.
- M. Li, W. Xiang, H. Gao, J. Wang and X. Liang, Dyes Pigm., 2016, 128, 1–7 CrossRef.
- T. Yuan, T. Meng, P. He, Y. Shi, Y. Li, X. Li, L. Fan and S. Yang, J. Mater. Chem. C, 2019, 7, 6820–6835 RSC.
- Z. L. Wu, P. Zhang, M. X. Gao, C. F. Liu, W. Wang, F. Leng and C. Z. Huang, J. Mater. Chem. B, 2013, 1, 2868–2873 RSC.
- Z. Q. Xu, J. Y. Lan, J. C. Jin, P. Dong, F. L. Jiang and Y. Liu, ACS Appl. Mater. Interfaces, 2015, 7, 28346–28352 CrossRef CAS.
- H. Ding, J. S. Wei and H. M. Xiong, Nanoscale, 2014, 6, 13817–13823 RSC.
- Y. Xu, M. Wu, Y. Liu, X.-Z. Feng, X.-B. Yin, X.-W. He and Y.-K. Zhang, Chem. – Eur. J., 2013, 19, 2276–2283 CrossRef CAS.
- F. Yuan, L. Ding, Y. Li, X. Li, L. Fan, S. Zhou, D. Fang and S. Yang, Nanoscale, 2015, 7, 11727–11733 RSC.
- J. E. Wray, K. C. Liu, C. H. Chen, W. R. Garrett, M. G. Payne, R. Goedert and D. Templeton, Appl. Phys. Lett., 1994, 64, 2785–2787 CrossRef CAS.
- Z. Liu, J. Tian, Z. Guo, D. Ren, F. Du, J. Zheng and Y. Chen, Adv. Mater., 2008, 20, 511–515 CrossRef CAS.
- S. Barcikowski, A. Menéndez-Manjón and B. Chichkov, Appl. Phys. Lett., 2007, 91, 083113 CrossRef.
- Z. Xie, F. Wang and C. Liu, Adv. Mater., 2012, 24, 1716–1721 CrossRef CAS.
- C. Zheng, L. Huang, Q. Guo, W. Chen and W. Li, Opt. Laser Technol., 2018, 107, 281–290 CrossRef CAS.
Footnote |
| † Electronic supplementary information (ESI) available: Materials, instruments, synthesis, characterization and photophysical measurements. See DOI: 10.1039/d0ma00106f |
| This journal is © The Royal Society of Chemistry 2020 |

