 Open Access Article
Creative Commons Attribution 3.0 Unported Licence
Unravelling the mechanism of water sensing by the Mg2+ dihydroxy-terephthalate MOF (AEMOF-1′)†
Eleutheria
Papazoi
a,
Antigoni
Douvali
a,
Stavros A.
Diamantis
 b,
Giannis S.
Papaefstathiou
 c,
Svetlana V.
Eliseeva
 d,
Stéphane
Petoud
 d,
Antonios G.
Hatzidimitriou
b,
Theodore
Lazarides
 *b and
Manolis J.
Manos
 *a
*a
aDepartment of Chemistry, University of Ioannina, 45110, Ioannina, Greece. E-mail: emanos@cc.uoi.gr
bDepartment of Chemistry, Aristotle University of Thessaloniki, 54124 Thessaloniki, Greece. E-mail: tlazarides@chem.auth.gr
cLaboratory of Inorganic Chemistry, Department of Chemistry, National and Kapodistrian University of Athens, Panepistimiopolis, Zografou 157 71, Greece
dCentre de Biophysique Moléculaire CNRS UPR4301, Rue Charles Sadron, 45071 Orléans, France
First published on 30th September 2019
Abstract
In this contribution we build upon our previous work on the MOF [Mg(H2dhtp)(H2O)2]·DMAc (AEMOF-1·DMAc) and its activated dry version AEMOF-1′ which has been shown to exhibit excellent luminescence sensing properties towards water in organic solvents. We demonstrate through combined structural and photophysical studies that the observed changes in the fluorescence properties of AEMOF-1′ upon hydration arise from a structural transformation to the mononuclear complex [Mg(H2dhtp)(H2O)5]·H2O (H4dhtp = 2,5-dihydroxyterepthalic acid) (1). In the latter complex, excited state intramolecular proton transfer (ESIPT) is strongly favoured thereby leading to enhanced and red shifted emission in comparison to AEMOF-1·DMAc. Powder X-ray diffraction measurements confirmed that complex 1 is identical to the hydrated form of AEMOF-1·DMAc. As in the case of AEMOF-1′, the dry form of complex 1 (1′) is also an effective sensor for the determination of traces of water in tetrahydrofuran (THF). This work demonstrates that the same chromophore may exhibit very different emission properties when it exists in different chemical environments and that these transformations may be controlled and utilized in water sensing applications.
Design, System, ApplicationIn this contribution we show how a fluorophore existing in different chemical environments may display substantially different emission profiles and how these differences may be controlled and utilized for the detection of water in organic solvents such as tetrahydrofuran (THF). This is achieved by the preparation of a magnesium-based metal–organic framework consisting of a bridging ligand which may emit, following excitation into its first singlet excited state, either directly after vibrational relaxation (“normal” fluorescence) or after excited state intramolecular proton transfer (ESIPT fluorescence). We demonstrate that the presence of water in suspensions of the material in THF brings about its structural transformation to a new form where the ESIPT process is more favourable thereby leading to easily observable changes in its emission profile. This work adds to our understanding on how MOFs and coordination complexes based on ESIPT chromophores may find use in fluorescence-based water detection schemes. |
Introduction
Determination of the water content in organic solvents is essential for a wide range of industries, including those involved in the production of dry chemicals, petroleum products, pharmaceuticals and foods.1 The most common method for analysing the water content of various samples, the Karl-Fisher titration, requires special equipment and highly trained personnel. In addition, there are several interferences that may lead to incorrect data by using this analytical method.2 It is therefore important to develop alternative methods for the detection and quantification of water in organic media. The use of luminescent water sensors is an alternative simple, relatively inexpensive and reliable means for the accurate estimation of water content in organic solvents.1,3 Luminescent metal–organic frameworks (LMOFs) constitute a relatively new subclass of MOFs4 which show great potential for sensing applications since they combine the ability to selectively host various small molecules and ions in their porous networks with a property (luminescence) that is highly sensitive to environmental changes and can thereby be used as a detection tool.5 The excellent water adsorption properties shown by many MOFs6 led to the study of their luminescent counterparts as humidity sensors. The LMOF-based humidity sensors found in the literature7 can be broadly divided in two categories: (i) those based on luminescent lanthanide ions which show emission quenching upon coordination to water molecules8 and (ii) those based on the modulation of ligand-based fluorescence brought about by secondary interactions with water molecules9 (most commonly hydrogen bonding).We recently reported an alkaline earth metal ion organic framework (AEMOF), [Mg(H2dhtp)(H2O)2]·DMAc (AEMOF-1·DMAc), which has a flexible 3-D porous structure and is brightly fluorescent.9a Through a benign activation process, involving treatment of the MOF with MeOH followed by drying the MeOH-exchanged material at 60–70 °C under vacuum, we obtained a guest-free compound AEMOF-1′ with the formula [Mg(H2dhtp)(H2O)2], as estimated by analytical data. AEMOF-1′ showed an exceptional capability to rapidly and selectively detect water, even in concentrations ≤1 v/v%, in various organic solvents. The sensing process is based on the enhancement of luminescence intensity (turn-on) and red shift of emission maxima upon increase of the water content. The spectral shift was shown to be the result of fine tuning of the energetics of excited state intramolecular proton transfer (ESIPT).7,9,10 Specifically, the guest-free material is gradually transformed to a hydrated version upon addition of water in the organic solvent (e.g. THF) with the latter exhibiting stronger and red shifted fluorescence as a result of the increased favourability of the ESIPT process. However, in our initial studies we have not been able to determine the structure of the hydrated compound, which seemed to be significantly different from that of the pristine MOF according to powder X-ray diffraction (PXRD) data.9a Furthermore, no structural information could be provided for the guest-free compound due to its amorphous nature. Thus, the lack of structural data for the hydrated and guest-free compounds did not allow us to elucidate the mechanism of the remarkable water sensing by AEMOF-1′. Unravelling this mechanism could be particularly useful in the design of new luminescent materials with water sensing properties.
In this contribution, we report the synthesis, crystal structure and detailed photophysical studies of the mononuclear complex [Mg(H2dhtp)(H2O)5]·H2O (1),11 which is shown to be identical to the hydrated form of AEMOF-1. An unusual structural transformation of the amorphous dried version (1′) of compound 1 to the crystalline material AEMOF-1·DMAc is achieved at room temperature. 1′ is also shown to be a highly efficient and potentially reusable luminescence sensor for the detection of water in tetrahydrofuran (THF). In addition, we show that a coordination polymer with the formula [Mg(H2dhtp)(H2O)2] (3)12 may share some crucial structural features with the guest-free material AEMOF-1′.
All in all, these studies shed light into the mechanism of water sensing by AEMOF-1′.
Results and discussion
Synthesis, crystal structure and powder X-ray diffraction data
The hydrated form of AEMOF-1 is a crystalline compound with the formula Mg(H2dhtp)(H2O)6 (as initially determined by analytical data) that can be readily obtained by treating the pristine material AEMOF-1·DMAc with a THF/H2O mixture.9a Our initial efforts to structurally characterise Mg(H2dhtp)(H2O)6 involved immersing single crystals of AEMOF-1·DMAc in THF/H2O mixtures of various compositions. However, the conversion to the hydrated form is not single-crystal-to-single-crystal thereby leading to microcrystalline products unsuitable for single-crystal X-ray analysis. We then, directed our efforts to the preparation of Mg(H2dhtp)(H2O)6 by reacting various sources of Mg2+ ions with H4dhtp in THF/H2O under solvothermal conditions. Indeed, rod-like crystals of compound 1, suitable for X-ray diffraction, were isolated by the reaction of Mg(OAc)2·4H2O and H4dhtp in THF![[thin space (1/6-em)]](https://www.rsc.org/images/entities/char_2009.gif) :
:![[thin space (1/6-em)]](https://www.rsc.org/images/entities/char_2009.gif) H2O (9
H2O (9![[thin space (1/6-em)]](https://www.rsc.org/images/entities/char_2009.gif) :
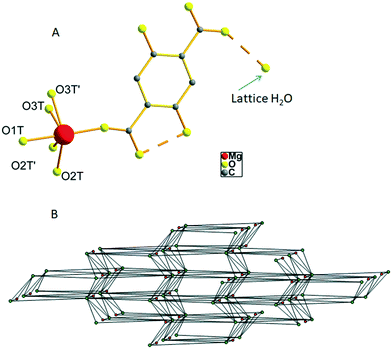
:![[thin space (1/6-em)]](https://www.rsc.org/images/entities/char_2009.gif) 1 v/v) at 80 °C (see Experimental section). Complex 1 is closely related to the compound of the formula [Mg(H2dhtp)(H2O)5]·H2O which was prepared by a different synthetic route and structurally characterized by Henkelis et al.11 Here, we provide the description of the structure of 1 along with additional details on the hydrogen bonded network and topology of the complex to aid in the discussion of its fluorescence properties (vide infra). The asymmetric unit of 1 consists of a Mg2+ ion octahedrally coordinated to one carboxylate O atom from the H2dhtp2− ligand (Fig. 1A) and five highly disordered terminal water ligands. Additionally, a lattice water molecule is involved in hydrogen bonding with the uncoordinated carboxylate group of the H2dhtp2− ligand. Complex 1 is involved in a series of intra- and intermolecular hydrogen bonds. The dimensions of the hydrogen bonds (distances and angles) are provided in Table S1 in ESI.† The intramolecular H-bonds (∼2.5 Å) formed between the –OH and COO− groups of the H2dhtp2− ligand are crucial for the luminescence properties of the compound (vide infra). The analysis of the intermolecular hydrogen bonding is not trivial, taking into account the highly disordered coordinated H2O molecules O2T, O2T′, O3T and O3T′ along with the positioning of the whole molecule on a mirror plane (all ligand atoms, the Mg atom and the O1T water molecule are situated on a mirror plane). Nevertheless, by choosing the O1T and the most symmetrically coordinated H2O molecules O2T and O3T′ and their symmetry related as the only hydrogen bond donors and acceptors, we were able to analyze the hydrogen bonded network of 1. Each [Mg(H2dhtp)(H2O)5] unit acts as a hydrogen bond donor through the five coordinated water molecules connecting to six different [Mg(H2dhtp)(H2O)5] units through eight (five unique) hydrogen bonds. Four out of the six such units complement their connection to the parent molecule by acting as hydrogen bond donors to the ligand oxygen atoms O2 and O6. The rest of the ligand oxygen atoms (O3, O4 and O5) of the parent [Mg(H2dhtp)(H2O)5] unit act as hydrogen bond acceptors bridging two additional [Mg(H2dhtp)(H2O)5] units. In this arrangement, each [Mg(H2dhtp)(H2O)5] unit serves as an eight coordinated node creating a 3D bcu network with point symbol (424·64). The solvate H2O molecule is situated within this 3D network and serves as both hydrogen bond donor bridging three different [Mg(H2dhtp)(H2O)5] units and as hydrogen bond acceptor bridging one more different [Mg(H2dhtp)(H2O)5] unit. Therefore, the solvate H2O molecule serves as a four coordinated node, while each [Mg(H2dhtp)(H2O)5] unit is hydrogen bonded to four different solvate water molecules through five (three unique) hydrogen bonds by accepting three and donating two hydrogen bonds to the four solvate H2O molecules. In effect, the overall coordination of the [Mg(H2dhtp)(H2O)5] unit increases from eight to twelve and the resulting network is a binodal (4,12)-coordinated with point symbol (33·43)(36·439·513·68) which is unique so far (Fig. 1B).
1 v/v) at 80 °C (see Experimental section). Complex 1 is closely related to the compound of the formula [Mg(H2dhtp)(H2O)5]·H2O which was prepared by a different synthetic route and structurally characterized by Henkelis et al.11 Here, we provide the description of the structure of 1 along with additional details on the hydrogen bonded network and topology of the complex to aid in the discussion of its fluorescence properties (vide infra). The asymmetric unit of 1 consists of a Mg2+ ion octahedrally coordinated to one carboxylate O atom from the H2dhtp2− ligand (Fig. 1A) and five highly disordered terminal water ligands. Additionally, a lattice water molecule is involved in hydrogen bonding with the uncoordinated carboxylate group of the H2dhtp2− ligand. Complex 1 is involved in a series of intra- and intermolecular hydrogen bonds. The dimensions of the hydrogen bonds (distances and angles) are provided in Table S1 in ESI.† The intramolecular H-bonds (∼2.5 Å) formed between the –OH and COO− groups of the H2dhtp2− ligand are crucial for the luminescence properties of the compound (vide infra). The analysis of the intermolecular hydrogen bonding is not trivial, taking into account the highly disordered coordinated H2O molecules O2T, O2T′, O3T and O3T′ along with the positioning of the whole molecule on a mirror plane (all ligand atoms, the Mg atom and the O1T water molecule are situated on a mirror plane). Nevertheless, by choosing the O1T and the most symmetrically coordinated H2O molecules O2T and O3T′ and their symmetry related as the only hydrogen bond donors and acceptors, we were able to analyze the hydrogen bonded network of 1. Each [Mg(H2dhtp)(H2O)5] unit acts as a hydrogen bond donor through the five coordinated water molecules connecting to six different [Mg(H2dhtp)(H2O)5] units through eight (five unique) hydrogen bonds. Four out of the six such units complement their connection to the parent molecule by acting as hydrogen bond donors to the ligand oxygen atoms O2 and O6. The rest of the ligand oxygen atoms (O3, O4 and O5) of the parent [Mg(H2dhtp)(H2O)5] unit act as hydrogen bond acceptors bridging two additional [Mg(H2dhtp)(H2O)5] units. In this arrangement, each [Mg(H2dhtp)(H2O)5] unit serves as an eight coordinated node creating a 3D bcu network with point symbol (424·64). The solvate H2O molecule is situated within this 3D network and serves as both hydrogen bond donor bridging three different [Mg(H2dhtp)(H2O)5] units and as hydrogen bond acceptor bridging one more different [Mg(H2dhtp)(H2O)5] unit. Therefore, the solvate H2O molecule serves as a four coordinated node, while each [Mg(H2dhtp)(H2O)5] unit is hydrogen bonded to four different solvate water molecules through five (three unique) hydrogen bonds by accepting three and donating two hydrogen bonds to the four solvate H2O molecules. In effect, the overall coordination of the [Mg(H2dhtp)(H2O)5] unit increases from eight to twelve and the resulting network is a binodal (4,12)-coordinated with point symbol (33·43)(36·439·513·68) which is unique so far (Fig. 1B).
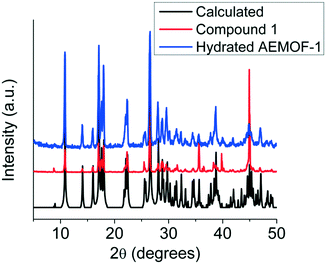
Comparing the PXRD patterns of compound 1 and the hydrated AEMOF-1 (Fig. 2), it is clear that these compounds are isostructural. The structural coincidence of these compounds is reflected on their essentially identical photophysical properties (vide infra). Furthermore, the IR spectra of these compounds are quite similar (Fig. S1 in ESI†).
The dried version of compound 1 and its structural transformations
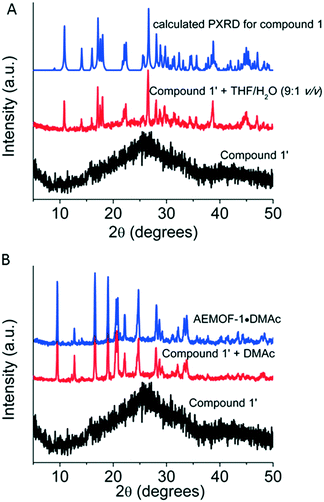
After the synthesis and structural characterization of compound 1, the next step of our investigations was to isolate the dry form of this complex. Thus, compound 1 was first treated with MeOH, a volatile and water-miscible solvent, and then, the MeOH-exchanged compound was dried under vacuum at 60–70 °C to afford the dried complex 1′. This procedure was previously followed for the isolation of AEMOF-1′.9a PXRD studies indicated that complex 1′ is amorphous (Fig. 3A). Thermogravimetric analysis (TGA) data (Fig. S2†) indicate the composition [Mg(H2dhtp)(H2O)2] for 1′, which is identical to the formula found for AEMOF-1′.9a In addition, the IR spectra of 1′ and AEMOF-1′ are indistinguishable (Fig. S3†).By treating complex 1′ with THF/H2O (9![[thin space (1/6-em)]](https://www.rsc.org/images/entities/char_2009.gif) :
:![[thin space (1/6-em)]](https://www.rsc.org/images/entities/char_2009.gif) 1 v/v) for ∼1 h, the compound 1 is fully restored according to PXRD data (Fig. 3A). More interestingly, the treatment of 1′ with DMAc (∼12 h, room temperature) resulted in the isolation of the 3D MOF AEMOF-1·DMAc, as revealed by PXRD (Fig. 3B). As we reported in our previous work, AEMOF-1′ immersed in DMAc is converted to AEMOF-1·DMAc.9a All the above reveal the close relationship between complex 1′ and AEMOF-1′.
1 v/v) for ∼1 h, the compound 1 is fully restored according to PXRD data (Fig. 3A). More interestingly, the treatment of 1′ with DMAc (∼12 h, room temperature) resulted in the isolation of the 3D MOF AEMOF-1·DMAc, as revealed by PXRD (Fig. 3B). As we reported in our previous work, AEMOF-1′ immersed in DMAc is converted to AEMOF-1·DMAc.9a All the above reveal the close relationship between complex 1′ and AEMOF-1′.
Structural transformations of compound 3
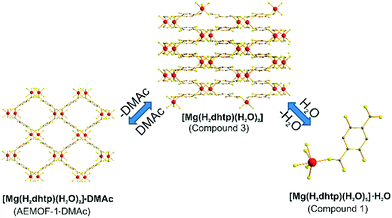
A search in the Cambridge Crystallographic Database revealed the existence of a coordination polymer (hereafter referred to as compound 3) with the same composition as those found for 1′ and AEMOF-1′.123 contains one crystallographically unique Mg2+ octahedrally coordinated by four carboxylate oxygen atoms and two terminal water ligands. The coordination environment of Mg2+ in compound 3 is thus identical to that in AEMOF-1·DMAc. The MgO6 octahedra of 3 are linked forming chains, which are interconnected resulting in a 3-D framework structure. Note that this is a dense structure containing no lattice solvents. The structures of compound 1′ and AEMOF-1′ are also dense (BET surface area for AEMOF-1′ ∼ 11 m2 g−1). Unfortunately, direct structural comparison between 1′, AEMOF-1′ and 3 is not feasible due to the amorphous nature of the first two materials. However, we should note that the IR spectrum of 1′/AEMOF-1′ shows some similarity with that of 3 (Fig. S4†). In the hope of obtaining indirect evidence for the structural relationship between these materials, we decided to check whether 3 would exhibit similar reactivity with those observed for 1′ and AEMOF-1′. Indeed, treating 3 with THF/H2O resulted in the isolation of the hydrated compound 1, as indicated by PXRD (Fig. 4). Importantly, the treatment of 3 with DMAc led to its transformation to AEMOF-1·DMAc (Fig. 4). Thus, the dense framework of 3 expands to accommodate DMAc generating the relatively open structure of AEMOF-1·DMAc. These structural transformations of compound 3 are identical to those observed for compounds 1′ and AEMOF-1′ which also converted to 1 and AEMOF-1·DMAc upon their treatment with THF/H2O and DMAc respectively. The structural transformations involved compound 3 are represented in Fig. 5. The above results provide substantial evidence that the materials 1′, AEMOF-1′ and 3 share some crucial structural features. This conclusion is further supported by the photophysical studies on compounds 1 and 3 (vide infra).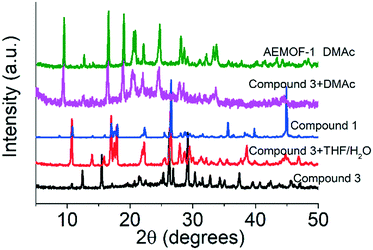 | ||
| Fig. 4 PXRD patterns of pristine compound 3, materials after the treatment of compound 3 with THF/H2O and DMAc vs. those of compound 1 and AEMOF-1·DMAc. | ||
We should also note that structural transformations involving 3-D MOFs and mononuclear compounds, as those observed for AEMOF-1·DMAc and compound 1, have been rarely reported.13
Photophysical studies
Compounds 1 and 3 were studied photophysically by solid state spectroscopic techniques in the form of microcrystalline powders.The diffuse reflectance spectrum of 1 (Fig. 6) shows a vibronically structured absorption signal between 200 and 450 nm maximising at ca. 350 nm. In agreement with our previous work,9a this signal is attributed to a ligand-based singlet π* ← π transition. Excitation of 1 at 350 nm gives rise to a broad fluorescence signal with maximum at 530 nm (Fig. 7), which agrees in both profile and intensity (quantum yield Φ = 11.5 ± 0.3%) with the spectrum recorded for the hydrated form of AEMOF-1.9a Furthermore, recording the fluorescence spectrum of 1 at temperatures as low as 10 K revealed no significant shifts in the material's emission profile (Fig. 7).
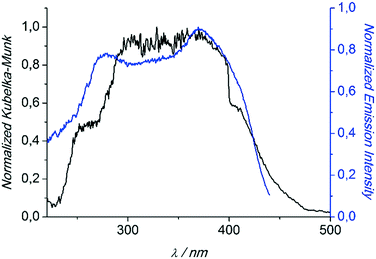 | ||
| Fig. 6 Diffuse reflectance (black) and excitation (blue) spectra of 1. The excitation spectrum was monitored at 540 nm. Both spectra are normalized to allow comparison. | ||
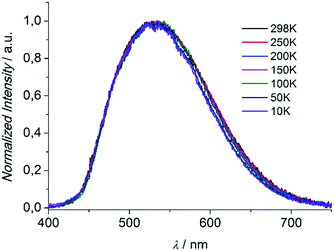 | ||
| Fig. 7 Solid state fluorescence spectra of compound 1 at different temperatures upon excitation at 350 nm. | ||
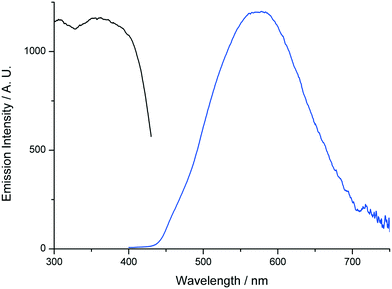
On the other hand, compound 3 shows yellow fluorescence upon illumination with a standard laboratory UV lamp (365 nm). The fluorescence spectrum of 3, upon excitation at 350 nm, consists of a broad emission signal with maximum at ca. 577 nm (Fig. 8). The excitation profile of 3 shows good agreement with that of compound 1 (Fig. 8) indicating that the fluorescence of the former arises after initial population of the same ligand-based singlet π* ← π transition (vide supra).
In agreement with the PXRD results of the previous section, the photophysical properties of 1 show excellent agreement with those of the hydrated form of AEMOF-1 (ref. 9a) thereby further confirming the structural coincidence of the two compounds. The good match between the diffuse reflectance and excitation spectra of 1 (Fig. 6) demonstrates that the emission arises after initial photo-induced population of the ligand-based 1π–π* excited levels. In our recent studies on alkaline earth MOFs based on the H2dhtp2− ligand (AEMOFs), we have demonstrated that the photophysics of these compounds can be explained on the basis of excited state intramolecular proton transfer (ESIPT) leading to enol → keto (E → K) tautomerization of the bridging ligand.14
This process is favoured due to the presence of strong intramolecular hydrogen bonds between the hydroxyl and carboxylic groups of the ligand (average O–O distance in the order of 2.5 Å). As shown in Scheme S1,† initial excitation of the ground state E form into its first singlet π* ← π excited level (E*) initiates a four-level photo-cycle (E → E* → K* → K). In the majority of AEMOFs we observe dual emission at room temperature consisting of a high-energy component attributable to E ← E* emission and a low-energy component due to K ← K* (ESIPT) emission. Lowering the temperature down to 10 K often leads to a significant red shift in the emission of AEMOFs since at these temperatures thermal excitation is not possible and the low energy ESIPT component dominates. This dual emission at room temperature is most often observed in the cases where the carboxylic oxygens which act as ESIPT acceptors are involved in coordination bonds with the “harder” alkaline earth ions (Mg2+ or Ca2+). In contrast, predominantly low-energy ESIPT emission at room temperature is observed in the cases of the “softer” alkaline earth ions (Sr2+ or Ba2+). We attributed this observation to an electrostatic inhibition of the ESIPT process induced by the positively charged alkaline earth ion bound to the ESIPT acceptor. Alkaline earth ions with greater charge density induce a more pronounced electrostatic inhibition effect to proton transfer thereby leading to a significant contribution of E ← E* emission in their room temperature fluorescence spectra.13
As mentioned above, in the case of complex 1 the emission spectrum shows no appreciable shift upon gradually lowering the temperature down to 10 K (Fig. 7). This result demonstrates that the room temperature fluorescence of 1 arises predominantly from one low-energy excited state which, given the large Stokes shift observed (ca. 160 nm), can be attributed to the excited keto form (K*) of the ligand. It is therefore possible that due to the favourability of the ESIPT process in 1, the K* state is stabilized so that thermal back transfer to the E* state is not possible even at room temperature (vide supra).
In the light of the structural characterization of 1, we may attempt to comment on the observed favourability of the ESIPT process. Close inspection of the molecular structure of 1 (Fig. 1), reveals that the carboxylic oxygens which are directly involved in the ESIPT process are not participating in coordination bonds with Mg2+ ions which would inhibit the ESIPT process (vide supra). Instead, they are only involved in hydrogen bonding with coordinated water molecules. The Mg2+ ion in 1 is coordinated to a carboxylic oxygen which is not involved in hydrogen bonding to a ligand hydroxyl group and can thereby cannot act as a proton acceptor in an ESIPT process. We therefore believe that due to this structural feature of compound 1, ESIPT process is not electrostatically inhibited and is thereby favoured to such an extent that practically only ESIPT emission is observed even at room temperature.
The yellow emission of compound 3 (Fig. 8) is significantly red shifted in comparison to that of 1 even though it arises from initial excitation of the same chromophore. This difference in the emission properties of 3 may be attributed to the presence of strong π–π stacking interactions in its structure. In 3, the aromatic rings of the H2dhtp2− units are arranged in a face-to-face manner where the distance between two successive rings is ca. 3.5 Å (Fig. S5†). At these short interchromophoric distances the formation of excimers is favoured thereby leading to significantly red shifted emission in comparison to the monomeric chromophores.15
It is worth recalling that AEMOF-1′ shows a relatively weak yellow fluorescence.9a Even though AEMOF-1′ is an amorphous material, the fact that it exhibits a fluorescence component with very similar characteristics to those of 3 may lead us to the conclusion that the removal of the guest DMAc from AEMOF-1·DMAc results in the partial collapse of the framework leading to the formation of stacked oligomers by the H2dhtp2− chromophores which give rise to the strongly red shifted component observed in the fluorescence spectrum of AEMOF-1′.9a
Luminescence water sensing
In order to further establish the relation between compounds 1′ and AEMOF-1′, we tested the water sensing performance of 1′ in THF in exactly the same way as we did for AEMOF-1′ in our previous work.9a As seen in Fig. 9, addition of aliquots of water in a suspension of 1′ in dry THF results in the gradual enhancement with concomitant slight red shift of the emission spectrum. The final emission spectrum is consistent with that observed in the case of compound 1. This behaviour is in good agreement with that observed for AEMOF-1′ and demonstrates that 1′ and AEMOF-1′ are structurally related. However, it is worth noting that 1′ shows significant changes in its emission spectrum at water concentrations above 0.25% v/v. This is in contrast to the behaviour of AEMOF-1′ which shows greater sensitivity as significant changes in its emission profile are observed at water concentrations as low as 0.05% v/v.9a Furthermore, the initial spectra of 1′ and AEMOF-1′ in pure THF differ thereby leading to the conclusion, that even though 1′ and AEMOF-1′ share the same formula (vide supra) and both convert to 1 upon hydration, they are not exactly identical.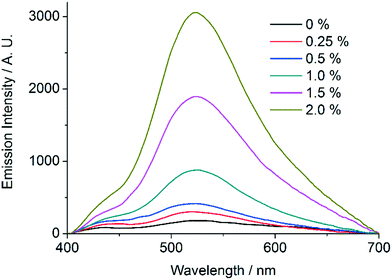 | ||
| Fig. 9 Changes in the emission spectrum (excitation at 350 nm) of a stirred suspension of 1′ in dry THF upon addition of aliquots of water. | ||
It is worth noting that, as we have demonstrated by PXRD studies (vide supra), 1 can readily be converted to 1′ by treatment with MeOH followed by gentle drying under vacuum and then back to 1 by treatment with a 9![[thin space (1/6-em)]](https://www.rsc.org/images/entities/char_2009.gif) :
:![[thin space (1/6-em)]](https://www.rsc.org/images/entities/char_2009.gif) 1 mixture of THF/H2O. Therefore 1′ shows great potential for being a reusable humidity sensor in organic media.
1 mixture of THF/H2O. Therefore 1′ shows great potential for being a reusable humidity sensor in organic media.
We also tested the water sensing properties of compound 3 under the same conditions and we found it to be relatively unresponsive at the short time intervals (2 min) of a sensing experiment. As shown above, 3 indeed converts to 1 upon reaction with water; however, much longer treatment times (several hours) are required to achieve this transformation. It is possible that the highly ordered dense structure of 3 renders this material much less prone to reaction with H2O molecules as the latter do not have access to the bulk solid and can therefore only interact with the surface of the crystallites of 3. In contrast, 1′ and AEMOF-1′ possibly due to their amorphous nature react rapidly with H2O and undergo structural transformation to 1.
Suggested mechanism for the sensing by AEMOF-1′
The activation of the pristine material AEMOF-1·DMAc leads to the formation of the amorphous AEMOF-1′ which shows much weaker fluorescence mainly because of the self-quenching induced due to the aggregation of the H2dhtp2− units. A portion of the chromophores in AEMOF-1′ may be involved in the formation of π-stacked oligomers (taking into account that AEMOF-1′ may be structurally related to compound 3 showing strong π–π stacking interactions in its structure), thereby leading to a strongly red shifted emission component. AEMOF-1′ reacts rapidly with water by undergoing structural transformation to compound 1 which displays strong green fluorescence arising from the ESIPT process. These results demonstrate that the same chromophore may demonstrate very different emission properties when it exists in different chemical environments and that these transformations may be controlled and utilized in water sensing applications.Conclusions
In this work, we have been able to identify the reason behind the water sensing properties of AEMOF-1′ through combined structural and photophysical investigations. Prior these studies, the water sensing capability of the MOF was thought to be the result of the concentration of the analyte into the pores of the material, which was expected to cause strong analyte–framework interactions and dramatic changes in the luminescence of the MOF.9a Instead, the present investigations reveal that the water sensing property arises from a structural transformation of an amorphous and weakly luminescent material AEMOF-1′ to the crystalline and strongly fluorescent mononuclear Mg2+ complex 1 featuring a monodentate H2dhtp2− and terminal water ligands. Interestingly, compound 1, being a simple mononuclear species, can be transformed to AEMOF-1·DMAc, a MOF with a 3-D open framework structure. Thus, this result, not only provides insight into the water sensing process, but also sheds some light into the mechanism of the structural assembly for AEMOF-1·DMAc.Experimental
Materials
All reagents and solvents were purchased from commercial sources and were used as received.Syntheses
The syntheses of compounds AEMOF-1·DMAc, AEMOF-1′ and hydrated AEMOF-1 are reported in ref. 9a.![[thin space (1/6-em)]](https://www.rsc.org/images/entities/char_2009.gif) :
:![[thin space (1/6-em)]](https://www.rsc.org/images/entities/char_2009.gif) 1 v/v), in a Teflon cup. The mixture was stirred for ∼5 min and then, the Teflon cup was transferred into a 23 mL Teflon-lined stainless steel autoclave. The autoclave was sealed and placed in an oven operated at 80 °C, remained undisturbed at this temperature for 20 h and then was allowed to slowly cool to room temperature. Colourless rod-like crystals of compound 1 were isolated by filtration and dried in air. Yield: 0.10 g (∼82%).
1 v/v), in a Teflon cup. The mixture was stirred for ∼5 min and then, the Teflon cup was transferred into a 23 mL Teflon-lined stainless steel autoclave. The autoclave was sealed and placed in an oven operated at 80 °C, remained undisturbed at this temperature for 20 h and then was allowed to slowly cool to room temperature. Colourless rod-like crystals of compound 1 were isolated by filtration and dried in air. Yield: 0.10 g (∼82%).
![[thin space (1/6-em)]](https://www.rsc.org/images/entities/char_2009.gif) :
:![[thin space (1/6-em)]](https://www.rsc.org/images/entities/char_2009.gif) 1 v/v) were mixed in a Teflon cup, which was then transferred into a 23 mL Teflon-lined stainless steel autoclave. The autoclave sealed and heated at 120 °C for 20 h. Yellow crystals of compound 3 were isolated by filtration and dried in the air. Yield: 0.03 g (∼47%).
1 v/v) were mixed in a Teflon cup, which was then transferred into a 23 mL Teflon-lined stainless steel autoclave. The autoclave sealed and heated at 120 °C for 20 h. Yellow crystals of compound 3 were isolated by filtration and dried in the air. Yield: 0.03 g (∼47%).
Physical measurements
Powder X-ray diffraction (PXRD) diffraction measurements were carried out on a Bruker D8 Advance X-ray diffractometer (CuKα radiation, λ = 1.5418 Å). Thermogravimetric analysis (TGA) data were recorded with a Perkin-Elmer Pyris-Diamond TGA/DTA analyzer. UV/vis diffuse reflectance spectra were obtained at room temperature on a Shimadzu 1200 PC in the wavelength range of 200–800 nm. BaSO4 powder was used as a reference (100% reflectance) and base material on which the powder sample was coated. The reflectance data were converted to absorption using the Kubelka–Munk function.Photoluminescence measurements and sensing experiments
Steady state emission and excitation spectra were measured on a Perkin Elmer LS55 fluorimeter equipped with a phosphorescence and magnetic stirring accessories. The light source was a Xe arc lamp and the detector a red sensitive Hamamatsu R928 photomultiplier tube (PMT). A PMT voltage of 775 was used for all measurements. For the water sensing experiments, 2 mg of the MOF in the form of a fine powder were suspended in 2 ml of the organic solvent and placed in a luminescence cuvette. Aliquots of water were added using a precision micropipette (0.1–10 μL range) in order to achieve the desired water concentration. Emission spectra were recorded 2 min after each addition. The system was kept in suspension by continuous stirring using the magnetic stirring accessory of the instrument. The emission spectrum after each addition was recorded three times to ensure signal stability. No change in the final emission spectrum of the MOF was observed upon stirring the suspension for at least 2 h. The water detection experiments with the free organic ligand were performed similarly to those for the MOF, with the difference that the measurements were carried out in dilute (A = 0.1 at the excitation wavelength) solutions (not suspensions) of the ligand. For collecting emission spectra at different temperatures, the samples were placed into closed-cycle He cryostat (Sumitomo SHI-950/Janis Research CCS-500/204) and excited with a xenon lamp (300 W, Oriel Instruments). The emitted light was analyzed with a high-resolution monochromator iHR320 from Horiba-Jobin-Yvon and detected with a photomultiplier tube (R928 from Hamamatsu). All spectra are corrected for the instrumental functions. Quantum yields were determined by an absolute method using a Fluorolog FL3-22 spectrofluorimeter from Horiba-Jobin-Yvon and an integration sphere (GMP SA). Each sample was measured several times under slightly different experimental conditions.Single crystal X-ray crystallography
The data collection was carried out with Bruker Apex-II CCD using graphite-monochromatized Mo Kα radiation. The data were collected at room temperature over a full sphere of reciprocal space. Cell refinement, data reduction and numerical absorption correction were carried out using X Bruker SAINT software package.16a The intensities were extracted by the program XPREP.16a The structures were solved with direct methods using SHELXS and least square refinement were done against Fobs (ref. 2) using routines from SHELXTL software.16b In order to limit the disorder of the solvent molecules in the structure of the compound, various restraints have been applied in the refinement.Conflicts of interest
There are no conflicts to declare.Acknowledgements
We thank the powder X-ray diffraction and thermal analysis units of Research Supporting Laboratories at the University of Ioannina. SVE and SP thank La Ligue Contre le Cancer and La Région Centre. S. P. also acknowledges support from Institut National de la Santé et de la Recherche Médicale (INSERM).Notes and references
- (a) W.-E. Lee, Y.-J. Jin, L.-S. Park and G. Kwak, Adv. Mater., 2012, 24, 5604 CrossRef CAS PubMed; (b) M. Q. Bai and W. R. Seitz, Talanta, 1994, 41, 993 CrossRef CAS.
- Y. Y. Liang, Anal. Chem., 1990, 62, 2504 CrossRef CAS.
- (a) Q. Deng, Y. Li, J. Wu, Y. Liu, G. Fang, S. Wang and Y. Zhang, Chem. Commun., 2012, 48, 3009 RSC; (b) Y. Ooyama, K. Uenaka, A. Matsugasako, Y. Harima and J. Ohshita, RSC Adv., 2013, 3, 23255 RSC; (c) Y. Ooyama, M. Sumomogi, T. Nagano, K. Kushimoto, K. Komaguchi, I. Imae and Y. Harima, Org. Biomol. Chem., 2011, 9, 1314 RSC; (d) J. Wu, W. Liu, J. Ge, H. Zhang and P. Wang, Chem. Soc. Rev., 2011, 40, 3483 RSC; (e) W.-H. Chen, Y. Xing and Y. Pang, Org. Lett., 2011, 13, 1362 CrossRef CAS; (f) H. Mishra, S. Maheshwary, H. B. Tripathi and N. Sathyamurthy, J. Phys. Chem. A, 2005, 109, 2746 CrossRef CAS; (g) N. Suzuki, A. Fukazawa, K. Nagura, S. Saito, H. K. Nishioka, D. Yokogawa, S. Irle and S. Yamaguchi, Angew. Chem., Int. Ed., 2014, 53, 8231 CrossRef CAS.
- M. D. Allendorf, C. A. Bauer, R. K. Bhakta and R. J. T. Houk, Chem. Soc. Rev., 2009, 38, 1330 RSC.
- (a) For recent reviews on chemical sensors based on luminescent MOFs see: W. P. Lustig, S. Mukherjee, N. D. Rudd, A. V. Desai, J. Li and S. K. Ghosh, Chem. Soc. Rev., 2017, 46, 3242 RSC; (b) L. E. Kreno, K. Leong, O. K. Farha, M. Allendorf, R. P. Van Duyne and J. T. Hupp, Chem. Rev., 2012, 112, 1105 CrossRef CAS PubMed; (c) Y. Zhang, S. Yuan, G. Day, X. Wang, X. Yang and H.-C. Zhou, Coord. Chem. Rev., 2018, 354, 28 CrossRef CAS; (d) S. A. Diamantis, A. Margariti, A. Pournara, G. S. Papaefstathiou, M. J. Manos and T. Lazarides, Inorg. Chem. Front., 2018, 5, 1493 RSC.
- (a) C. R. Wade, T. Corrales-Sanchez, T. C. Narayan and M. Dinca, Energy Environ. Sci., 2013, 6, 2172 RSC; (b) H. Furukawa, F. Gándara, Y.-B. Zhang, J. Jiang, W. L. Queen, M. R. Hudson and O. M. Yaghi, J. Am. Chem. Soc., 2014, 136, 4369 CrossRef CAS PubMed; (c) R. Plessius, R. Kromhout, A. L. Dantas Ramos, M. Ferbinteanu, M. C. Mittelmeijer-Hazeleger, R. Krishna, G. Rothenberg and S. Tanase, Chem. – Eur. J., 2014, 20, 7922 CrossRef CAS PubMed.
- Y. Guo and W. Zhao, Analyst, 2019, 144, 388 RSC.
- (a) Y. Gao, P. Jing, N. Yan, M. Hilbers, H. Zhang, G. Rothenberg and S. Tanase, Chem. Commun., 2017, 53, 4465 RSC; (b) B. Li, W. Wang, Z. Hong, E. M. El-Sayed and D. Yuan, Chem. Commun., 2019, 55, 6926 RSC.
- (a) A. Douvali, A. C. Tsipis, S. V. Eliseeva, S. Petoud, G. S. Papaefstathiou, C. D. Malliakas, I. Papadas, G. S. Armatas, I. Margiolaki, M. G. Kanatzidis, T. Lazarides and M. J. Manos, Angew. Chem., Int. Ed., 2015, 54, 1651 CrossRef CAS PubMed; (b) L. Chen, J.-W. Ye, H.-P. Wang, M. Pan, S.-Y. Yin, Z.-W. Wei, L.-Y. Zhang, K. Wu, Y.-N. Fan and C.-Y. Su, Nat. Commun., 2017, 8, 15985 CrossRef CAS PubMed.
- (a) K. Jayaramulu, P. Kanoo, S. J. George and T. K. Maji, Chem. Commun., 2010, 46, 7906 RSC; (b) V. S. Padalkar and S. Seki, Chem. Soc. Rev., 2016, 45, 169 RSC.
- (a) S. E. Henkelis, L. J. McCormic, D. B. Cordes, A. M. Z. Slawin and R. E. Morris, Inorg. Chem. Commun., 2016, 65, 21 CrossRef CAS; (b) Crystal data for compound 1: C8H14MgO11·H2O, M = 328.52, a = 10.1744(9) Å, b = 6.6857(6) Å, c = 10.4150(7) Å, β = 104.751(4)°, V = 685.11(10) Å3, T = 293(2) K, space group P21/m, Z = 2, 6964 reflections measured, 1778 independent reflections (Rint = 0.0258). The final R1 values were 0.0362 (I > 2σ(I)). The final wR(F2) values were 0.0989 (I > 2σ(I)). CCDC 1945782. As reported in the text, the structures of compound 1 and that reported in ref. 11a are closely related. However, these structures differ in cell dimensions and space group (selected crystal data for compound reported in ref. 11a: a = 10.1929(18) Å, b = 6.6410(10) Å, c = 20.729(3) Å, β = 103.663(4)°, V = 1363.5(4) Å3, space group P21/n).
- P. D. C. Dietzel, R. Blom and H. Fjellvag, Eur. J. Inorg. Chem., 2008, 3624 CrossRef CAS.
- M. Du, C. P. Li, M. Chen, Z. W. Ge, X. Wang, L. Wang and C. S. Liu, J. Am. Chem. Soc., 2014, 136, 10906 CrossRef CAS PubMed.
- A. Douvali, G. S. Papaefstathiou, M. P. Gullo, A. Barbieri, A. C. Tsipis, C. D. Malliakas, M. G. Kanatzidis, I. Papadas, G. S. Armatas, A. G. Hatzidimitriou, T. Lazarides and M. J. Manos, Inorg. Chem., 2015, 54, 5813 CrossRef CAS PubMed.
- (a) W. Cho, H. J. Lee, G. Choi, S. Choi and M. Oh, J. Am. Chem. Soc., 2014, 136(35), 12201 CrossRef CAS; (b) J. Chen, A. Neels and K. M. Fromm, Chem. Commun., 2010, 46, 8282 RSC; (c) A. Gładysiak, T. N. Nguyen, R. Bounds, A. Zacharia, G. Itskos, J. A. Reimer and K. C. Stylianou, Chem. Sci., 2019, 10, 6140 RSC; (d) R. Dalapati and S. Biswas, Inorg. Chem., 2019, 58, 5654 CrossRef CAS PubMed; (e) J. Yu, J.-H. Park, A. Van Wyk, G. Rumbles and P. Deria, J. Am. Chem. Soc., 2018, 140, 10488 CrossRef CAS PubMed.
- (a) Bruker, Apex2, Version 2, Bruker AXS Inc., Madison, Wisconsin, USA, 2006 Search PubMed; (b) G. M. Sheldrick, Acta Crystallogr., Sect. C: Struct. Chem., 2015, 71, 3 CrossRef PubMed.
Footnote |
| † Electronic supplementary information (ESI) available: TGA data for compounds 1 and 1′, dimensions of hydrogen bonds in 1 and crystallographic data for 1 in CIF electronic format. CCDC 1945782. For ESI and crystallographic data in CIF or other electronic format see DOI: 10.1039/c9me00098d |
| This journal is © The Royal Society of Chemistry 2020 |

