 Open Access Article
Methanol-induced fast CsBr release results in phase-pure CsPbBr3 perovskite nanoplatelets
Xin
Liu†
a,
Zhao
Luo†
a,
Wenxu
Yin
a,
Aleksandr P.
Litvin
 b,
Alexander V.
Baranov
 b,
Jiaqi
Zhang
a,
Wenyan
Liu
c,
Xiaoyu
Zhang
 *a and
Weitao
Zheng
 *a
*a
aKey Laboratory of Automobile Materials, Ministry of Education, College of Materials Science and Engineering, Jilin University, Changchun, 130012, P. R. China. E-mail: zhangxiaoyu@jlu.edu.cn; wtzheng@jlu.edu.cn
bCenter of Information Optical Technology, ITMO University, 49 Kronverksky Pr., St. Petersburg 197101, Russia
cCollege of Materials Science & Engineering, Beihua University, Jilin, 132013, P. R. China
First published on 23rd March 2020
Abstract
Formation of a non-emissive wide bandgap CsPb2Br5 component often accompanies the synthesis of CsPbBr3 perovskites, introducing undesired energy states and impeding the charge transport. Here, we demonstrate that a small amount of a methanol additive can promote the CsBr release rate, facilitating CsPbBr3 formation and suppressing CsPb2Br5 formation. Some of the methanol ionizes into CH5O+ and CH3O−, which act as surface ligands and change the crystallization environment, inducing shape evolution from spherical nanocrystals to rectangular nanoplatelets (NPLs), leading to monodispersed and phase-pure 8 unit-cell-thick CsPbBr3 NPLs. Meanwhile, nonradiative recombination processes are inhibited as a result of NPL surface passivation. Bright CsPbBr3 NPLs with a photoluminescence quantum yield reaching 90% were employed as emitters for electroluminescent light-emitting devices.
Introduction
Metal halide semiconductors with a perovskite crystal structure are famous for their excellent electrical and optical properties.1–5 Showing high photoluminescence (PL) quantum yields (QYs),6,7 an optimal range of band gap energy values and high defect tolerance,8–11 the perovskite nanomaterials hold great promise for solar cell,12 photodetector,13 laser,14,15 light-emitting diode (LED) and display applications.16–30 Being free from the organic component, the all inorganic CsPbX3 (X− stands for halide ions) perovskites are compositionally stable up to their melting points which are in excess of 460 °C,31 and thus have attracted enormous interest.Different from traditional covalent semiconductor nanocrystals (NCs), whose synthesis requires a high temperature to decompose the precursor,32–35 perovskite NCs can be synthesized at room temperature via a ligand assisted reprecipitation (LARP) approach,36,37 which is due to its ionic nature.38,39 By controlling the surface ligands, reaction temperature and additives, several shape variations of perovskite nanomaterials have been achieved, including NCs, nanorods, nanowires, and nanoplatelets (NPLs).40–48 However, taking CsPbBr3 as an example, even though the Cs![[thin space (1/6-em)]](https://www.rsc.org/images/entities/char_2009.gif) :
:![[thin space (1/6-em)]](https://www.rsc.org/images/entities/char_2009.gif) Pb
Pb![[thin space (1/6-em)]](https://www.rsc.org/images/entities/char_2009.gif) :
:![[thin space (1/6-em)]](https://www.rsc.org/images/entities/char_2009.gif) Br ratio is set precisely to 1
Br ratio is set precisely to 1![[thin space (1/6-em)]](https://www.rsc.org/images/entities/char_2009.gif) :
:![[thin space (1/6-em)]](https://www.rsc.org/images/entities/char_2009.gif) 1
1![[thin space (1/6-em)]](https://www.rsc.org/images/entities/char_2009.gif) :
:![[thin space (1/6-em)]](https://www.rsc.org/images/entities/char_2009.gif) 3 in the precursor, the final products are always accompanied by CsPb2Br5 impurities, which are known as non-emissive wide bandgap components.49–52 These impurities introduce undesired energy states and act as charge blockers, decreasing the charge mobility.53 We propose the nonuniform precursor release rate to be the main cause of the formation of CsPb2Br5 byproducts, and this general idea is demonstrated here. The CsBr release rate was controlled by introducing trace amounts of methanol into the LARP approach. With 600 μL of the methanol additive, the byproduct CsPb2Br5 disappeared and monodispersed 8 unit-cell-thick CsPbBr3 NPLs were obtained. With the help of oleic acid (OA) and oleylamine (OLA), the methanol was partly ionized into CH5O+ and CH3O−, which partially replaced OA and/or OLA surface ligands, inducing the formation of rectangular NPLs. Bright CsPbBr3 NPLs with a photoluminescence quantum yield (PL QY) reaching 90% were employed as emitters for electroluminescent light-emitting devices, with a peak luminance of 8347 cd m−2 and current efficiency of 13.2 cd A−1.
3 in the precursor, the final products are always accompanied by CsPb2Br5 impurities, which are known as non-emissive wide bandgap components.49–52 These impurities introduce undesired energy states and act as charge blockers, decreasing the charge mobility.53 We propose the nonuniform precursor release rate to be the main cause of the formation of CsPb2Br5 byproducts, and this general idea is demonstrated here. The CsBr release rate was controlled by introducing trace amounts of methanol into the LARP approach. With 600 μL of the methanol additive, the byproduct CsPb2Br5 disappeared and monodispersed 8 unit-cell-thick CsPbBr3 NPLs were obtained. With the help of oleic acid (OA) and oleylamine (OLA), the methanol was partly ionized into CH5O+ and CH3O−, which partially replaced OA and/or OLA surface ligands, inducing the formation of rectangular NPLs. Bright CsPbBr3 NPLs with a photoluminescence quantum yield (PL QY) reaching 90% were employed as emitters for electroluminescent light-emitting devices, with a peak luminance of 8347 cd m−2 and current efficiency of 13.2 cd A−1.
Results and discussion
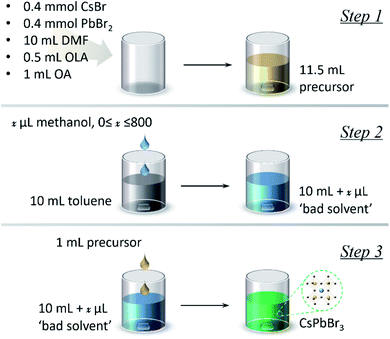
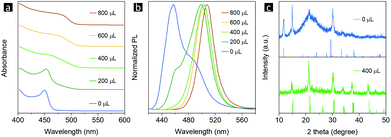
The synthesis of CsPbBr3 NPLs can be divided into three steps, as shown in Scheme 1. First, the precursor solution was prepared by mixing 0.4 mmol CsBr, 0.4 mmol PbBr2, 0.5 mL OLA, and 1 mL OA in 10 mL DMF (dimethylformamide, the “good solvent”). Then, x μL (0 ≤ x ≤ 800) methanol was added into 10 mL toluene, namely the “bad solvent”. Finally, 1 mL of the precursor solution was injected into 10 mL of the “bad solvent” to trigger supersaturation. The UV-vis absorption and PL spectra of the as-synthesized CsPbBr3 are shown in Fig. 1a and b, respectively. The absorption spectra gradually red-shift as the amount of methanol added increases from 0 to 800 μL, and the corresponding PL peaks red-shift from 460 to 507 nm. There are additional shoulders in the PL spectra for samples with 0 and 200 μL methanol, indicating that the finally products of these two samples contain several different fluorescence centers. When the amount of added methanol reaches 400 μL, the PL spectrum follows a Gaussian peak shape and the emission bandwidth decreases to 30 nm, which is consistent with typical CsPbBr3 emission, demonstrating that a mono fluorescence center exists in the sample.54 In addition, the absolute PL QY of CsPbBr3 without methanol is 50%, while it increases to 90% when 600 μL methanol is introduced. The above optical characterization results demonstrate that a suitable amount of the methanol additive can help to purify the final product and improve the PL properties.Determining the kind of impurities that have been inhibited from appearing via introducing methanol is the basis for understanding the mechanism of the methanol assisted LARP approach. X-Ray diffraction (XRD) characterization was used to address this issue. Since the PL started follow the characteristics of typical CsPbBr3 emission when the amount of methanol additive used was increased to 400 μL, this sample at the turning point was chosen to be compared with the products obtained without using methanol. As shown in Fig. 1c, an impurity CsPb2Br5 phase can be recognized besides the desired CsPbBr3 component in the product without methanol, while this impurity disappears and pure CsPbBr3 can be obtained in the sample after 400 μL methanol is added. The chemical reactions involved are given as follows:
| Cs+ + 2Pb2+ + 5Br− → CsPb2Br5 | (1) |
| Cs+ + Pb2+ + 3Br− → CsPbBr3 | (2) |
As shown, when the elemental ratio of Cs![[thin space (1/6-em)]](https://www.rsc.org/images/entities/char_2009.gif) :
:![[thin space (1/6-em)]](https://www.rsc.org/images/entities/char_2009.gif) Pb
Pb![[thin space (1/6-em)]](https://www.rsc.org/images/entities/char_2009.gif) :
:![[thin space (1/6-em)]](https://www.rsc.org/images/entities/char_2009.gif) Br is equal to 1
Br is equal to 1![[thin space (1/6-em)]](https://www.rsc.org/images/entities/char_2009.gif) :
:![[thin space (1/6-em)]](https://www.rsc.org/images/entities/char_2009.gif) 2
2![[thin space (1/6-em)]](https://www.rsc.org/images/entities/char_2009.gif) :
:![[thin space (1/6-em)]](https://www.rsc.org/images/entities/char_2009.gif) 5, the final product is CsPb2Br5, while when the elemental ratio of Cs
5, the final product is CsPb2Br5, while when the elemental ratio of Cs![[thin space (1/6-em)]](https://www.rsc.org/images/entities/char_2009.gif) :
:![[thin space (1/6-em)]](https://www.rsc.org/images/entities/char_2009.gif) Pb
Pb![[thin space (1/6-em)]](https://www.rsc.org/images/entities/char_2009.gif) :
:![[thin space (1/6-em)]](https://www.rsc.org/images/entities/char_2009.gif) Br is equal to 2
Br is equal to 2![[thin space (1/6-em)]](https://www.rsc.org/images/entities/char_2009.gif) :
:![[thin space (1/6-em)]](https://www.rsc.org/images/entities/char_2009.gif) 2
2![[thin space (1/6-em)]](https://www.rsc.org/images/entities/char_2009.gif) :
:![[thin space (1/6-em)]](https://www.rsc.org/images/entities/char_2009.gif) 6, the final product changes to CsPbBr3. Clearly, more Cs+ and Br− ions are needed to form CsPbBr3 instead of CsPb2Br5. CsBr easily dissolves in methanol to form a high concentration solution of 15 mg mL−1, and PbBr2 is insoluble in methanol, implying that methanol mainly influences the release of Cs+ and Br−.55 On comparing this with our experimental results, it can be seen that without methanol there will be excessive Pb2+ ions which leads to CsPb2Br5 and CsPbBr3 NCs with Pb-rich surfaces, and after introducing the methanol additive there will be more Cs+ and Br− ions which favours the formation of CsPbBr3 NCs with more Br− ions on the surfaces. Since lead rich surfaces have lots of electron traps while PbBr-terminated surfaces are known for fewer surface traps,25 we can deduce that the PL QY increase of NCs with the methanol additive benefits from the passivation of Pb-rich surfaces. A faster CsBr release rate induces the formation of CsPbBr3, while more Br− ions passivate uncoordinated lead atoms, together inducing the formation of phase-pure and bright CsPbBr3 perovskites.
6, the final product changes to CsPbBr3. Clearly, more Cs+ and Br− ions are needed to form CsPbBr3 instead of CsPb2Br5. CsBr easily dissolves in methanol to form a high concentration solution of 15 mg mL−1, and PbBr2 is insoluble in methanol, implying that methanol mainly influences the release of Cs+ and Br−.55 On comparing this with our experimental results, it can be seen that without methanol there will be excessive Pb2+ ions which leads to CsPb2Br5 and CsPbBr3 NCs with Pb-rich surfaces, and after introducing the methanol additive there will be more Cs+ and Br− ions which favours the formation of CsPbBr3 NCs with more Br− ions on the surfaces. Since lead rich surfaces have lots of electron traps while PbBr-terminated surfaces are known for fewer surface traps,25 we can deduce that the PL QY increase of NCs with the methanol additive benefits from the passivation of Pb-rich surfaces. A faster CsBr release rate induces the formation of CsPbBr3, while more Br− ions passivate uncoordinated lead atoms, together inducing the formation of phase-pure and bright CsPbBr3 perovskites.
However, CsPb2Br5 is known as non-emissive perovskite50 and will not change the PL of CsPbBr3. There must be other reasons causing the PL peak broadening with additional emission shoulders. Besides impurities, size and shape variation could also result in different emission colors,56,57 which is due to changes in the quantum confinement effect within CsPbBr3 and thus the bandgaps. Transmission electron microscopy (TEM) measurements were performed to confirm whether there is a size and/or shape variation. Fig. 2a and b show TEM images from different regions of the same sample without the methanol additive, revealing that this sample is a mixture of ∼2 nm spherical NCs (Fig. 2a), ∼6 nm spherical NCs and irregularly shaped NPLs (Fig. 2b). The height of the spherical NCs was determined to be app. 2 nm by atomic force microscopy (AFM, Fig. 3a), which is consistent with the TEM results. Following the size-dependent PL behavior, we can easily match the PL components with the obtained NCs or NPLs. As shown in Fig. 4, the PL spectrum of the sample without the methanol additive was fitted using Gaussian fitting. The emission peak at 455 nm originates from the ∼2 nm NCs, the emission peaks at 480 and 500 nm originate from the ∼6 nm NCs and irregularly shaped NPLs, and the emission peak at 520 nm is trap state related PL. For TEM characterization, the contrast in the image can reflect the thickness of the crystals: high contrast means thick crystals while low contrast stands for thin nanoplatelets. As shown in Fig. 2d, for the samples with 200 μL methanol, the contrast of most crystals is very low, indicating that they are thin nanoplatelets benefiting from the quantum confinement effect and exhibiting PL peaks at wavelengths less than 525 nm (corresponding to the bulk bandgap). The few high contrast crystals may contribute to the long tail of the PL spectrum at longer wavelengths. Thus, based on the PL spectrum (Fig. 1b) and the TEM images (Fig. 2c and d) of the sample using 200 μL of the methanol additive, we can observe a similar relationship between the PL components and the observed NCs and NPLs. The wide size and shape distribution is determined to be the main cause of these wide and asymmetrical PL spectra.
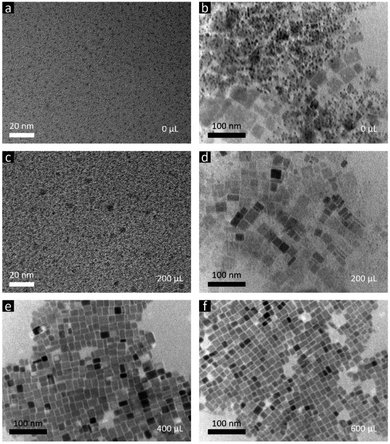 | ||
| Fig. 2 TEM images of the final products from the LARP approach using different amounts of methanol: (a) and (b) 0 μL, (c) and (d) 200 μL, (e) 400 μL, and (f) 600 μL. | ||
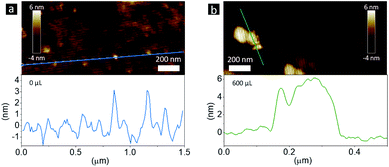 | ||
| Fig. 3 AFM images and the corresponding height analysis of samples (a) without and (b) with 600 μL of the methanol additive. | ||
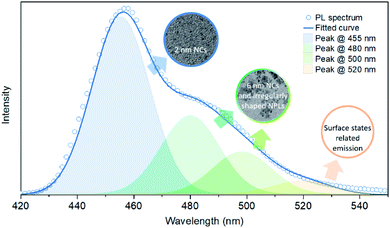 | ||
| Fig. 4 Gaussian fitting of the PL spectrum of the sample without the methanol additive, and the relationship between these PL components and the obtained NCs and NPLs. | ||
When the amount of the methanol additive reached 400 μL, the spherical NCs disappeared and only rectangular NPLs with an edge length varying from 12 to 26 nm were observed (Fig. 2e and 5). Increasing the amount of methanol to 600 μL narrowed the NPL edge length distribution to 12 to 19 nm (Fig. 2f and 5). The Bohr exciton diameter of CsPbBr3 has been determined to be 7 nm,56 which is much smaller than the NPL edge length (18.9 ± 4.7 and 15.7 ± 2.1 nm for samples using 400 and 600 μL methanol, respectively, Fig. 5). The emission maximum of bulk CsPbBr3 is located at 525 nm,58 which is red-shifted by 23 nm relative to the samples using 400 and 600 μL methanol (both at 502 nm), demonstrating a strong quantum confinement effect. Thus, the thickness of these NPLs should be less than the Bohr exciton diameter of 7 nm. That's the reason for naming them NPLs. The PL peaks of 400 and 600 μL NPLs coincide, representing similar quantum confinement effects and thus similar thicknesses. The thickness (height) of the 600 μL sample was determined to be app. 5 nm by AFM (Fig. 3b), corresponding to 8 unit-cell-thick NPLs.
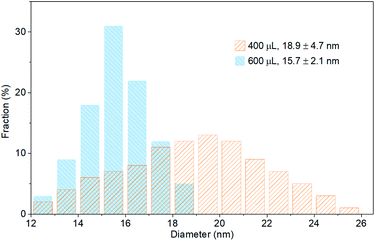 | ||
| Fig. 5 Edge length distribution histograms of CsPbBr3 NPLs synthesized with 400 and 600 μL of the methanol additive. | ||
The possible growth process of CsPbBr3 NPLs with or without the presence of traces of methanol is shown schematically in Scheme 2. Without methanol, ultrasmall 2 nm spherical NCs form first. Some of these ultrasmall particles aggregate together to form 6 nm spherical NCs and irregular NPLs due to the large surface to volume ratio of the 2 nm NCs and insufficient number of ligands, while the others interact with Pb2+ and Br− ions to form CsPb2Br5 due to the lack of Cs+ ions. After introducing methanol, the Cs+ and Br− release rate is promoted. More Cs+ and Br− ions induce the formation of CsPbBr3, while more Br− ions passivate uncoordinated lead atoms, together inducing the formation of phase-pure and bright CsPbBr3 NPLs. The absolute PL QY and the PL peak's full-width at half-maximum (FWHM) as functions of the methanol volume are summarized in Fig. 6a. With the increasing amount of methanol from 0 to 600 μL, the FWHM decreases from 40 to 27 nm, and the PL QY increases from 50% to 90%, which is due to the increased number of Br− ions passivating the NC surfaces during crystallization. The PL QY decreases to 75% when the methanol additive is increased to 800 μL, due to the decomposition of CsPbBr3 perovskites by excessive methanol. The brightest sample with 600 μL of the methanol additive was chosen to investigate the electron–hole recombination mechanisms. The time-resolved PL decay (TRPL) of the as-prepared CsPbBr3 without and with 600 μL methanol is presented in Fig. 6b. The decay fitting results are listed in Fig. 6c. The short lifetime component (10.2 and 18.0 ns for samples with 0 and 600 μL methanol, respectively) originates from the exciton radiative recombination, whereas the long-lived component (55.3 and 76.1 ns for samples with 0 and 600 μL methanol, respectively) is consistent with delayed PL caused by surface traps. Clearly, the relative ratio of amplitude (f1) of τ1 to that (f2) of τ2 increased obviously with the methanol additive (more Br− ions during crystallization), indicating that some of the surface traps have been modified. As for the shape evolution from spherical NCs to rectangular NPLs after introducing methanol, it is supposed to be related to the changed crystallization environment. Typically, the high-energy facets grow faster than the low-energy facets during perovskite crystallization, and the surface energy of certain facets can be lowered by binding with surface ligands. Indeed, it has been well documented in the literature that NPLs could be obtained via introducing short ligands, like pyridine, octanoic acid and octylamine.43,44,59 In our case, with the help of OA− and OLA+, some of the methanol can ionize into CH5O+ and CH3O−, which act as surface ligands and change the crystallization environment,58,60 inducing shape evolution from spherical nanocrystals to rectangular NPLs.
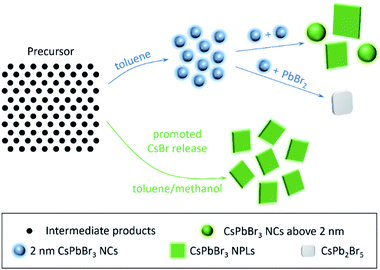 | ||
| Scheme 2 Schematic representation of the LARP approach carried out with or without the presence of traces of methanol. | ||
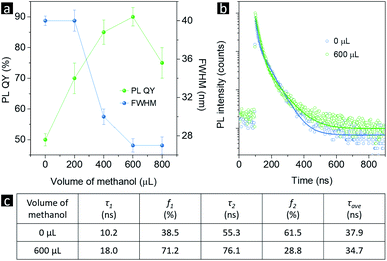 | ||
| Fig. 6 (a) PL QY and FWHM values as functions of methanol volume. (b) TRPL curves and (c) the corresponding fitting results of samples without and with 600 μL of the methanol additive. | ||
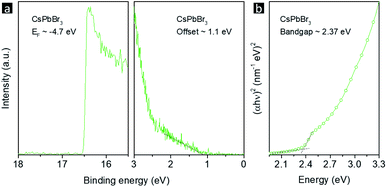
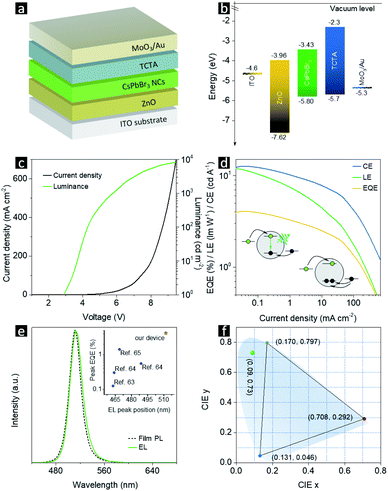
The CsPbBr3 NPLs with the highest PL QY were chosen as emitters for electroluminescence (EL) light-emitting diodes (LEDs). Ultraviolet photoelectron spectroscopy (UPS) measurements (Fig. 7a) were performed on CsPbBr3 NPL films in order to map the valence band maximum (VBM) and the conduction band minimum (CBM). The Tauc plot of a CsPbBr3 NPL film on a quartz substrate (Fig. 7b) exhibits a bandgap of 2.37 eV. Thus, the VBM and CBM values for CsPbBr3 NPLs are determined to be −5.80 and −3.43 eV, respectively. A schematic of the CsPbBr3 NPL LED device structure used in this study is shown in Fig. 8a. The device energy band diagram for all functional layers is given in Fig. 8b. The LED comprised a layer of CsPbBr3 NPLs deposited on top of an ITO/ZnO substrate with a top 4,4,4′′-tris(carbazol-9-yl)triphenylamine (TCTA)/MoO3/Au electrode. The wide bandgap ZnO is famous for its high electron mobility, excellent optical transparency and deep lying VBM, and thus was chosen as the electron transport layer and the hole blocking layer.61 TCTA has a HOMO (highest occupied molecular orbital) close to the VBM of CsPbBr3 NPLs, and a low lying LUMO (lowest unoccupied molecular orbital) to block the electrons, and thus was chosen as the hole transport material.62 A peak luminance of 8347 cd m−2 (Fig. 8c), a peak external quantum efficiency (EQE) of 4.2%, a peak current efficiency (CE) of 13.2 cd A−1, and a peak power efficiency (LE) of 12.3 lm W−1 were achieved (Fig. 8d). The EQE dropped to half of its initial value at 30 mA cm−2, showing a high efficiency “roll-off”. Unbalanced charge injection is the main cause for this. The electron injection barrier from ZnO to CsPbBr3 NPLs is 0.53 eV, which is 0.43 eV larger than the hole injection barrier from TCTA to the emitters. At low current density, only limited amounts of charges can be transported to the emitters and the electrons would efficiently recombine with holes accompanied by emitting photons. At high current density, due to the smaller hole injection barrier, there will be more holes than electrons injected into the emissive layer, which leads to charged emitters that cannot emit photons any more. The schematic representation of these processes is shown in the inset of Fig. 8d. A bright EL solely from CsPbBr3 NPLs peaking at 512 nm was observed, which matched the device PL except for a 2 nm increase in the FWHM (Fig. 8e). The CIE 1931 color coordinates of (0.09, 0.73) corresponding to the CsPbBr3 NPL LED are shown in Fig. 8f, which is close to the Rec. 2020 standard. A summary of the emission peaks and EQE values of LEDs employing CsPbBr3 NPLs is given in the inset of Fig. 8e. The emission peak of our NPL LED is located at the longest wavelength, which means narrower bandgaps and thus easier charge injection. This may be the reason why our device EQE is higher than that of the others.63–65
Conclusions
In summary, we have explored the mechanism of the methanol-assisted LARP approach using lead bromide perovskite NCs as an example and have revealed how a suitable minor amount of a methanol additive leads to bright, monodispersed and phase-pure 8 unit-cell-thick CsPbBr3 NPLs. It is the difference of the solubility in methanol between CsBr and PbBr2 that determines the chemical reaction path: without methanol there is only a limited number of Cs+ and Br− ions participating in the reaction leading to formation of CsPbBr3 accompanied by CsPb2Br5, while a suitable minor amount of the methanol additive promotes the CsBr release rate, resulting in phase-pure CsPbBr3. The methanol additive can partly ionize into CH5O+ and CH3O−, which act as surface ligands partially replacing OLA+ and OA−, inducing shape evolution from spherical NCs to rectangular NPLs. The NPLs using 600 μL methanol exhibit a high PL QY of 90% and were employed as emitters resulting in bright LEDs with a peak brightness of 8347 cd m−2. Our study demonstrated that a suitable polar solvent can activate the precursor leading to perovskite crystal growth control, providing new insights into phase- and shape-control over perovskite nanomaterials.Experimental
Materials
Oleic acid (OA, 90%) was purchased from Alfa Aesar. Oleylamine (OLA, 80–90%), CsBr (99.9%), and PbBr2 (99.0%) were purchased from Aladdin. Methanol (≥99.9%) and dimethylformamide (DMF, 99.8%) were obtained from Sigma-Aldrich. TCTA (4,4,4′′-tris(carbazol-9-yl)triphenylamine, 99%) was bought from jl-OLED.Syntheses
As illustrated in Scheme 1, the synthesis of CsPbBr3 NCs was carried out at room temperature by the LARP approach, through injection of 1 mL of the precursor mixture (which we denote using a generic term “precursor” hereafter) into a “bad solvent”, toluene (10 mL) under vigorous stirring. The precursor was prepared by mixing CsBr (0.4 mmol), PbBr2 (0.4 mmol), oleylamine (OLA, 0.5 mL), and oleic acid (OA, 1 mL) in a “good solvent”, DMF (10 mL). Then, x μL (0 ≤ x ≤ 800) methanol was added into 10 mL toluene, namely the “bad solvent”. In the end, 1 mL of the precursor solution was injected into 10 mL of the “bad solvent” to trigger supersaturation. Both the solvents, DMF and toluene, were dried to remove any remaining traces of water prior to use (DMF by adding KnNa12−n[(AlO2)12(SiO2)12] and toluene via distillation).LED fabrication
Patterned ITO-coated glass was carefully cleaned successively using soap, deionized water, ethanol, chloroform, acetone, and isopropanol and was subjected to UV-ozone treatment for 15 min. A solution of ZnO NCs was spin-coated onto the ITO glass at 1000 rpm for 1 min and annealed in air at 150 °C for 10 min. The CsPbBr3 NPL active layers were spin-cast at 1000 rpm for 1 min. 4,4′,4′′-tris(carbazol-9-yl)-triphenylamine (TCTA), MoO3, and Au films were sequentially deposited by thermal evaporation in a vacuum deposition chamber (1 × 10⁻⁷ Torr).Characterization
Absorption and photoluminescence (PL) spectra were measured on a PerkinElmer Lambda 950 spectrometer and a Cary Eclipse spectrofluorimeter, respectively. Transmission electron microscopy (TEM) images were obtained on a FEI Tecnai F20 microscope. Powder XRD data were collected on a Bruker SMART-CCD diffractometer. The absolute PL QYs of the samples were measured on a fluorescence spectrometer (FLS920P, Edinburgh Instruments) equipped with an integrating sphere with its inner face coated with BENFLEC. Time-resolved PL measurements were performed with the time correlated single-photon counting (TCSPC) system of an FLS920P Edinburgh spectrometer. A 379 nm picosecond diode laser (EPL-375, repetition rate 5 MHz, 64.8 ps) was used to excite the samples. Ultraviolet photoelectron spectroscopy (UPS) spectra were collected on a PREVAC system. The electroluminescence spectra and the current density–luminance–voltage characteristics of LEDs were measured using a Keithley 2400 sourcemeter and a PR-670 SpectraScan Colorimeter.Conflicts of interest
There are no conflicts to declare.Acknowledgements
The authors acknowledge the financial support from the National Natural Science Foundation of China (No. 51702115, 51972136, and 61604003), the China Postdoctoral Science Foundation Funded Project (2019M661206), and the Fundamental Research Funds for the Central Universities (JLU, 1018320194002 and 2019JCXK-31). X. Liu and Z. Luo contributed equally to this work.Notes and references
- F. Huang, M. Li, P. Siffalovic, G. Cao and J. Tian, Energy Environ. Sci., 2019, 12, 518–549 RSC.
- Q. Zhao, A. Hazarika, X. Chen, S. P. Harvey, B. W. Larson, G. R. Teeter, J. Liu, T. Song, C. Xiao, L. Shaw, M. Zhang, G. Li, M. C. Beard and J. M. Luther, Nat. Commun., 2019, 10, 2842 CrossRef PubMed.
- H. Utzat, W. Sun, A. E. K. Kaplan, F. Krieg, M. Ginterseder, B. Spokoyny, N. D. Klein, K. E. Shulenberger, C. F. Perkinson, M. V. Kovalenko and M. G. Bawendi, Science, 2019, 363, 1068–1072 CrossRef CAS PubMed.
- F. Wang, S. Bai, W. Tress, A. Hagfeldt and F. Gao, npj Flexible Electron., 2018, 2, 22 CrossRef.
- X. Zhang, Q. Zeng, Y. Xiong, T. Ji, C. Wang, X. Shen, M. Lu, H. Wang, S. Wen, Y. Zhang, X. Yang, X. Ge, W. Zhang, A. P. Litvin, A. V. Baranov, D. Yao, H. Zhang, B. Yang, A. L. Rogach and W. Zheng, Adv. Funct. Mater., 2020, 30, 1910530 CrossRef CAS.
- F. Krieg, S. T. Ochsenbein, S. Yakunin, S. ten Brinck, P. Aellen, A. Süess, B. Clerc, D. Guggisberg, O. Nazarenko, Y. Shynkarenko, S. Kumar, C.-J. Shih, I. Infante and M. V. Kovalenko, ACS Energy Lett., 2018, 3, 641–646 CrossRef CAS PubMed.
- D. Yang, X. Li, W. Zhou, S. Zhang, C. Meng, Y. Wu, Y. Wang and H. Zeng, Adv. Mater., 2019, 31, 1900767 CrossRef PubMed.
- Y. Zu, J. Xi, L. Li, J. Dai, S. Wang, F. Yun, B. Jiao, H. Dong, X. Hou and Z. Wu, ACS Appl. Mater. Interfaces, 2020, 12, 2835–2841 CrossRef CAS PubMed.
- D. Luo, R. Su, W. Zhang, Q. Gong and R. Zhu, Nat. Rev. Mater., 2020, 5, 44–60 CrossRef CAS.
- T. Xuan, J. Huang, H. Liu, S. Lou, L. Cao, W. Gan, R.-S. Liu and J. Wang, Chem. Mater., 2019, 31, 1042–1047 CrossRef CAS.
- Q. Zeng, X. Zhang, C. Liu, T. Feng, Z. Chen, W. Zhang, W. Zheng, H. Zhang and B. Yang, Sol. RRL, 2019, 3, 1800239 CrossRef.
- H. Wang, S. Cao, B. Yang, H. Li, M. Wang, X. Hu, K. Sun and Z. Zang, Sol. RRL, 2020, 4, 1900363 CrossRef CAS.
- C. Han, C. Li, Z. Zang, M. Wang, K. Sun, X. Tang and J. Du, Photonics Res., 2017, 5, 473–480 CrossRef CAS.
- C. Li, Z. Zang, C. Han, Z. Hu, X. Tang, J. Du, Y. Leng and K. Sun, Nano Energy, 2017, 40, 195–202 CrossRef CAS.
- C. Li, Z. Zang, W. Chen, Z. Hu, X. Tang, W. Hu, K. Sun, X. Liu and W. Chen, Opt. Express, 2016, 24, 15071–15078 CrossRef CAS PubMed.
- Y.-F. Li, S.-Y. Chou, P. Huang, C. Xiao, X. Liu, Y. Xie, F. Zhao, Y. Huang, J. Feng, H. Zhong, H.-B. Sun and Q. Pei, Adv. Mater., 2019, 31, 1807516 CrossRef PubMed.
- X. Ling, S. Zhou, J. Yuan, J. Shi, Y. Qian, B. W. Larson, Q. Zhao, C. Qin, F. Li, G. Shi, C. Stewart, J. Hu, X. Zhang, J. M. Luther, S. Duhm and W. Ma, Adv. Energy Mater., 2019, 9, 1900721 CrossRef.
- J. Yuan, C. Bi, S. Wang, R. Guo, T. Shen, L. Zhang and J. Tian, Adv. Funct. Mater., 2019, 29, 1906615 CrossRef CAS.
- K. Abdel-Latif, R. W. Epps, C. B. Kerr, C. M. Papa, F. N. Castellano and M. Abolhasani, Adv. Funct. Mater., 2019, 29, 1900712 CrossRef.
- Q. Khan, A. Subramanian, G. Yu, K. Maaz, D. Li, R. U. R. Sagar, K. Chen, W. Lei, B. Shabbir and Y. Zhang, Nanoscale, 2019, 11, 5021–5029 RSC.
- J. Xue, R. Wang, L. Chen, S. Nuryyeva, T.-H. Han, T. Huang, S. Tan, J. Zhu, M. Wang, Z.-K. Wang, C. Zhang, J.-W. Lee and Y. Yang, Adv. Mater., 2019, 31, 1900111 CrossRef PubMed.
- X. Zhang, C. Sun, Y. Zhang, H. Wu, C. Ji, Y. Chuai, P. Wang, S. Wen, C. Zhang and W. W. Yu, J. Phys. Chem. Lett., 2016, 7, 4602–4610 CrossRef CAS PubMed.
- M. Xiao, M. Hao, M. Lyu, E. G. Moore, C. Zhang, B. Luo, J. Hou, J. Lipton-Duffin and L. Wang, Adv. Funct. Mater., 2019, 29, 1905683 CrossRef CAS.
- X. Zhang, M. Lu, Y. Zhang, H. Wu, X. Shen, W. Zhang, W. Zheng, V. L. Colvin and W. W. Yu, ACS Cent. Sci., 2018, 4, 1352–1359 CrossRef CAS PubMed.
- S. Wang, C. Bi, J. Yuan, L. Zhang and J. Tian, ACS Energy Lett., 2018, 3, 245–251 CrossRef CAS.
- H. Wang, X. Zhang, Q. Wu, F. Cao, D. Yang, Y. Shang, Z. Ning, W. Zhang, W. Zheng, Y. Yan, S. V. Kershaw, L. Zhang, A. L. Rogach and X. Yang, Nat. Commun., 2019, 10, 665 CrossRef CAS PubMed.
- J. Wu, J. Tong, Y. Gao, A. Wang, T. Zhang, H. Tan, S. Nie and Z. Deng, Angew. Chem., Int. Ed., 2020 DOI:10.1002/anie.201911638.
- D. Yan, T. Shi, Z. Zang, T. Zhou, Z. Liu, Z. Zhang, J. Du, Y. Leng and X. Tang, Small, 2019, 15, 1901173 CrossRef PubMed.
- H. Guan, S. Zhao, H. Wang, D. Yan, M. Wang and Z. Zang, Nano Energy, 2020, 67, 104279 CrossRef.
- X. Tang, W. Chen, Z. Liu, J. Du, Z. Yao, Y. Huang, C. Chen, Z. Yang, T. Shi, W. Hu, Z. Zang, Y. Chen and Y. Leng, Small, 2019, 15, 1900484 CrossRef PubMed.
- Q. Zeng, X. Zhang, X. Feng, S. Lu, Z. Chen, X. Yong, S. A. T. Redfern, H. Wei, H. Wang, H. Shen, W. Zhang, W. Zheng, H. Zhang, J. S. Tse and B. Yang, Adv. Mater., 2018, 30, 1705393 CrossRef PubMed.
- R. P. Sabatini, G. Bappi, K. T. Bicanic, F. Fan, S. Hoogland, M. I. Saidaminov, L. K. Sagar, O. Voznyy and E. H. Sargent, ACS Nano, 2019, 13, 8970–8976 CrossRef CAS PubMed.
- A. Fuhr, H. J. Yun, S. A. Crooker and V. I. Klimov, ACS Nano, 2020, 14, 2212–2223 CrossRef CAS PubMed.
- Y. Kim, J. H. Chang, H. Choi, Y.-H. Kim, W. K. Bae and S. Jeong, Chem. Sci., 2020, 11, 913–922 RSC.
- I. D. Skurlov, I. G. Korzhenevskii, A. S. Mudrak, A. Dubavik, S. A. Cherevkov, P. S. Parfenov, X. Zhang, A. V. Fedorov, A. P. Litvin and A. V. Baranov, Materials, 2019, 12, 3219 CrossRef PubMed.
- X. Li, Y. Wu, S. Zhang, B. Cai, Y. Gu, J. Song and H. Zeng, Adv. Funct. Mater., 2016, 26, 2435–2445 CrossRef CAS.
- F. Zhang, H. Zhong, C. Chen, X.-g. Wu, X. Hu, H. Huang, J. Han, B. Zou and Y. Dong, ACS Nano, 2015, 9, 4533–4542 CrossRef CAS PubMed.
- S.-T. Ha, R. Su, J. Xing, Q. Zhang and Q. Xiong, Chem. Sci., 2017, 8, 2522–2536 RSC.
- G. Grancini, V. D'Innocenzo, E. R. Dohner, N. Martino, A. R. Srimath Kandada, E. Mosconi, F. De Angelis, H. I. Karunadasa, E. T. Hoke and A. Petrozza, Chem. Sci., 2015, 6, 7305–7310 RSC.
- H. Huang, B. Chen, Z. Wang, T. F. Hung, A. S. Susha, H. Zhong and A. L. Rogach, Chem. Sci., 2016, 7, 5699–5703 RSC.
- M. Sygletou, M.-E. Kyriazi, A. G. Kanaras and E. Stratakis, Chem. Sci., 2018, 9, 8121–8126 RSC.
- M. E. F. Bouduban, A. Burgos-Caminal, R. Ossola, J. Teuscher and J.-E. Moser, Chem. Sci., 2017, 8, 4371–4380 RSC.
- S. Sun, D. Yuan, Y. Xu, A. Wang and Z. Deng, ACS Nano, 2016, 10, 3648–3657 CrossRef CAS PubMed.
- A. Pan, B. He, X. Fan, Z. Liu, J. J. Urban, A. P. Alivisatos, L. He and Y. Liu, ACS Nano, 2016, 10, 7943–7954 CrossRef CAS PubMed.
- A. Chakrabarty, S. Satija, U. Gangwar and S. Sapra, Chem. Mater., 2020, 32, 721–733 CrossRef CAS.
- Y. Li, H. Huang, Y. Xiong, A. F. Richter, S. V. Kershaw, J. Feldmann and A. L. Rogach, ACS Nano, 2019, 13, 8237–8245 CrossRef CAS PubMed.
- J. Shamsi, Z. Dang, P. Bianchini, C. Canale, F. Di Stasio, R. Brescia, M. Prato and L. Manna, J. Am. Chem. Soc., 2016, 138, 7240–7243 CrossRef CAS PubMed.
- A. Dutta, R. K. Behera and N. Pradhan, ACS Energy Lett., 2019, 4, 926–932 CrossRef CAS.
- S. K. Balakrishnan and P. V. Kamat, Chem. Mater., 2018, 30, 74–78 CrossRef CAS.
- G. Li, H. Wang, Z. Zhu, Y. Chang, T. Zhang, Z. Song and Y. Jiang, Chem. Commun., 2016, 52, 11296–11299 RSC.
- Z. Zhang, Y. Zhu, W. Wang, W. Zheng, R. Lin and F. Huang, J. Mater. Chem. C, 2018, 6, 446–451 RSC.
- P. Acharyya, P. Pal, P. K. Samanta, A. Sarkar, S. K. Pati and K. Biswas, Nanoscale, 2019, 11, 4001–4007 RSC.
- I. Dursun, M. De Bastiani, B. Turedi, B. Alamer, A. Shkurenko, J. Yin, A. M. El-Zohry, I. Gereige, A. AlSaggaf, O. F. Mohammed, M. Eddaoudi and O. M. Bakr, ChemSusChem, 2017, 10, 3746–3749 CrossRef CAS PubMed.
- H. Yuan, E. Debroye, G. Caliandro, K. P. F. Janssen, J. van Loon, C. E. A. Kirschhock, J. A. Martens, J. Hofkens and M. B. J. Roeffaers, ACS Omega, 2016, 1, 148–159 CrossRef CAS PubMed.
- B. Parida, J. Ryu, S. Yoon, S. Lee, Y. Seo, J. S. Cho and D.-W. Kang, J. Mater. Chem. A, 2019, 7, 18488–18498 RSC.
- L. Protesescu, S. Yakunin, M. I. Bodnarchuk, F. Krieg, R. Caputo, C. H. Hendon, R. X. Yang, A. Walsh and M. V. Kovalenko, Nano Lett., 2015, 15, 3692–3696 CrossRef CAS PubMed.
- A. Swarnkar, A. R. Marshall, E. M. Sanehira, B. D. Chernomordik, D. T. Moore, J. A. Christians, T. Chakrabarti and J. M. Luther, Science, 2016, 354, 92–95 CrossRef CAS PubMed.
- X. Zhang, X. Bai, H. Wu, X. Zhang, C. Sun, Y. Zhang, W. Zhang, W. Zheng, W. W. Yu and A. L. Rogach, Angew. Chem., Int. Ed., 2018, 57, 3337–3342 CrossRef CAS PubMed.
- G. H. Ahmed, J. Yin, R. Bose, L. Sinatra, E. Alarousu, E. Yengel, N. M. AlYami, M. I. Saidaminov, Y. Zhang, M. N. Hedhili, O. M. Bakr, J.-L. Brédas and O. F. Mohammed, Chem. Mater., 2017, 29, 4393–4400 CrossRef CAS.
- H. Huang, J. Raith, S. V. Kershaw, S. Kalytchuk, O. Tomanec, L. Jing, A. S. Susha, R. Zboril and A. L. Rogach, Nat. Commun., 2017, 8, 996 CrossRef PubMed.
- X. Zhang, Y. Zhang, L. Yan, C. Ji, H. Wu, Y. Wang, P. Wang, T. Zhang, Y. Wang, T. Cui, J. Zhao and W. W. Yu, J. Mater. Chem. A, 2015, 3, 8501–8507 RSC.
- M. Lu, X. Zhang, X. Bai, H. Wu, X. Shen, Y. Zhang, W. Zhang, W. Zheng, H. Song, W. W. Yu and A. L. Rogach, ACS Energy Lett., 2018, 3, 1571–1577 CrossRef CAS PubMed.
- Y. Wu, C. Wei, X. Li, Y. Li, S. Qiu, W. Shen, B. Cai, Z. Sun, D. Yang, Z. Deng and H. Zeng, ACS Energy Lett., 2018, 3, 2030–2037 CrossRef CAS.
- R. L. Z. Hoye, M.-L. Lai, M. Anaya, Y. Tong, K. Gałkowski, T. Doherty, W. Li, T. N. Huq, S. Mackowski, L. Polavarapu, J. Feldmann, J. L. MacManus-Driscoll, R. H. Friend, A. S. Urban and S. D. Stranks, ACS Energy Lett., 2019, 4, 1181–1188 CrossRef CAS PubMed.
- C. Zhang, Q. Wan, B. Wang, W. Zheng, M. Liu, Q. Zhang, L. Kong and L. Li, J. Phys. Chem. B, 2019, 123, 26161–26169 CAS.
Footnote |
| † X. Liu and Z. Luo contributed equally to this work. |
| This journal is © The Royal Society of Chemistry 2020 |

