 Open Access Article
Localized surface plasmon resonance of Au/TiO2(110): substrate and size influence from in situ optical and structural investigation
Y.
Soldo-Olivier
 *a,
A.
Abisset
a,
A.
Bailly
 a,
M.
De Santis
 a,
S.
Garaudée
a,
J.
Lacipière
a,
A.
Coati
b,
Y.
Garreau
c and
M.-C.
Saint-Lager
a
a,
S.
Garaudée
a,
J.
Lacipière
a,
A.
Coati
b,
Y.
Garreau
c and
M.-C.
Saint-Lager
a
aInstitut Néel, CNRS, Université Grenoble Alpes et Grenoble INP, 25 Avenue des Martyrs, Grenoble, France. E-mail: yvonne.soldo@neel.cnrs.fr
bSynchrotron SOLEIL, L'Orme des Merisiers, Saint-Aubin, BP 48, 91192 Gif sur Yvette Cedex, France
cUniversité de Paris, Laboratoire Matériaux et Phénomènes Quantiques, CNRS, F-75013, Paris, France
First published on 7th May 2020
Abstract
Localized Surface Plasmon Resonance (LSPR) of noble metal nanoparticles has attracted a lot of attention in recent years as enhancer of the photocatalytic activity in the visible light domain. Rare are the experimental in situ studies, coupling structural and optical responses, but they are mandatory for a deep understanding of the mechanisms underlying LSPR. Herein we present an in situ investigation during the growth of gold nanoparticles (NPs) on TiO2(110) in the 2–6 nm size range. We probed the structural and morphological properties of the supported nanoparticles by performing GIXRD and GISAXS simultaneously with their optical response in p and s polarizations recorded by SDRS. The rutile surface state turns out to have a major effect on the Au NPs growth and on their plasmonic response, both in frequency and vibration modes. The roughening of the TiO2(110) surface weakens the interaction strength between the NPs and the substrate, favoring the growth of textured in-plane randomly orientated NPs. Compared to the epitaxial clusters growing on the flat TiO2 surface, these textured NPs are characterized by a LSPR blue shift and by the presence of LSPR vibration modes perpendicular to the surface for sizes smaller than about 4 nm.
1. Introduction
Solar radiation represents a clean and inexhaustible source of energy. Taking advantage of it is a key challenge, expected to give rise to large improvements in numerous fields, such as photochemistry and photocatalysis. Semi-conductors (SC) have been intensively studied due to their capacity to absorb photons and create active electrons and holes able to initiate reduction or oxidation of chemicals. Unfortunately, the response of the most active SC materials is restricted to the ultra-violet (UV) range and is unsatisfactory in the visible-light (VIS) domain, limiting the possibility to efficiently use sunlight (∼5% UV, ∼45% VIS, ∼50% infrared). Several ways have been explored in the last decades in order to overcome these difficulties, like organic-dye molecules and cationic or anionic doping.A new promising approach has recently emerged, taking advantage of the unique ability of noble metal nanoparticles (NPs), like Au, Ag and Cu, to absorb light at specific wavelengths across the visible part of the electromagnetic spectrum. This property is due to the excitation of collective electronic oscillations by a definite photon energy, known as localized surface plasmon resonance (LSPR).
It has been very recently shown that noble metal NPs supported on a semiconductor photocatalyst can allow a strong enhancement of the photo-reactivity, in particular under VIS light.1–3 LSPR characteristics and catalytic activity strongly depend on the surrounding medium, the size and the shape of the NPs. Nevertheless, the mechanisms underlying this plasmons-induced catalytic enhancement are not well understood. A full comprehension of LSPR is hence a mandatory step for the design of more efficient nanomaterials.
In this context, gold NPs turn out to be a particularly interesting system4 since they not only exhibit plasmon resonances in the visible range, but also extraordinary catalytic properties towards various redox chemical reactions even at room temperature. Their catalytic performance can exceed the one of traditional catalysts, as shown by the pioneering work of M. Haruta and collaborators on the carbon monoxide (CO) oxidation at low temperatures.5,6
Au nanoparticles supported on TiO2 present specific and particularly interesting properties, leading to promising results in enhancing chemical processes by plasmonic effect, such as H2 dissociation,7,8 aerobic oxidation,9 carbon monoxide oxidation10 and water splitting.11,12
In order to have a deeper comprehension of the mechanisms underlying these photo-catalytic performances, it is particularly useful to consider model systems.
Au NPs growth on TiO2(110) has been described by several authors, as reviewed by Cosandey.13 Regardless from surface preparation and NPs deposition methods, epitaxial growth has been observed: two main growth orientations, (111)Au//(110)TiO2 and (112)Au//(110)TiO2, are present and the Au〈110〉 direction is aligned on the bridged oxygen rows of the rutile surface. Indeed, the lattice mismatch is generally large between rutile and a face-centered cubic (fcc) Au crystal, but it is only 2.7% along this axis in this specific alignment.
Experimentally probing the structural properties in in situ conditions is more difficult, as shown by the scarce number of publications. In situ Grazing Incidence Small Angle X-ray Scattering (GISAXS) and Grazing Incidence X-Ray Diffraction (GIXRD) characterizations have been made by Lazzari et al.14 to study the early stages of growth. The authors confirmed the epitaxial orientations already discussed in the literature and revealed the presence of two regimes, where the initial growth at constant nanoparticles density regulated by surface diffusion is followed by a coalescence mechanism.
Studying the optical response of Au/TiO2(110) NPs is even more challenging. From one side, Au Drude plasmons are strongly coupled to the interband transitions from the d band electrons, making more difficult the description of LSPR. On the other side, TiO2 has a large dielectric constant and the substrate absorption blurs the direct interpretation of the optical response, complicating the theoretical calculations.15,16 To the best of our knowledge, no calculations are present in the literature on this system, while only Lazzari et al. performed an experimental study to characterize LSPR.17 During vapor deposition growth, they carried out Surface Differential Reflectivity Spectroscopy (SDRS) measurements to study the LSPR response as a function of the equivalent thickness of various deposited metals (Ag, Au and Zn), but without characterization of the NPs size. They showed the influence of the substrate, Al2O3(0001), TiO2(110), and ZnO(0001), and discussed the contribution of excitation modes parallel and perpendicular to the surface. For Au/TiO2(110), they concluded that localized plasmon excitation involves only free electrons and they identified LSPR modes predominantly parallel to the surface.
We herein demonstrate that the in situ coupling of synchrotron techniques (GIXRD and GISAXS) with an easy-to-use SDRS optical setup can provide valuable information on the correlation between structural/morphological parameters and the LSPR of gold nanoparticles supported on TiO2(110).
The study of this correlation is crucial in order to have a deeper understanding of the NPs plasmonic properties. We performed GISAXS simultaneously with SDRS experiments during the NPs growth in the 2–6 nm range. Mean size, height and inter-particles distance obtained with GISAXS are used to interpret the plasmonic response. GIXRD measurements were made in situ after gold deposition, allowing the description of the Au NPs structure. Crossing the information obtained with the different techniques, we give an original insight about the influence of the NPs structural and morphological characteristics and of the NPs-substrate interaction on the LSPR, showing the strength of our in situ experimental approach.
2. Experimental methods
The experiments were performed on the six circles diffractometer of the SIXS beam line at the SOLEIL synchrotron source (France). In our experimental configuration, the normal to the surface was in the horizontal plane. The sample could be rotated around the surface normal (azimuthal angle ω). The energy of the incident X-ray beam was equal to 18.5 keV and the incident angle was settled to ∼0.13°, corresponding to the critical angle αc of TiO2 at this energy. These choices minimize fluorescence emission by Au NPs and enhance the surface contribution compared to the bulk one. The incident X-ray beam was focused on the sample, with 50 μm as horizontal size and 30 μm as vertical size (FWHM).Rutile phase TiO2(110) single crystals (10.5 mm diameter, 1.5 mm thickness) were purchased from MaTeck. They are hat-shaped and could be mounted on the diffractometer without shadowing effects in grazing incidence geometry. Prior to each metal deposition, the TiO2(110) crystal was prepared in an ultra-high vacuum (UHV) preparation chamber in order to get a clean and stoichiometric (1 × 1) surface in a reproducible way. It is well known that cycles of Ar+ ion sputtering and subsequent annealing in the range 1000–1150 K produce a (1 × 1) phase with large, relatively flat terraces.18 The surface preparation was made before each gold deposition with two consecutive cycles, each one consisting of one argon ion sputtering (700 V, 25 minutes) followed by annealing at about 1050 K under an oxygen partial pressure of 10−6 mbar (20 minutes). Two different TiO2(110) crystals (in the following they will be referred to as S1 and S2) have been used. S1 and S2 were cut in the same rutile rod, but S1 underwent a very large number of preparation cycles before the synchrotron experiments campaign, while S2 was newly used and hence went through a limited number of cycles.
After the surface preparation procedure, both crystals were transparent and their color was light blue, characteristic of a weak bulk reduction.19
The clean and nearly stoichiometric TiO2(110) single crystal was transferred in situ to the adjacent UHV characterization chamber (pressure in the low 10−9 mbar range) equipped with molecular beam epitaxy (MBE). High purity gold was evaporated from a cell held at 1440 K onto the TiO2 surface at nearly room temperature. The deposition rate, calibrated with a quartz microbalance, was about 0.038 nm min−1. Defining one monolayer (ML) as the number of atoms in a single Au(111) bulk plane, this rate is equivalent to 0.16 ML per min. In the following, the quantity of deposited gold will be given as the equivalent thickness expressed in n ML, n being the number of atomic monolayers.
We followed Au deposition onto the S1 and S2 crystals simultaneously recording SDRS and GISAXS signals. GIXRD characterization was made at the end of each deposition (S1 ∼ 5.3 ML, S2 ∼ 10 ML).
All the characterization techniques we used probe a huge number of NPs: the extracted parameters represent their mean value over all the NPs present on the illuminated surface.
2.1 GIXRD
Grazing Incidence X-ray diffraction data were collected in situ at the end of gold deposition with a punctual YAP scintillator detector and a two-dimensional XPAD S140 detector (240 × 560 pixels, 130 × 130 microns2 each).We used the crystal surface basis (asbscs) with cs = [110]bulk, perpendicular to the crystal surface, as = [001] bulk, parallel to the Ti5 and bridging oxygen rows, and bs = [1–10]bulk (with as = 0.2953 nm and bs = cs = 0.649 nm). The TiO2(110) (1 × 1) surface is highly anisotropic with alternating rows of fivefold coordinated Ti atoms (Ti5) and of protruding twofold coordinated bridging oxygens in the as direction.
GIXRD data are represented in the corresponding surface reciprocal space with Miller indices (hsksls). Three types of measurements were made at ls = 0.05: radial hs and ks scans, two-dimensional mapping of the reciprocal space and azimuthal omega scans.
For the description of Au NPs diffraction, reflections are indexed in the gold fcc unit cell.
2.2 Coupled in situ SDRS and GISAXS measurements
SDRS spectra and GISAXS images were simultaneously recorded in situ during gold NPs growth; the experimental conditions are detailed in the following paragraphs.The counting time for each image varied from a few seconds up to some tens of seconds, depending on the amount of deposited gold. In any case, the amount of deposited gold varied by less than 0.2 ML during one acquisition.
In GISAXS, the component of the momentum transfer Q perpendicular to the detector can be neglected. In this approximation, only the components in the detector plane, Q// and Q⊥, are considered:20
Q// = ki![[thin space (1/6-em)]](https://www.rsc.org/images/entities/char_2009.gif) cos(αf)sin(2θf) cos(αf)sin(2θf) |
Q⊥ = ki (sin![[thin space (1/6-em)]](https://www.rsc.org/images/entities/char_2009.gif) αf + sin αf + sin![[thin space (1/6-em)]](https://www.rsc.org/images/entities/char_2009.gif) αi) αi) |
We recall that when a collection of regularly distributed particles is present at the surface, a well-defined peak, the so-called correlation peak, appears on both sides of the direct beam.
Several profiles were extracted from recorded GISAXS images and used for the quantitative data analysis. One profile was obtained cutting along the Q⊥ direction across the correlation peak at the maximum of the lobe intensity. Three other cuts along the Q// direction were taken at αf ≈ 3αc, αf ≈ 5αc and αf ≈ 7αc.
For each equivalent thickness, the four intensity profiles were fitted simultaneously with the IsGISAXS software21 using a χ2 criterion with error bars proportional to the square root of the intensity. The particles form factor was calculated in the frame of the Distorted-Wave Born Approximation (DWBA),22 which takes into account the reflection and refraction effects. The Size-Spacing Correlation Approximation model (SSCA)14 was used to describe the interference function: it introduces the coupling between the particles size and their spacing in a modified one-dimensional paracrystal,23 allowing the description of the in-plane disorder of the particles assembly.
The NPs shape was modeled with truncated spheres, which correctly describe small nanosized Au NPs.24,25 Modeling of the GISAXS signals allows estimating the mean values of the particles diameter D, height/diameter ratio H/D and inter-particle center-to-center distance L, as well as the dispersion around these values modeled with a Gauss distribution.
The experimental setup is schematically shown in Fig. 1.
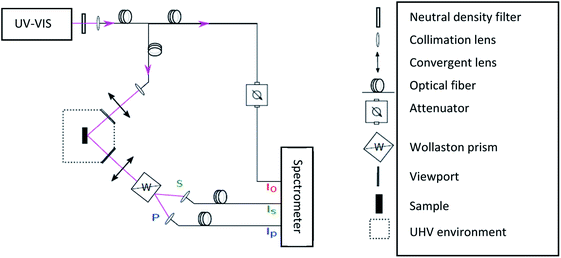 | ||
| Fig. 1 Schematic representation of the SDRS setup. The optical fibers, viewports and lenses are made of fused silica. | ||
The incident non-polarized UV-Vis beam [200; 1100 nm] is emitted by a deuterium/halogen source. After going through a neutral density filter to avoid spectrometer saturation, it is focused into a Y optical fiber with a transmittance close to 90%. One branch goes to the three-channel Avantes spectrometer allowing the incident beam intensity I0 measurement. The light in the second branch is focused on the sample, impinging at an angle of 45° on its surface, as fixed by the chamber fused silica viewports. The reflected beam goes through a barium borate Wollaston prism inducing a symmetric splitting (15° at λ = 633 nm) and allowing the separation of the s and p light polarizations, with the electromagnetic field perpendicular and parallel to the incidence plane, respectively. s and p signals are separately collected by optical fibers and analyzed by the spectrometer to get Is and Ip intensities as a function of the wavelength. Thanks to this experimental setup, we could measure p (SDRSp = (Rp − RrefP)/RrefP) and s (SDRSs=(Rs − Rrefs)/Rrefs) components of the surface differential reflectivity signal.
The wavelength-pixel calibration was performed at factory and checked with both Hg-lamp and deuterium sharp emission lines. Due to the absorption by the different elements on the optical path (including the TiO2 substrate), the light is strongly attenuated in the far UV and the measured SDRS is significant only in the slightly reduced range of [270; 1000 nm]. One spectrum is the average over 800 scans; the integration time of each scan being 2.5 ms. This choice is a compromise between good statistics and minimization of the integration time and allows optical measurements during the growth of NPs at the scale of the second. Spectra are corrected for dark signal, source drift (normalization with measured I0) and normalized by an average over about 10 acquisitions of Rref.
TiO2(110) is a birefringent material with the optical axis in the surface along the bridging oxygen [100]s direction. Thus the reflectance has a sinusoidal behavior as a function of ω (ω being the angle between the optical axis and the light incident plane), with p and s signals in phase opposition. Yet azimuthal ω-scan are frequently performed during X-ray data recording. For this reason, we verified the dependence of the optical response ΔR/Rref on ω. We could validate that ΔR/Rref profile in presence of supported NPs is independent from the azimuthal angle, provided that the two measurements R and Rref are made at the same ω value. Nevertheless, p and s intensities ratio slightly depends (up to about 10%) on the omega value. This is why GISAXS measured at a fixed ω angle was recorded simultaneously with SDRS during the gold NPs growth.
3. Results and discussion
3.1 GIXRD
In-plane two-dimensional maps collected at ls = 0.05 for the two samples S1 and S2 at the end of the gold deposition (equivalent thicknesses equal to 5.3 ML and 10.5 ML, respectively) are shown in Fig. 2. TiO2(110) Bragg peaks at hs and ks integer values are indicated by blue stars. | ||
| Fig. 2 Reciprocal space map (hsks 0.05) of the diffracted intensities for S1 (a) and S2 (b) with logarithmic color scale. Blue stars refer to TiO2(110) Bragg peaks. Au NPs Bragg peaks are indexed in the gold fcc reference (hkl). The font colors refer to the different epitaxies: orange Au(111), violet Au(112), gray Au(001), the (2-20) peak (black) is compatible with the three epitaxies. Italic characters indicate the Debye rings. Black lines display the radial hs and ks scans shown in Fig. 4. | ||
Bragg peaks at non-integer hs or ks are due to epitaxial gold nano-crystallites, characterized by a specific orientation compared to the supporting oxide surface. These peaks are indexed in the reciprocal lattice of cubic gold (aAu = 0.40782 nm). Data clearly indicate that the epitaxial Au NPs have a fcc structure: the corresponding peaks can all be indexed with integer (hkl) values, either all even or all odd, verifying the extinction rules of this structure.
In addition to the presence of bulk TiO2 and Au NPs Bragg peaks, images reveal the existence of diffraction Debye rings, signature of NPs with an in-plane orientational disorder.
Let's first discuss the epitaxied NPs fraction. The peak (2-20), recorded along as, is present in both samples and is the most intense NPs Bragg peak. It indicates that epitaxied NPs are characterized by the alignment of the Au dense [110] rows with the characteristic [100]s direction of the alternating Ti5 and bridging oxygens for TiO2(110)-(1 × 1). This result suggests that epitaxied Au NPs grow on TiO2(110) terraces. Indeed, it is known that on such terraces, Ti5 atoms or bridging oxygen vacancies (even a well-ordered (1 × 1) surface would contain 8% oxygen surface vacancies26) represent preferential nucleation sites.13,27
For sample S1, two main growth axis with the Au[110]//[100]s alignment are identified, in agreement with previous HRTEM studies.24 Au(111) NPs growth is revealed by the presence of two peaks of the {220} family rotated by 60° in-plane (see azimuthal scan of Fig. 3). Au(112) epitaxy is evidenced by peaks (2-20), (11-1), and (3-1-1). Additional (200) and (220) peaks, which could be explained with the Au(001) epitaxy, and also the (11-3) peak, compatible with Au(332) epitaxy, are observed, but intensities are quite weak, corresponding to negligible contributions.
 | ||
| Fig. 3 Azimuthal scan normalized with respect to the maximum intensity of the (2-20) peak for sample S1 (Q// = 43.6 nm−1, {220} gold interplanar distance d220 = 0.144 nm). | ||
The ratio of (111)Au//(110)TiO2 and (112)//(110)TiO2 orientations is nearly 1![[thin space (1/6-em)]](https://www.rsc.org/images/entities/char_2009.gif) :
:![[thin space (1/6-em)]](https://www.rsc.org/images/entities/char_2009.gif) 1, as obtained by the comparison of the integrated area in the ω scan (Fig. 3) of peak (20-2) (only Au(111) epitaxy contribution) and peak (2-20) (contribution of both main epitaxies). This result agrees with previous GIXRD experiments made by Lazzari et al.14
1, as obtained by the comparison of the integrated area in the ω scan (Fig. 3) of peak (20-2) (only Au(111) epitaxy contribution) and peak (2-20) (contribution of both main epitaxies). This result agrees with previous GIXRD experiments made by Lazzari et al.14
Sample S2 is characterized by the presence of the same two main epitaxies observed for S1.
In addition to Bragg peaks, Debye rings are observed in the two-dimensional maps for both samples, signature of the presence of in-plane randomly oriented NPs. The presence of orientationally disordered Au NPs on TiO2(110) was already pointed out by Wilson et al.28 for a much thinner equivalent thickness (about 1 ML), corresponding to smaller Au NPs than in our case. They observed a ring close to the (111) position that they attributed to scattering from small icosahedral NPs. In our case, all the strongest fcc powder diffraction rings are observed ((111), (002), (022), (113) and a faint (222) ring), indicating that the NPs have already relaxed to a bulk-like crystal structure. However, their relative intensities do not correspond to what is expected for a randomly oriented fcc powder. The (220) and (111) rings are particularly intense, corresponding to a texture with [111]Au (ring (220)) and [112]Au (both rings) growth directions perpendicular to the surface. In the following, these NPs will be referred to as textured NPs.
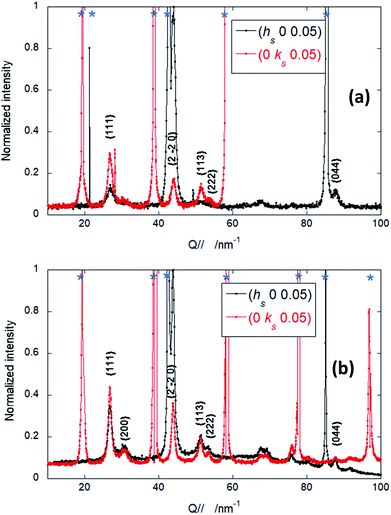
Unfortunately, our data do not allow a quantitative estimation of the epitaxied/textured NPs ratio, which would need a more extensive reciprocal space exploration. Nevertheless, in plane maps clearly indicate that while epitaxied NPs dominate in the diffraction pattern of S1, the textured ones are largely present for S2. We compared the integrated intensities of the (111) signal at about 26.8 nm−1 in the h scan (ring, textured NPs) and in the k scan (superposed Bragg peak and ring, epitaxied and textured NPs) for the two samples (Fig. 4a and b): the ratio textured/epitaxied NPs turns out to be larger by more than a factor 4 for S2 compared to S1. This observation is a clear indication that the interaction substrate/NPs is definitely weaker in the case of S2.
In order to check if epitaxied and orientationally disordered NPs are characterized by different sizes, we plotted the peak width ΔQ// as a function of the in-plane wave vector transfer Q// obtained from hs and ks scans29 (Fig. 4), Q// obeying to:
 and
and  .
.
For both samples, the ΔQ// values shown in Fig. 5 are about constant for each type of NPs (epitaxial and textured), allowing the evaluation of the corresponding in plane diffraction coherence length D// with the Debye–Sherrer equation.
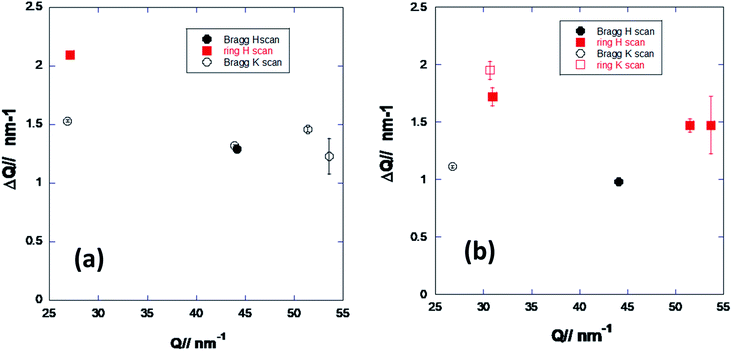 | ||
| Fig. 5 ΔQ// obtained as the FWHM of the peaks in the measured diffractograms (Fig. 4) as a function of Q// for sample S1 (a) and sample S2 (b). | ||
Moreover, they do not depend on the hs or ks direction, which is a clear indication that deposited NPs are isotropic in the plane parallel to the substrate surface. For S1 we obtain a coherent domain size of about 2.7 ± 0.1 nm for the textured NPs (diffused rings) and of about 4.3 ± 0.6 nm for epitaxial ones (Bragg peaks). In the case of S2, the coherence lengths are about 3.3 ± 0.4 nm and 5.4 ± 0.3 nm, respectively. Our results clearly show that the textured NPs have a smaller coherence length in both samples. This can be due to a different size of the two types of nanoparticles, but also to the presence of crystalline domains in each textured particle, at least in the plane.
The peaks positions in Fig. 4 allow calculating the corresponding lattice constant aAu in the fcc structure, as plotted in Fig. 6. The obtained values do not depend from the scan direction (hs or ks) and are slightly smaller for S1 compared to S2. These results can be explained by a smaller (on average) NPs size for S1, corresponding to a lower deposited thickness (5 ML) compared to S2 (10 ML). Indeed, it was shown that the lattice parameter undergoes a significant contraction with the decrease of the NPs size.30
 | ||
| Fig. 6 Lattice parameter values of the Au NPs obtained from the diffracted peaks position (Fig. 4) for S1 (a) and S2 (b). Dotted lines indicate the lattice parameter of bulk gold. | ||
In the case of S2, the lattice parameter has different values for epitaxied NPs (close to 4.06 Å) and for textured ones (close to Au bulk, 4.078 Å). This could be due to the fact that more than one crystalline domain are present in the in-plane disoriented NPs.
Finally, our GIXRD results indicate that Au NPs grow in a different way on the two substrates. On S1, a large number of epitaxied NPs (with the two dominant growth orientations (111)Au and (112)Au, and Au[110]//[001]s) is present, even if an assembly of textured NPs without specific epitaxial relationship is also observed. On S2, there are still epitaxied NPs, but now there is a notably larger assembly of textured NPs, mostly with [111] and [112] growth directions and randomly orientated in the plane. Their presence is the signature of a weaker interaction between the substrate and the NPs. Also, epitaxied NPs are characterized by a larger coherent domain size compared to the textured ones.
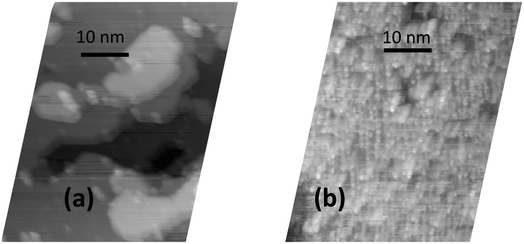
The different Au NPs growth on the two TiO2(110) crystals can result from the distinct rutile surface states. Indeed, STM images of the clean S1 and S2 substrates recorded before (S1) and after (S2) the synchrotron experiments show that the two surfaces do not present the same morphology: the flat terraces present on S1 are completely absent on S2 (Fig. 7). We notice that the STM image of the S2 sample surface is quite similar to that reported in the literature for a fresh TiO2 crystal.19,31 Accordingly to these works, fresh rutile crystals present impurities at their surfaces (Ca, Mg, Al, V…), inducing a different surface morphology, which disappears after several sputtering/annealing cycles. The S2 sample was indeed a newly used crystal, having undergone a significantly smaller number of preparation cycles before these experiments compared to S1. Nevertheless, Auger electron spectroscopy measurements made on S2 allowed excluding the presence of significant amounts of impurities on its surface.
3.2 Coupled GISAXS-SDRS
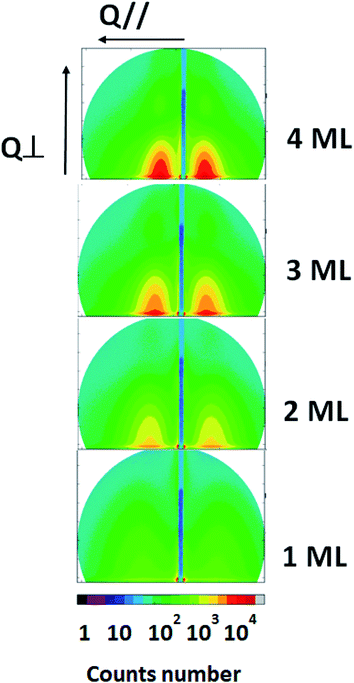
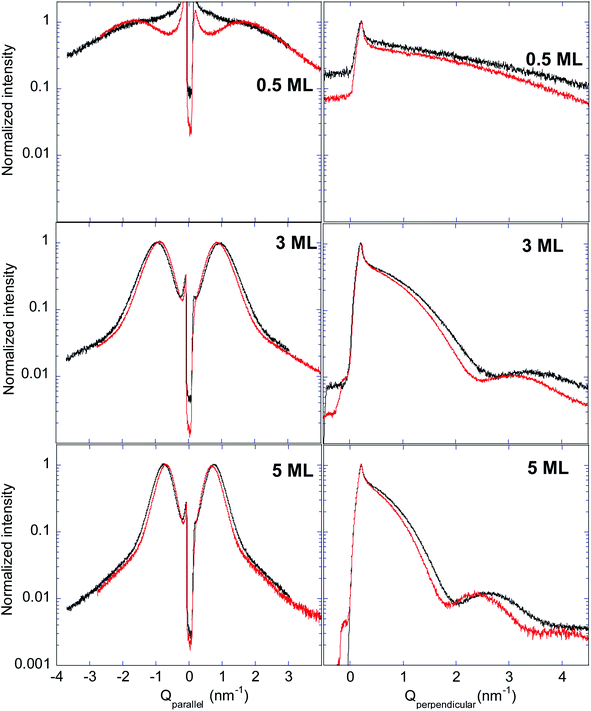
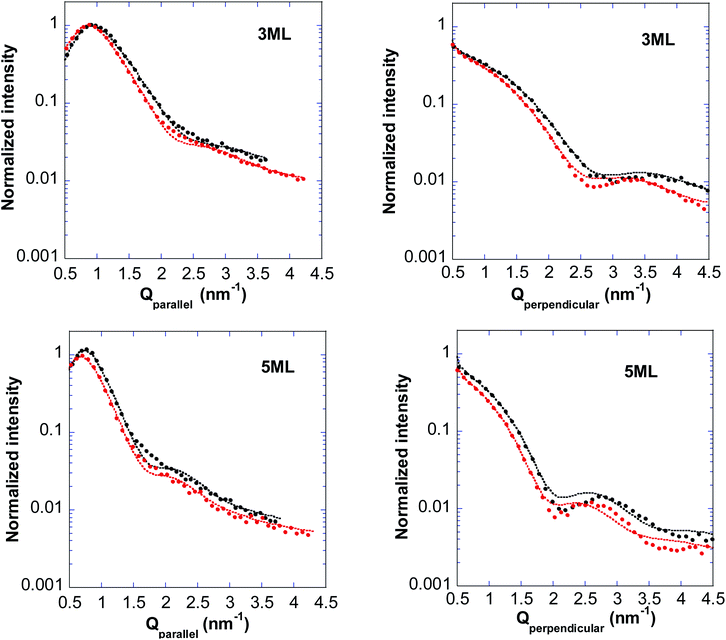
Coupled GISAXS-SDRS measurements were made during Au NPs growth up to a thickness of 10 deposited ML. We will firstly describe the results gained from GISAXS. The morphological parameters obtained will then be used to analyze the optical response of the deposited nanoparticles.Parallel and perpendicular cross-sections extracted from the GISAXS images are seen in Fig. 9. They show a similar behavior in the two samples: bumps intensity in Q// scans increases with equivalent thickness; oscillations, present only in the perpendicular scans, become more and more pronounced. Small differences are observed between the two samples for a given equivalent thickness, especially for 0.5 ML. They could result from the different surface morphologies of the substrates, as seen in STM images. However, the influence of a slightly different calibration of the quartz microbalance in the two experiments cannot be excluded. We will therefore not comment more on these slight differences. Anyway, the relevant parameters to interpret the plasmonic properties are the NPs geometrical parameters, rather than the equivalent thickness of the gold deposit.
The experimental data along Q// and Q⊥ profiles are compared to the best fits (Fig. 10).
GISAXS simulations were performed in the SSCA approximation where size and inter-particles distance are coupled. Extracted Au amounts fit within 10% the nominal values. The coupling parameter κ was found equal to 4 for deposited thicknesses above 2 ML, in agreement with Lazzari et al.14
The Au NPs shape is modeled with a truncated sphere, assuming a monodisperse Gaussian distribution of the NPs size, as suggested by GIXRD (S1 and S2 are characterized by a large number of epitaxied and textured NPs, respectively).
Data modeling reproduces well the intensity profile along Q//, but the fitting of the oscillations characteristic of the perpendicular profiles becomes less satisfactory beyond ∼5 ML (even if χ2 values always remain smaller than 1). Above 7 ML, it becomes too bad to get reliable geometrical parameters. Indeed, for large Au NPs, the truncated sphere is a rough approximation; such NPs are expected to be best described by a truncated octahedron, the equilibrium shape derived from the minimum surface free energy in fcc metals.25 Also, our GIXRD results show that an important number of NPs is characterized by the (111) growth orientation at the end of the deposition. This should result in a relatively flat nanoparticle termination, which is not reproduced by the truncated sphere description and which might be at the origin of the observed oscillations for the largest NPs.
Fig. 11 shows the mean values of the parameters obtained from the GISAXS data fitting. Error bars correspond to the FWHM of the related Gaussian distribution.
As expected, the mean NPs diameter 〈D〉 increases with deposited thickness, as well as the mean distance 〈L〉 between the NPs centers. This is the signature of NPs coalescence, as already pointed out by Lazzari et al.14 Edge-to-edge (L–D) distance is nearly constant, with a value close to 1 nm. The NPs size obtained by GISAXS at the end of deposition for S1 is in very good agreement with the in-plane coherence length deduced from GIXRD for the epitaxial NPs (4.3 ± 0.6 nm). For S2, GISAXS sizes are determined only up to 7 ML (∼5.5 nm), while GIXRD was performed at 10 ML. Nevertheless, the GIXRD coherence domain obtained for the textured NPs (3.3 ± 0.4 nm) is definitely smaller than the NPs size, while that of epitaxied NPs (5.4 ± 0.3 nm) is comparable.
However, GISAXS probes all NPs, including the textured fraction that exhibits a shorter coherence length in GIXRD. These results conciliate only if textured nanoparticles contain twins or have a polycrystalline character, their size being larger than the coherent domain observed by GIXRD. Our interpretation is that the coalescence process of epitaxied NPs results in a single domain, while for textured NPs domain boundaries are formed.
The aspect ratio H/D is about 0.8, close the H/D ratio of a truncated cubo-octahedron, even if it seems to increase at the largest sizes for S2. In the following, the obtained morphological parameters will be used to analyze the SDRS results.
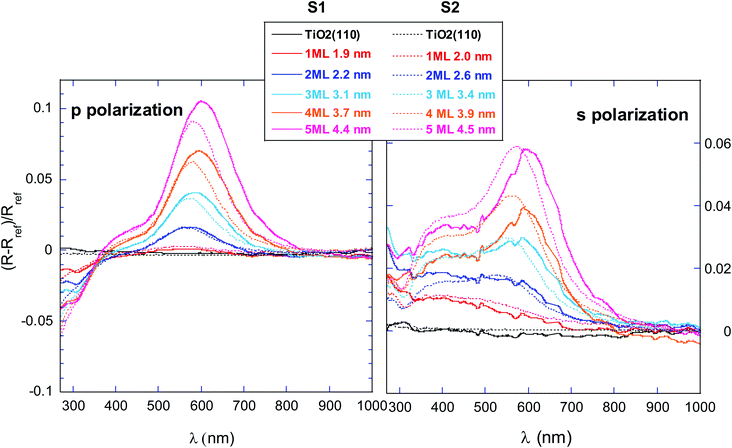
As a general trend, both p and s signals show the gradual increase of a main peak at a wavelength of λ ∼ 600 nm. This peak corresponds to the Drude plasmon resonance usually observed for Au nanoparticles. A continuous gold film would rather give rise to a signal continuously increasing with the wavelength.32
The plasmonic signature is clearly detected at ∼2 ML, corresponding to a NPs size of about 2 nm. This result agrees with ab initio TDDFT calculations, showing that the coupling with interband (IB) transitions from the d electrons induces LSPR damping with size decreasing up to the point to disappear almost completely at about 2 nm.33 Also, this size is close to the limit between discrete and band description of Au electronic levels.34
We can remark that signal amplitudes of samples S1 and S2 are similar for s polarization signals, while they are smaller for sample S2 in p polarization. Nevertheless we will not comment on this observation, since intensity differences can be due to the birefringence effect, as the two experiments were made at different ω values.
As a general tendency, the peak intensity increases with Au deposition in both polarizations and shifts towards higher wavelengths. Nonetheless the absolute peak position value is not the same for the two samples. Before discussing in detail the plasmonic response behavior, we briefly comment the other contributions to the SDRS signals.
As expected, IB transitions are visible in the [350; 500] nm region. It is well known that they are responsible for the presence of at least two thresholds at about 330 nm and 470 nm.35 Contrarily to p polarization response, IB signals in s polarization are badly separated from the plasmonic signal, particularly for the smallest measured sizes where the plasmonic signature is weaker. Estimating IB transition contribution to the SDRSs response using the theoretical description given by Lazzari et al.,16,17 we could verify that, even in this less favorable case, IB contribution does not influence the plasmon peak position. The resonance frequency can be therefore directly estimated as the plasmon peak maximum position.
At lower wavelengths, in the [270; 350] nm range, a negative peak forms in the p signal and its intensity increases with Au deposition. Due to its position, it cannot be attributed neither to IB transitions nor to an Au plasmonic resonance, while it corresponds well to an energy region beyond the TiO2 gap value (3.05 eV = 406 nm).16 We also observed variations of the optical reflectivity in the sub-400 nm region during sputtering and annealing of the bare TiO2(110) surface (not shown). This is an indication that such a phenomenon may correspond to variations of titanium dioxide optical properties, likely due to electronic levels modifications (sputtering and annealing procedures are known to modify oxygen vacancies concentration19). Studying the Au/TiO2(110) system, Lazzari et al.17 observed a similar behavior of the SDRS signal. The authors suggest that deposited Au induces a charge transfer between the metal and the oxide surface, modifying the optical absorption in the TiO2 gap region. Indeed, electron charge transfer from gold to stoichiometric or slightly reduced TiO2(110) surface, inducing a downward band bending, was already observed with X-ray photoelectron spectroscopy.26,36
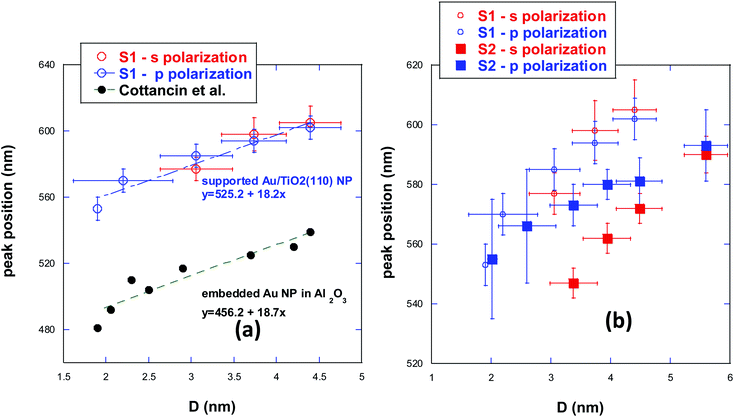
The plasmonic peak position was estimated from the zero value of the SDRS signal first derivative. Its evolution as a function of the NPs diameter deduced from GISAXS analysis is shown in Fig. 13.
For the S1 sample (Fig. 13a), we observe a linear blue shift with size decreasing. Such a behavior has already been observed for Au NPs embedded in Al2O3 (measurements made by Cottancin et al.,37 also reported in Fig. 13a). It is interesting to remark that both systems (supported and embedded NPs) are characterized by nearly the same slope of the linear fit describing the peak position as a function of the NPs size. It looks like the blue shift behavior with NPs size decreasing is an intrinsic property of the Au NPs, whatever the environment. Our observation agrees with theoretical calculations predicting a global blue shift for Au NPs as a result of two competitive phenomena: the larger diminishing of d electrons screening in surface atoms (inducing a blue shift) is predominant compared to s electrons spill-out phenomenon (causing a red shift).37–39
The effect of the NPs environment is highlighted by comparing the peak positions for a given NPs size. An overall red shift of about 80 nm is observed in Fig. 13a for Au/TiO2(110) compared to Au embedded in Al2O3, whatever the size. Indeed, LSPR not only depends on the surrounding dielectric when Au NPs are embedded (with a red shift that increases with the permittivity of the matrix: about 678 nm in TiO2, 541 nm in alumina and 504 nm in vacuum as calculated within the Mie model in the quasi-static approximation40), but it is also different between supported and embedded NPs. Absorption and diffusion cross-sections depend on the permittivity of the NPs and of the environment, but the reflectivity of supported NPs is also largely modified by the broken symmetry induced by the substrate and by the NPs truncated shape.
Concerning the s and p peaks position for a definite NPs size, we observe that they superimpose at each NPs diameter. The comparison of s and p peaks position is very interesting, as it informs about the directions (perpendicular or parallel to the surface) of the plasmonic oscillations. Indeed, the differential reflectivity, as derived within the formalism developed by Bedeaux and Vlieger and used by Lazzari et al.,41 is characterized by the fact that the parallel polarizability of the NPs determines the SDRS spectra in s polarization, whereas both the perpendicular and parallel vibration modes contribute to the measurements in p polarization. As parallel and perpendicular plasmonic modes for non-spherical supported Au NPs are expected to be characterized by different frequencies,17,42 the presence of perpendicular modes (contributing only to p signals) should induce a different plasmonic response in the two polarizations (p and s peaks positions are not the same). This is not the case for S1, for which s and p positions superimpose, implying that perpendicular modes are not present, or negligible, in this sample. This agrees with simulations predicting the predominant contribution of a specific parallel mode compared not only to the other parallel modes, but also to the perpendicular ones.17
The plasmonic peak positions obtained from SDRS signals of sample S2 are plotted in Fig. 13b.
In this case, the shift towards lower wavelengths with decreasing size is still present, but s and p peaks positions globally undergo a blue shift compared to S1. This result can be directly correlated to our structural and morphological observations. Indeed, our STM images and GIXRD experiments show that the substrate itself and the NPs/substrate interactions are quite different for the two samples and it is well-known that both aspects have a direct effect on the NPs plasmonic resonance. Theoretical calculations, describing the effect of the interaction of a metallic NP with a substrate in the quasi-static limit and the image charge model,43,44 show that a blue shift is present as the NPs/substrate interaction decreases. The global blue shift observed for the sample S2 compared to S1 is hence in accordance with a weaker NPs/substrate interaction. This point was already suggested by our GIXRD data, which revealed the presence of textured in-plane randomly oriented NPs, indicating a weaker bond with the surface.
More intriguing is the fact that s and p peaks positions have a different behavior according to the NPs size range.
At larger sizes (≳∼4 nm), except for the blue shift just discussed, the SDRS response has a similar trend as that observed for sample S1, with a superimposing of p and s polarizations. In opposite, s and p responses do not coincide anymore for sizes smaller than about 4 nm. They both exhibit a linear dependence, but while the s polarization slope remains very close to that of sample S1, that of p polarization is characterized by a weaker decreasing. Recalling that perpendicular modes contribute only to this latter polarization, this observation implies that perpendicular plasmonic modes are no more negligible for S2 in the smallest size range. Their contribution is larger for the smallest size and decreases with size increasing, becoming negligible beyond about 4 nm. As the p polarization is red shifted compared to the s one, this means that perpendicular modes are at lower energy than the parallel ones.
It is not straightforward to understand the original optical behavior of NPs smaller than about 4 nm on S2.
Our data allow ruling out the influence of the main NPs geometrical parameters. Indeed, for a given diameter and within our error bars, the inter-particle interaction (edge-to-edge (L–D) and inter-particle distance L) and the morphological parameter H/D revealed by GISAXS are close in the two cases.
On the other hand, we have shown that at the end of the deposit, the S2 sample exhibits a different NPs growth compared to S1, with a greater number of textured particles characterized by coherence domain sizes never exceeding about ∼4 nm and by the presence of different crystalline domains in a single nanoparticle. Unfortunately, GIXRD was not recorded during growth, but the difference in SDRS signals suggests that these textured NPs are representative of the NPs assembly in S2 not only at the end, but also at the beginning of the deposition. These sub-4 nm NPs may be characterized by a specific shape, structure and substrate interaction induced by the rough substrate.
Indeed, the truncated sphere, used in GISAXS modeling, is a good approximation to describe also other multi-facetted shapes, such as icosahedra or cubo-octahedra. The existence of these specific shapes is supported by previous experimental results. Based on aberration-corrected STEM images of Au NPs supported on vicinal TiO2 surfaces, Gao et al.45 modeled the shape parameters; they concluded that small (few nanometers) Au NPs on low miscut vicinal surfaces have a different equilibrium shape compared to the flat substrate. Wilson et al.28 also suggest an icosahedral shape for the small textured NPs.
Such a specific faceting/shape, blurred in GISAXS measurements, may have a large influence on the plasmonic resonances, even in the small (few nm) size range.42,44 For instance, Discrete Dipole Approximation within the spectral representation formalism calculation on colloidal nanometric silver NPs shows a red shift (up to several tens of nm) of the plasmonic peak position when the shape evolves from the sphere to icosahedra and different truncated cubes.44
A specific NPs/substrate interface for the smaller sized textured NPs on the rougher substrate can also modify the LSPR response compared to a flat surface through several parameters, like strains, wetting properties, contact area…. This can change the boundary conditions for collective excitations at the interface. Due to substrate influence, lifting of the degeneracy of isolated sphere characteristic modes and transfer of a part of the oscillator strength to new modes were for example revealed in the case of supported spherical silver NPs by a computation study based on the exact multipole expansion method.15
Anyway, we believe that computation developments are now critical for a deep comprehension of the mechanisms underlying the observed Au/TiO2(110) LSPR properties.
4. Conclusions
We deposited gold onto two TiO2(110) crystals having a different surface state, as revealed by STM images: one surface is characterized by the presence of large terraces, while the other one is quite rough. During the growth of gold NPs, we recorded in situ SDRS signals, differentiating s and p polarization contributions, coupled to GISAXS. GIXRD was performed at the end of the gold deposition.GIXRD experiments showed that the TiO2(110) surface state largely modifies the Au NPs growth. Epitaxied NPs grow on the terraces of the flat surface and have a strong interaction with the substrate, while textured orientationally-disordered NPs are mostly present on the rough surface and are characterized by a weaker interaction with the substrate.
The optical response gained from SDRS has been interpreted as a function of the Au NPs size obtained by GISAXS. Apart from a global blue shift of the plasmonic peaks positions with size decreasing in both samples, characteristic of the size variation and poorly dependent from the NPs environment, optical responses present a quite different behavior for the two deposits. For the NPs on the rougher surface, the LSPR response is globally observed at a lower wavelength, signature of a weaker NPs-substrate interaction, and plasmonic modes perpendicular to the crystal surface become non-negligible for the smallest deposited NPs (smaller than ∼ 4 nm).
Crossed GIXRD, GISAXS and SDRS data suggest that textured NPs largely contribute to this specific optical behavior, possibly due to a distinguishing shape and/or interaction with the substrate.
We demonstrate the crucial role of the NPs/substrate interaction on the NPs plasmonic properties, either in a direct way, determining the interaction strength between NPs and substrate, or in an indirect way, changing the morphological/structural characteristics of the deposited metallic clusters.
These results clearly show the possibility to tune LSPR response as a function of the surface state of the substrate, but also of the incident light polarization.
Finally, we have shown that coupling in situ structural/morphological and optical characterization techniques is a powerful way to better understand the evolution of LSPR as a function of several parameters, like size, structure of the NPs and substrate morphology.
A full understanding of the relationship between the TiO2 substrate morphology and plasmonic properties of Au NPs requires further theoretical investigations, which have to overcome the specific properties of Au/TiO2(110), like the coupling between interband transitions and collective oscillations or the important substrate absorption. We hope that future computation studies involving different substrate morphologies coupled to different NPs shape and NPs-substrate interactions will be motivated by our study.
Conflicts of interest
There are no conflicts to declare.Acknowledgements
We are grateful to all the staff of SIXS beamline at SOLEIL, in particular to Benjamin Voisin, and of the SERAS technological pole at Néel Institut. A. B. acknowledges the financial support of the SMINGUE research pole from the Université Joseph Fourier (now part of Université Grenoble Alpes) for the development of the SDRS experimental setup. The “Appel à projet Grenoble Innovation Recherche” (AGIR, 2014) is also greatly acknowledged for financing a PhD fellow.References
- X. Zhang, Y. L. Chen, R.-S. Liu and D. P. Tsai, Rep. Prog. Phys., 2013, 76, 046401 CrossRef PubMed.
- S. Linic, P. Christopher and D. B. Ingram, Nat. Mater., 2011, 10, 911 CrossRef CAS PubMed.
- S. Linic, U. Aslam, C. Boerigter and M. Morabito, Nat. Mater., 2015, 14, 567 CrossRef CAS PubMed.
- V. Amendola, R. Pilot, M. Frasconi, O. M. Maragò and M. A. Iatì, J. Phys.: Condens. Matter, 2017, 29, 203002 CrossRef PubMed.
- M. Haruta, N. Yamada, T. Kobayashi and S. Iijima, J. Catal., 1989, 115, 301 CrossRef CAS.
- G. R. Bamwenda, S. Tsubota, T. Nakamura and M. Haruta, Catal. Lett., 1997, 44, 83 CrossRef CAS.
- S. Mukherjee, F. Libisch, N. Large, O. Neumann, L. V. Brown, J. Cheng, J. B. Lassiter, E. A. Carter, P. Nordlander and N. J. Halas, Nanoletters, 2013, 13, 240 CrossRef CAS PubMed.
- A. Tittl, X. Yin, H. Giessen, X.-D. Tian, Z.-Q. Tian, C. Kremers, D. N. Chigrin and N. Liu, Nanoletters, 2013, 13, 1816 CrossRef CAS PubMed.
- T. Y. Shiraishi, Y. Sugano, S. Ichikawa, S. Tanaka and T. Hirai, J. Appl. Chem. Sci., 2012, 134, 6309 Search PubMed.
- W. H. Hung, M. Aykol, D. Valley, W. Hou and S. B. Cronin, Nanolett, 2010, 10, 1314 CrossRef CAS PubMed.
- Z. Liu, W. Hou, P. Pavaskar, M. Aykol and S. B. Cronin, Nanolett, 2011, 11, 1111 CrossRef CAS PubMed.
- C. Gomes Silva, R. Juarez, T. Marino, R. Molinari and H. Garcıa, J. Appl. Chem. Sci., 2011, 133, 595 CAS.
- F. Cosandey, Phil. Mag., 2013, 93(10–12), 1197 CrossRef CAS.
- R. Lazzari, G. Renaud, J. Jupille and F. Leroy, Phys. Rev. B: Condens. Matter Mater. Phys., 2007, 76, 125412 CrossRef.
- J. Lermé, C. Bonnet, M. Broyer, E. Cottancin, D. Manchon and M. Pellarin, J. Phys. Chem. C, 2013, 117, 6383 CrossRef.
- R. Lazzari, I. Simonsen and J. Jupille, Plasmonics, 2014, 9, 261 CrossRef CAS.
- R. Lazzari, J. Jupille, R. i. Cavallotti and I. Simonsen, J. Phys. Chem. C, 2014, 118, 7032 CrossRef CAS.
- X. Lai, T. P. St. Clair, M. Valden and D. W. Goodman, Prog. Surf. Sci., 1998, 59, 25 CrossRef CAS.
- U. Diebold, Surf. Sci. Rep., 2003, 48, 53 CrossRef CAS.
- G. Renaud, R. Lazzari and F. Leroy, Surf. Sci. Rep., 2009, 64, 255380 CrossRef.
- R. Lazzari, J. Appl. Crystallogr., 2002, 35, 406 CrossRef CAS.
- M. Rauscher, T. Salditt and S. Spohn, Phys. Rev. B: Condens. Matter Mater. Phys., 1995, 52, 16855 CrossRef CAS PubMed.
- R. Hosemann, Acta Crystallogr., 1951, 4, 520 CrossRef.
- F. Cosandey and T. E. Madey, Surf. Rev. Lett., 2001, 8(1&2), 73 Search PubMed.
- T. Akita, K. Tanaka, M. Kohyama and M. Haruta, Surf. Interface Anal., 2008, 40, 1760 CrossRef CAS.
- Z. Zhang, W. Tang, M. Neurock and J. J. T. Yates, J. Phys. Chem. C, 2011, 115, 23848 CrossRef CAS.
- E. Wahlström, N. Lopez, R. Schaub, P. Thostrup, A. Rønnau, C. Africh, E. Laegsgaard, J. K. Nørskov and F. Besenbacher, Phys. Rev. Lett., 2003, 90, 26101 CrossRef PubMed.
- A. Wilson, R. Bernard, A. Vlad, Y. Borensztein, A. Coati, B. Croset, Y. Garreau and G. Prevot, Phys. Rev. B: Condens. Matter Mater. Phys., 2014, 90, 075416 CrossRef.
- B. E. Warren, X-Ray Diffraction, Dover Publications Inc.New York 1990 Search PubMed.
- J. T. Miller, A. J. Kropf, Y. Zha, J. R. Regalbuto, L. Delannoy, C. Louis, E. Bus and J. A. van Bokhoven, J. Catal., 2006, 240, 222 CrossRef CAS.
- L. P. Zhang, M. Li and U. Diebold, Surf. Sci., 1998, 412/413, 242 CrossRef CAS.
- G. Abadias, L. Simonot, J. J. Colin, A. Michel, S. Camelio and D. Babonneau, Appl. Phys. Lett., 2015, 107, 183105 CrossRef.
- X. López-Lozano, H. Barron, C. Mottet and H.-C. H. Weiddker, Phys. Chem. Chem. Phys., 2014, 16, 1820 RSC.
- R. Kubo, J. Phys. Soc. Jpn., 1962, 17, 975 CrossRef CAS.
- P. G. Etchegoin, E. C. Le Ru and M. Meyer, J. Chem. Phys., 2006, 125, 164705 CrossRef CAS PubMed.
- T. Okazawa, M. Fujiwara, T. Nishimura, T. Akita, M. Kohyama and Y. Kido, Surf. Sci., 2006, 600, 4430 CrossRef CAS.
- E. Cottancin, G. Celep, J. Lermé, M. Pellarin, J. R. Huntzinger, J. L. Vialle and M. Broyer, Theor. Chem. Acc., 2006, 116, 514 Search PubMed ; data in our Fig. 13 are extracted from 3..
- R. Monreal, T. Antosiewicz and S. Apell, New J. Phys., 2013, 15, 083044 CrossRef.
- H.-C. Weissker and X. Lopez-Lozano, Phys. Chem. Chem. Phys., 2014, 16, 1820 RSC.
- C. Louis and O. Pluchery, Gold Nanoparticles for Physics, Chemistry and Biology, Imperial College Press, London, 2012 Search PubMed.
- R. Lazzari, S. Roux, I. Simonsen, J. Jupille, D. Bedeaux and J. Vlieger, Phys. Rev. B: Condens. Matter Mater. Phys., 2002, 65, 235424 CrossRef.
- J. P. Juste, I. Pastoriza-Santos, L. M. Liz-Marzan and P. Mulvaney, Coord. Chem. Rev., 2005, 249, 1870 CrossRef.
- P. Bobbert and J. Vlieger, Physica A, 1987, 147, 115 CrossRef.
- C. Noguez, J. Phys. Chem., 2007, 111, 3806 CAS.
- W. Gao, A. S. Choi and J.-M. Zuo, Surf. Sci., 2014, 625, 16 CrossRef CAS.
| This journal is © The Royal Society of Chemistry 2020 |

