Strain-induced phase transition and giant piezoelectricity in monolayer tellurene†
Xueru
Cai‡
a,
Yangyang
Ren‡
b,
Menghao
Wu
b,
Dongwei
Xu
 *a and
Xiaobing
Luo
 a
a
aState Key Laboratory of Coal Combustion, School of Energy and Power Engineering, Huazhong University of Science and Technology, Wuhan, Hubei 430074, China. E-mail: dwxu@hust.edu
bSchool of Physics, Huazhong University of Science and Technology, Wuhan, Hubei 430074, China
First published on 25th November 2019
Abstract
We report the transition of a strain-induced centrosymmetric β-phase to a non-centrosymmetric α-phase for monolayer tellurene based on density functional theory calculations. The phase transition is represented by the displacement of the middle-layer Te atoms from the center of the unit cell in the y-direction. The critical point for the phase transition is found to be at 0.5% biaxial tensile strain. By analyzing the bond variation and the phonon spectra, we attribute the phase transition to the decrease of the bonding strength at the tensile strain and the atom migration corresponding to the phonon vibration mode along the distorted direction. The transition to the α-phase under strain is further confirmed from the calculated electronic band structure where the spin–orbit coupling (SOC) induces a large Rashba splitting due to symmetry breaking, which may enable the control of spin via the electric field. Two-dimensional ferroelectrics can be formed upon transition of the strain-induced β-phase to the α-phase, and a high polarization of about 90 μC cm−2 can be achieved via a tensile strain, giving rise to a giant piezoelectric coefficient that is two orders of magnitude higher than that of the MoS2 monolayer.
Introduction
Tellurene, a new two-dimensional (2D) layered material, has triggered huge interest due to its unusual properties since it was proposed by Zhu et al.1 As the first discovered group-V elemental 2D material, tellurene possesses many desirable properties, such as thickness-dependent band gap, high carrier mobility, good thermoelectric performance and sizable ferroelectricity.2–5 Compared with multilayer 2D materials, a monolayer often possesses some extraordinary properties. For example, monolayer graphene has a significantly greater carrier mobility6 and a much higher thermal conductivity7 than multilayer graphene. For monolayer tellurene, at least five stable or meta-stable phases have been reported.1,8–10 Among the several reported phases of tellurene, β-tellurene has been proved to be the most stable phase for a monolayer and it has been successfully synthesized by different experimental methods.11,14 α-Phase and β-phase tellurene have similar structures but they do exhibit quite different properties.15,20 Naturally, the similarity of the structures drives researchers to clarify the relationship between these two phases.Piezoelectric materials, which convert mechanical energy into electrical energy, have potential applications in sensors and energy harvesting. 2D materials have aroused interest for piezoelectric applications because of their ability to withstand enormous strain. Among the studied properties of tellurene, ferroelectricity might be the most intriguing one. It's well known that ferroelectricity is mostly found in compound materials with different electronegativities and non-centrosymmetric structures. Since elemental materials are composed of the same element and typically possess a high symmetry structure, they have been reported to have no ferroelectricity traditionally. Recently, motivated by the natural multivalence of Te and experimental breakthrough in realizing 2D Te ultra-thin films,11–14 Wang et al.15 reported the first elemental 2D ferroelectric material: few-layer non-centrosymmetric α-tellurene. It evolved from centrosymmetric β-tellurene due to the interlayer interaction between lone pairs. For monolayer β-tellurene, interlayer interaction from lone pairs disappears. Since centrosymmetry-breaking is key to the ferroelectricity in tellurene, it's natural for us to reflect whether we can control the symmetry in monolayer β-tellurene by using other methods.
Strain engineering provides an effective way to tune the properties of 2D materials. It has been widely used to modulate the band structure, magnetism, thermoconductivity, lattice vibration, and even the structures of materials such as graphene, MoS2, and phosphorene.16–19 Moreover, strain is unavoidable during the fabrication of 2D materials due to lattice mismatch with the substrate. Recently, Xiang et al.20 investigated the energy barrier between two phases, achieving a compressive strain-induced non-centrosymmetric α-phase to centrosymmetric β-phase transition in bilayer tellurene. The findings of Xiang have shed light on the way to modulate the symmetry in multilayer tellurene. As reported by several groups,1,4,20 the β-phase is the most stable phase for monolayer tellurene. While the α-phase is interesting due to its centrosymmetry breaking and possible piezoelectric property, can we modulate the structure of monolayer tellurene from the β-phase to the α-phase by strain engineering? Furthermore, the magnitude of piezoelectricity in multilayer tellurene is related to the interlayer interaction that does not exist in monolayer tellurene. For monolayer tellurene, can we modulate the magnitude of piezoelectricity?
In this paper, we investigate the phase transition in monolayer tellurene induced by strain using first-principles calculations. Our calculations show that a centrosymmetric β-phase to non-centrosymmetric α-phase transition would occur when the strain is increased to 0.5%. To understand the mechanics of the phase transition, we analyse the variation of the bond length and the phonon spectra of α- and β-tellurene. We propose that the decrease of the bonding strength due to the increase of the bond length and the enhanced vibration mode of atoms are two main factors for the phase transition. The phase transition can induce the piezoelectric property in the α-phase and the magnitude could be further tuned by the tensile strain.
Computational methods
All the calculations are performed using density functional theory (DFT), as implemented in the Vienna ab initio Simulation Package (VASP).21,22 The exchange–correlation is treated with the Perdew–Burker–Ernzerhof (PBE) functional under the generalized gradient approximation (GGA).23 The plane-wave cut-off energy is set to 300 eV after a convergence test (ESI Fig. S1†) and the vacuum space is set to at least 20 Å in order to hinder the interactions between the monolayer and its mirror layers. A strict convergence condition (10−8 eV for energy convergence and 0.001 eV Å−1 for force convergence) is introduced to ensure the accuracy of the calculations. It has been well established that the spin–orbit coupling (SOC) effect is relatively important for tellurium, and SOC is taken into consideration for all electronic-structure calculations. The long-range van der Waals interactions are also taken into consideration by means of DFT-D3 methods.24,25 An 11 × 11 × 1 k-mesh (convergence test shown in ESI Fig. S2†) with the Monkhorst–Pack model26 is applied to sample the irreducible Brillouin zone in all calculations except for phonon frequencies. Phonon frequencies are obtained using Phononpy27 with a 4 × 4 × 1 supercell and 3 × 3 × 1 k-mesh. Ferroelectric polarizations are computed by using the Berry phase method28 implemented in VASP.Results and discussion
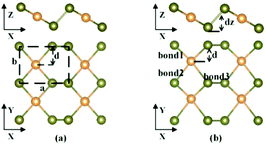
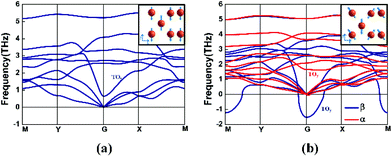
The structures of β-tellurene and α-tellurene are shown in Fig. 1. Note that since the definition of 2D Te phases is inconsistent among different research groups, we follow the definition based on the space group of material symmetry.15,20 With the middle-layer Te atoms located at the centre of the unit cell in the y-direction, β-tellurene forms a centrosymmetric structure which belongs to the space group P2/m, while for α-tellurene, the middle-layer Te atoms deviate from the centre, forming a new structure with a P2 symmetry. The main difference of the two phases is the deviation of the middle-layer Te atoms from the centre in the y-direction. We define a displacement ratio κ as |0.5b−d|/0.5b to characterize the deviation from the centrosymmetric β-phase, where b and d are the lattice constant and the distance between the centre and outer Te atoms along the y-direction respectively as shown in Fig. 1(a). When κ = 0, the structure is centrosymmetric β-phase tellurene. κ larger than 0 implies non-symmetric α-phase tellurene. As is illustrated in Fig. 1(b), there are three types of bonds in tellurene. Bond1 and bond2 denote the bonds between the middle layer Te atoms and the outer layer Te atoms. They are equivalent in β-tellurene and unequivalent in α-tellurene. Bond3 denotes the bond between the two outer layer Te atoms and dz represents the height of buckling.We start by considering the unstrained monolayer β-tellurene. The optimized structure maintains a perfect centrosymmetry with lattice constants a0 = 5.62 Å and b0 = 4.23 Å. In Zhu's work, the optimized lattice constants of β-tellurene are a = 5.49 Å and b = 4.17 Å. The difference arises from the different vdW method. In our work, we adopted DFT-D3 rather than DFT-D2 used in Zhu's work.1 Phonon spectra are then recorded to examine the structural stability of tellurene. As is shown in Fig. 2(a), spectra without an imaginary frequency indicate the structural stability of unstrained β-tellurene. The asymmetric waterfall-like transverse optical phonon mode TOy is also reported in a previous study.4 The corresponding optical vibration mode at the gamma points, which is along the y direction, is shown in the inset. This decrease in the frequency around the gamma point indicates a weak bonding strength.
A series of tensile biaxial strains are applied incrementally to the structure. The extended lattice constant due to the tensile strain is not optimized while the internal atoms are allowed to relax. The strain ε is defined as (l−l0)/l0, where l0(l) denotes the lattice constant without (with) strain. At a small strain ε, the structure is maintained in the β-phase. The structure stability is confirmed from the phonon spectra (as shown in ESI Fig. S3(a)–(c)).† When a larger strain is applied, the β-phase structure is not stable any more (ESI Fig. S3(d)–(h)).†Fig. 2(b) shows the phonon spectra at ε = 4% tensile biaxial strain. Blue and red colour curves correspond to the phonon spectra of β- and α-tellurene, respectively. A large imaginary frequency near the gamma point of the centrosymmetric β-phase indicates the instability of the structure. The imaginary frequency modes of this optical branch TOy at the gamma point correspond to a vibration mode by which the centre-layer Te atoms and the outer-layer Te atoms move toward opposite directions along the y axis, as shown in the inset of Fig. 2(a). Usually, such soft optical phonon modes indicate a structural distortion along the vibration direction. Inspired by this kind of distortion, by moving the centre-layer Te atoms with a tiny displacement along the y axis and then re-optimizing the structure, we obtain an energy-favourable α-phase tellurene. In contrast to the instability of β-tellurene under tensile strain, the imaginary frequency mode disappears for the α-phase as shown by the red curve in Fig. 2(b). The stability of α-phase tellurene under different tensile strains is confirmed by the phonon spectrum as shown in Fig. S5 of the ESI.† The effect of uniaxial strain on the stability of the structure is also studied. The uniaxial strain along the x direction does not change the stability of the structure (ESI Fig. S6†) while the strain along the y direction induces a large soft mode at the gamma point as shown in Fig. S7 of the ESI.† These results further confirm our previous conclusion from biaxial strain that the unstable β-phase under strain is related to the decrease of the atom interaction along the y-axis.
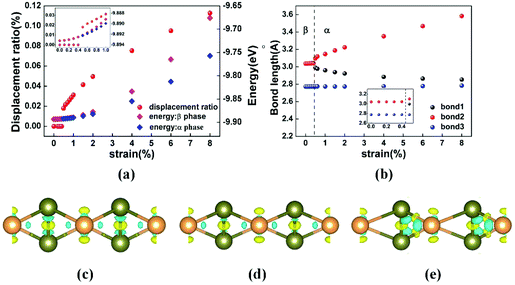
To disclose the relationship between strain and phase transition, we use the displacement ratio κ of the middle-layer Te atoms to characterize the phase transition of tellurene and study the corresponding change of the bond length. The red dots in Fig. 3(a) show the displacement ratio κ as a function of the applied biaxial tensile strain ε. At ε ≤ 0.4%, the displacement ratio κ is zero, implying that the centrosymmetric β-phase is maintained. A phase transition from the β-phase to the α-phase occurs at ε = 0.5% when the displacement ratio κ deviates from zero as shown clearly in the inset of Fig. 3(a). The displacement ratio can be further tuned by the strain. For the α-phase, the displacement ratio increases with the strain. The phase transition is further confirmed by comparing the energies of the two phases shown by the blue and magenta diamonds in Fig. 3(a). At ε ≤ 0.4%, the lowest energy state is β-phase tellurene. If the middle layer atoms deviate from the centre of the unit cell in the y-direction, the structure will optimize back to its centrosymmetric β-phase. At ε > 0.4%, β-phase tellurene is the meta-stable state. A small perturbation in the atom position will lead to the energy-favourable α-phase.
To investigate the mechanism of the phase transition, we calculate the bond length and bonding strength dependence of the strain. The calculated bond length as a function of the strain is shown in Fig. 3(b). It's interesting that three types of bonds exhibit totally different tendencies when strain is applied. All the three bonds increase slightly under strain in the β-phase, while in the α-phase, bond2 increases monotonically with the strain. In contrast, bond1 decreases with the increase of the strain. Different from the tendencies of bond1 and bond2, bond3 remains almost unchanged when the strain is increased. Note that the structure with shortened bond2 and elongated bond1 is an energy degenerate state of the α-phase. The bonding strength dependence of the strain can be deduced from the bond length and the differential charge density as shown in Fig. 3(d)–(f). From the unstrained to the strained β-phase, the neighbouring atom interaction is weakened due to the stretching of the bond length, while for the strained α-phase, the decrease in bond1 corresponds to an increase in the bonding strength between the middle and outer layer atoms.
The phase transition of tellurene can be explained phenomenologically by the change of the bond lengths and the vibration mode. The vibration frequency increases with the chemical bonding strength. It's well known that atoms in a crystalline lattice always vibrate around their equilibrium position at finite temperature. The crystal maintains its structure due to the constraint from atom interactions. When the strain is less than 0.5%, the bond length increase is limited; thus the bonding strength can still support the centrosymmetric structure. For example, the vibration mode at the gamma point by which the centre-layer Te atoms and the outer-layer Te atoms move toward opposite directions along the y axis is still maintained. However, the weak bonding strength induces a further decrease in the frequency at the gamma point (ESI Fig. S3(a)–(c)).† While the strain keeps increasing, the bond length is forced to increase. When the strain is larger than 0.5%, the weaker atom interaction from the extended bond length cannot support the vibration. With the increase of the strain strength, the interaction between the atoms is suppressed gradually. The weak bonding strength induces a more negative TOy vibration frequency at the gamma point (ESI Fig. S3†). Under this large strain condition (ε ≥ 0.5%), a perturbation of the atom position will induce a spontaneous structure distortion. The non-centrosymmetric α-phase provides an alternative energy-favourable structure. In the α-phase, the shortened bond1 leads to a stronger atom interaction between the middle and outer layers to maintain a stable structure. As a consequence of the increase of the bonding strength, the frequency of the TOy mode at the gamma point increases (ESI Fig. S5†). The distorted structure also changes the vibration direction. For example, the vibration modes of the centre-layer and outer-layer Te atoms at the gamma point of the TOy branch are not parallel any more, as shown in the inset of Fig. 2(b).
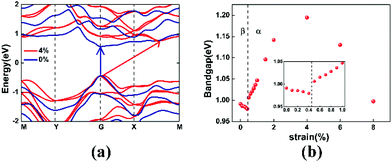
Electronic band structures can be modulated by strain engineering. We are interested in the effect of phase transition on the band structure. Fig. 4(a) compares the electronic band structures of monolayer tellurene under 0% (β-phase) and 4% (α-phase) biaxial tensile strain. A significant tunability is observed in Fig. 4(a). For unstrained β-tellurene, both the valence band maximum (VBM) and the conduction band minimum (CBM) locate at the high-symmetry gamma point, indicating a direct band gap for the unstrained configuration. However, for α-tellurene under 4% strain, the VBM shifts slightly away from the gamma point and the CBM shifts to a non-high-symmetry point between X and M, leading to a direct to indirect transition of the band gap. Meanwhile, the energy gap increases from 0.992 eV to 1.195 eV. The Rashba spin–orbit interaction induced band splitting can be observed in the non-centrosymmetric α-phase, implying the potential for spin-based application.
Fig. 4(b) shows the energy gap variation under strains. Two totally different tendencies were observed for the β-phase and the α-phase. For β-tellurene, the energy gap decreases with the strain due to the weakened atom interaction at ε ≤ 0.4%. When the strain keeps increasing, the energy gap suddenly increases from 0.980 eV to 1.006 eV. Note that this is exactly where the phase transition occurs. Then, for α-tellurene, the energy gap dependence of the strain shows a quadratic relationship. The energy gap first increases with strain, and then decreases after reaching a peak at ε = 4%.
Finally, we investigate the strain-induced 2D ferroelectricity29 and piezoelectricity of the α-phase. Upon transition from the β-phase to the α-phase, the monolayer structure turns from non-polar to polar, giving rise to in-plane polarization. This is evidenced by the notable Rashba-splitting induced by strain as shown in Fig. 4(a), which is much larger compared with that in other 2D ferroelectrics with heavy elements,29–32 which may enable the control of spin via ferroelectric switching. The polarization is strain sensitive. As displayed by the dependence of polarization on biaxial tensile strain ε in Fig. 5(a), the polarization changes from zero to a nonzero value of 0.32 × 10⁻¹⁰ C m−1 upon phase transition at ε = 0.5%. This value can even be increased to 1.8 × 10⁻¹⁰ C m−1 when ε increases to 8%, equivalent to 90 μC cm−2 in 3D if the thickness of monolayer tellurene is taken as 2 Å (as an approximate thickness shown in ESI Fig. S4†), and even higher than the induced polarization of 56 μC cm−2 predicted in Bi2O2Se under strain.31 If presuming a linear relationship between polarization and strain below 1%, the average piezoelectric coefficient can be 82 × 10−10 C m−1, equivalent to 41 C m−2 in 3D. The average piezoelectric coefficient for monolayer tellurene would be approximately three times higher compared with that for Bi2O2Se,31 two orders of magnitude higher compared with monolayer MoS232 and Janus transition metal dichalchogenides,33 and even approximately 2.5 times higher compared with monolayer group IV monochalcogenides such as SnSe34 that possess a large piezoelectric coefficient. We also calculate the ferroelectric switching pathway under strain, as shown in Fig. 5(b), where the switching barriers are below 0.08 eV at ε < 8%, so the polarization should be switchable under ambient conditions.
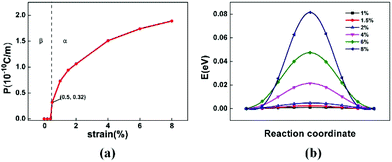 | ||
| Fig. 5 (a) The polarization P as a function of the applied biaxial tensile strain. (b) The ferroelectric switching pathway of monolayer tellurene under biaxial tensile strain. | ||
Conclusions
In conclusion, based on first-principles calculations, the structures and electronic properties of monolayer tellurene under different biaxial strains have been investigated. Our calculations show that a β- to α-phase transition would occur when the strain increases to 0.5%. The strain-induced phase transition is attributed to the weakening of the centre–outer bond strength and atom migration corresponding to the TOy phonon mode vibration at the gamma point. While the strain increases the distance between the centre and outer layer Te atoms and weakens the centre–outer bond strength for the β-phase, the TOy phonon modes induce a β- to α-phase transition. The strains also lead to shifts of the VBM and the CBM in the electronic band structure, leading to a direct to indirect gap transition. The band gap decreases monotonically with strain in the β-phase. In the α-phase, the band gap increases first and reaches a peak at 4% tensile strain. Due to the non-centrosymmetric property of the α-phase, we observed SOC induced band splitting in the band structure. Moreover, it is transformed into a 2D ferroelectric upon the strain-induced β- to α-phase transition, where the large Rashba splitting may enable the control of spin via ferroelectric switching. A high polarization of about 90 μC cm−2 can be obtained via a biaxial tensile strain of 8%, giving rise to a giant piezoelectric coefficient that can be two orders of magnitude higher than that of the MoS2 monolayer. This giant piezoelectric effect of elemental monolayer tellurene is promising for a broad range of applications such as in nano-sized sensors and energy harvesting using portable electronic devices.Conflicts of interest
There are no conflicts to declare.Acknowledgements
Helpful discussions with Professor Jingtao Lv, Jinlong Ma and Hongyue Song are acknowledged. This work was supported by the National Natural Science Foundation of China (Grant No. 51806072).Notes and references
- Z. Zhu, X. Cai, S. Yi, J. Chen, Y. Dai, C. Niu, Z. Guo, M. Xie, F. Liu, J.-H. Cho, Y. Jia and Z. Zhang, Phys. Rev. Lett., 2017, 119, 106101 CrossRef PubMed.
- J. Qiao, Y. Pan, F. Yang, C. Wang, Y. Chai and W. Ji, Sci. Bull., 2018, 63, 159–168 CrossRef CAS.
- S. Sharma, N. Singh and U. Schwingenschlogl, ACS Appl. Energy Mater., 2018, 1, 1950–1954 CrossRef CAS.
- Z. Gao, F. Tao and J. Ren, Nanoscale, 2018, 10, 12997–13003 RSC.
- Z. Gao, G. Liu and J. Ren, ACS Appl. Mater. Interfaces, 2018, 10, 40702–40709 CrossRef CAS.
- K. Nagashio, T. Nishimura, K. Kita and A. Toriumi, Appl. Phys. Express, 2009, 2, 025003 CrossRef.
- W.-R. Zhong, M.-P. Zhang, B.-Q. Ai and D.-Q. Zheng, Appl. Phys. Lett., 2017, 98, 113107 CrossRef.
- L. D. Xian, A. P. Paz, E. Bianco, P. M. Ajayan and A. Rubio, 2D Mater., 2017, 4, 041003 CrossRef.
- C. S. Lin, W. D. Cheng, G. L. Chai and H. Zhang, Phys. Chem. Chem. Phys., 2018, 20, 24250 RSC.
- W. Zhang, Q. S. Wu, V. Oleg, H. M. Yazyev, Z. Weng, X. Guo, W. D. Cheng and G. L. Chai, Phys. Rev. B, 2018, 98, 115411 CrossRef.
- A. Apte, E. Bianco, A. Krishnamoorthy, S. Yazdi, R. Rao, N. R. Glavin, H. Kumazoe, V. Varshney, A. Roy, K. F. Shimojo, E. Ringe, R. Kalia, A. Nakano, C. S. Tiwary, P. Vashishta, V. Kochat and P. M. Ajayan, 2D Mater., 2019, 6, 015013 CrossRef CAS.
- Y. X. Wang, G. Qiu, R. X. Wang, S. Y. Huang, Q. X. Wang, Y. Y. Liu, Y. C. Du, W. A. Goddard, M. J. Kim, X. F. Xu, P. D. Ye and W. Z. Wu, Nat. Electron., 2018, 1(4), 228–236 CrossRef.
- J. L. Chen, Y. W. Dai, Y. Q. Ma, X. Q. Dai, W. K. Ho and M. H. Xie, Nanoscale, 2017, 9(41), 15945–15948 RSC.
- Z. Xie, C. Xing, W. Huang, T. Fan, Z. Li, J. Zhao, Y. Xiang, Z. Guo, J. Li, Z. Yang, B. Dong, J. Qu, D. Fan and H. Zhang, Adv. Funct. Mater., 2018, 28, 1705833 CrossRef.
- Y. Wang, C. C. Xiao, M. G. Chen, C. Q. Hu, J. D. Zou, C. Wu, J. Z. Jiang, S. Y. A. Yang, Y. H. Lu and W. Ji, Mater. Horiz., 2018, 5(3), 521–528 RSC.
- R. G. Amorim, X. Zhong, S. Mukhopadhyay, R. Pandey, A. R. Rocha and S. P. Karna, J. Phys.: Condens. Matter, 2013, 25, 195801 CrossRef PubMed.
- X. Gu, Y. Wei, X. Yin, B. Li and R. Yang, Rev. Mod. Phys., 2018, 90(4), 041002 CrossRef CAS.
- G. Gui, J. Li and J. Zhong, Phys. Rev. B: Condens. Matter Mater. Phys., 2008, 78, 075435 CrossRef.
- C. Si, Z. Sun and F. Liu, Nanoscale, 2016, 8, 3207–3217 RSC.
- Y. Xiang, S. J. Gao, R. G. Xua, W. Z. Wu and Y. S. Leng, Nano Energy, 2019, 58, 202–210 CrossRef CAS.
- G. Kresse and J. Furthmüller, Comput. Mater. Sci., 1996, 6, 15–50 CrossRef CAS.
- G. Kresse and J. Furthmüller, Phys. Rev. B: Condens. Matter Mater. Phys., 1996, 54, 11169–11186 CrossRef CAS.
- J. P. Perdew, K. Burke and M. Ernzerhof, Phys. Rev. Lett., 1996, 77, 3865–3868 CrossRef CAS.
- S. J. Grimme, J. Antony, S. Ehrlich and S. Krieg, J. Chem. Phys., 2010, 132, 154104 CrossRef PubMed.
- S. J. Grimme, Comput. Chem., 2004, 25, 1463–1473 CrossRef CAS PubMed.
- H. J. Monkhorst and J. D. Pack, Phys. Rev. B: Condens. Matter Mater. Phys., 1976, 13, 5188–5192 CrossRef.
- A. Togo, F. Oba and I. Tanaka, Phys. Rev. B: Condens. Matter Mater. Phys., 2008, 78, 134106 CrossRef.
- R. D. King-Smith and D. Vanderbilt, Phys. Rev. B: Condens. Matter Mater. Phys., 1993, 47(3), 1651–1654 CrossRef CAS.
- M. Wu and P. Jena, Wiley Interdiscip. Rev.: Comput. Mol. Sci., 2018, 8(5), e1365 Search PubMed.
- Q. Yang, M. Wu and J. Li, J. Phys. Chem. Lett., 2018, 9(24), 7160–7164 CrossRef CAS.
- M. Wu and X. C. Zeng, Nano Lett., 2017, 17(10), 6309–6314 CrossRef CAS.
- K.-A. N. Duerloo, M. T. Ong and E. J. Reed, Intrinsic Piezoelectricity in Two-Dimensional Materials, J. Phys. Chem. Lett., 2012, 3(19), 2871–2876 CrossRef CAS.
- L. Dong, J. Lou and V. B. Shenoy, Large In-Plane and Vertical Piezoelectricity in Janus Transition Metal Dichalchogenides, ACS Nano, 2017, 11(8), 8242–8248 CrossRef CAS.
- R. Fei, W. Li, J. Li and L. Yang, Giant piezoelectricity of monolayer group IV monochalcogenides: SnSe, SnS, GeSe, and GeS, Appl. Phys. Lett., 2015, 107(17), 173104 CrossRef.
Footnotes |
| † Electronic supplementary information (ESI) available. See DOI: 10.1039/c9nr06507e |
| ‡ These authors contributed equally to this work. |
| This journal is © The Royal Society of Chemistry 2020 |

