 Open Access Article
Ligand exchange reactions on the chiral Au38 cluster: CD modulation caused by the modification of the ligand shell composition†
Ani
Baghdasaryan
 a,
Kévin
Martin
b,
Latévi Max
Lawson Daku
 a,
Maurizio
Mastropasqua Talamo
b,
Narcis
Avarvari
 b and
Thomas
Bürgi
 *a
*a
aDepartment of Physical Chemistry, University of Geneva, 30 Quai Ernest-Ansermet, 1211 Geneva 4, Switzerland. E-mail: thomas.buergi@unige.ch
bMOLTECH-Anjou, UMR 6200, CNRS, UNIV Angers, 2 bd Lavoisier, 49045 ANGERS Cedex, France
First published on 29th July 2020
Abstract
Ligand exchange reactions have become a highly versatile post-synthetic strategy to accurately engineer the ligand shell of atomically precise noble metal nanoclusters. Modifying the chemical structure of the exchanging ligand with chromophore substituents or adding chiral centers allow direct functionalization of the cluster with desired properties. As such, post-functionalized gold nanoclusters with unique physicochemical properties find applications in optoelectronics, catalysis and biomedicine. Herein, we successfully carried out ligand exchange reactions between the chiral Au38(2-PET)24 cluster (both racemic and enantiopure forms) and the helically chiral but configurationally labile 2-thio[4]helicene ligand (TH4). The reaction products with a composition of Au38(2-PET)24−x(TH4)x were analyzed using UV-vis spectroscopy and MALDI mass spectrometry. It was found that up to ten 2-PET ligands can be replaced with the helicene ligand on the cluster surface according to MALDI analysis. Consequently, the UV-vis and CD spectra of the cluster have been strongly affected by the ligand exchange reaction. The intensities of the CD signals of Au38(2-PET)24−x(TH4)x were drastically reduced and red shifted with respect to the reference Au38(2-PET)24 cluster. Moreover, the appearance of the other enantiomer in the HPLC chromatogram revealed the partial racemization of the cluster. DFT calculations were performed and they support the experimental observations and show that the observed chiroptical changes in UV-vis and CD spectra are exchange-site dependent. The calculations also demonstrate that charge transfer (CT) transitions occur between the Au38 cluster and the helicene ligand. Thus the ligand is directly involved in these transitions and contributes to the electronic states comprising those transitions.
Introduction
Recently, ultra-small thiolate-protected gold nanoclusters of the formula Aum(SR)n (<2 nm core diameter) have gained tremendous interest in research due to their unique size-dependent chiroptical properties.1,2 Due to their nano-size regime, the distinctive quantum confinement effects result in a discrete electronic energy band gap structure and molecule-like properties, such as HOMO–LUMO electronic transition, enhanced photoluminescence and intrinsic magnetism.3,4 These unique properties are drastically different from their larger counterparts (nanoparticles) and provide opportunities for developing new applications.5–10 Thus, a detailed characterization of size-dependent electronic properties such as optical absorption spectra,11 circular dichroism (ECD and VCD),12–15 nonlinear optical properties16,17 and photoluminescence,18,19 is a prerequisite to further assess their applications. Among several clusters that have been successfully synthesized and characterized with various physicochemical methods,20,21 the atomically precise Au38(SR)24 cluster has attracted much interest due to its intrinsic metal-based chiral features in a large optical window. Briefly, the structure of an Au38 cluster consists of an Au23 kernel, which is formed by the fusion of two icosahedral Au13 cores having a common Au3 face.22 Moreover, the Au23 core is surrounded by three monomeric (Au–S–Au) and six dimeric (Au–S–Au–S–Au) staples. More importantly, the long staples are organized in a chiral fashion, thus giving rise to strong chiroptical responses.Although atomically precise gold nanoclusters exhibit pronounced chiroptical properties, high stability and catalytic activity, the latter can further be altered by applying post-synthetic functionalization strategies: metal doping and ligand exchange.23 Among this, ligand exchange reactions are especially useful for modifying the protective ligand shell and surface composition in a controlled manner.23 The choice of the exchanging ligand plays a crucial role in altering the chiroptical properties, stability and solubility of the resulting reaction products. Furthermore, it can lead to dramatic changes in the native properties of clusters. In this context, structural distortions upon attaching a new ligand to the cluster surface are highly plausible and even the transformation of clusters has been observed.24,25 Several examples of ligand exchange reactions between the Au38 cluster and chiral 1,1′-binaphthyl-2,2′-dithiol (BINAS),26 [2,2] paracyclophane-4-thiol (PCP-4-SH)27 and achiral thiophenol28 ligands have already been reported. Herein, the reactions led to obvious changes in the UV-vis spectrum associated with the formation of various species. In addition, the modification of the ligand shell composition sometimes induced instability and initiated the decomposition of the cluster in solution. However, recent studies have shown that, depending on the structure of the incoming ligand, the ligand exchange reaction not only is limited to structural and geometrical distortions leading to the formation of mixed ligand shell species in solution, but also causes substantial core-size transformations, thus resulting in the appearance of different clusters in solution.29 For example, a novel Au36 cluster with an unusual fcc-core structure has been synthesized as a result of a harsh etching process in the presence of a new thiol ligand.24,25,30
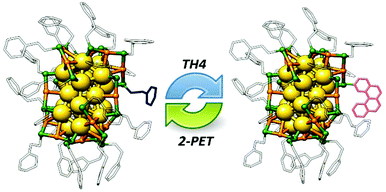
Based on the above-mentioned works, we aimed to study the ligand exchange reaction between the chiral but conformationally labile 2-thio[4]helicene ligand and the Au38(2-PET)24 cluster. The choice and interest in helicenes are justified by several reasons.
First, helicenes are polycyclic aromatic compounds which present a screw-type shape and are analogues of biologically relevant compounds.31 Second, as helical structures, they are intrinsically chiral and possess strong chiroptical properties. Their properties and structures can be tuned by modifying their backbone, attaching functional groups or increasing the number of fused aromatic rings in the structure. The separation of M and P enantiomers of higher helicenes (starting from five membered rings if they are not substituted in position 1, see Fig. S1†) has already been achieved and they possess mirror images of their corresponding electronic CD spectra (ECD).32 However, unlike the higher homologues, the enantiomeric separation of [4]helicene is not possible in solution due to the low racemization barrier (<16 kJ mol−1)33–35 and only the calculated CD spectrum is available.32
Thus, initially, our keen interest was to examine (i) whether the attachment of the 2-thio[4]helicene ligand to the intrinsically chiral and enantiopure cluster would stabilize the chiral configuration of the ligand and whether one configuration would be preferred over the other depending on the cluster's absolute configuration and (ii) whether we would observe changes in UV-vis spectra and enhancement of chiral signals in CD spectra upon incorporation of a chiral yet racemic ligand. This paper aims at answering the addressed questions based on extensive experimental and theoretical data.
Experimental section
Materials
Hydrogen tetrachloroaurate(III) trihydrate (ACS, Alfa Aesar, 99.99%), reduced L-glutathione (Carl Roth AG, ≥98%), sodium borohydride (Aldrich, ≥96%) acetone (Fisher, 99.7%), toluene (Fisher, 99.9%), ethanol (Sigma-Aldrich, >99.8%), methanol (Fisher, 99.9%), 2-phenylethanethiol (Sigma-Aldrich-Fluka, 99+%), dichloromethane (Merck, 99.7+%), nanopure water (>18 MΩ cm), 2-thio[4]helicene ligand (TH4), and 2-thio-2′-bromo[6]helicene ligand (TH6-Br).Synthesis of the chiral Au38(2-PET)24 cluster and the ligand exchange reaction with TH4 and TH6-Br ligands
The Au38(2-PET)24 cluster was synthesized according to the previously established protocol.36 Briefly, 1 g of tetrachloroauric acid trihydrate (HAuCl4·3H2O) dissolved in 50 mL of acetone was mixed with 3.12 g of L-glutathione (GSH) suspension in acetone and the mixture was vigorously stirred for 30 min in an ice bath. Afterwards, freshly prepared and ice-cooled solution of sodium borohydride (960 mg NaBH4 in 30 mL H2O) was added all at once. Immediately, the colour of the reaction mixture changed to dark brown corresponding to the formation of the Aum(GS)n precipitate. The reaction mixture was left to stir at room temperature for 20 min. After that, acetone was decanted, and the crude mixture was washed with methanol several times. Next, the GSH-protected clusters were dissolved in 30 mL of water. 1.6 mL of ethanol as a phase transfer agent together with 10 mL of toluene was also added. Then, 10 mL of 2-phenylethylthiol (2-PET) ligand was added and the crude mixture was left for etching at 80 °C for 4 h. After completion of the reaction, the black precipitate was filtered through a PTFE syringe filter (0.2 μm), extensively washed with methanol to remove excess thiol and other by-products and finally dried using a vacuum rotary evaporator at room temperature.Note that the above described synthesis leads to the formation of a polydisperse mixture of various particles and clusters. The separation of Au38 clusters was completed by size-exclusion chromatography (SEC) using BioBeads SX-1 suspended in toluene.
The synthesis of the TH4 ligand was performed using a two-step procedure starting from 2-bromo[4]helicene37,38 involving first a Stille coupling reaction to introduce the propionitrile protected thiol,39 and then deprotection under basic conditions and acidification (Scheme 1). The detailed description of the synthesis and reaction conditions are given in the ESI.†
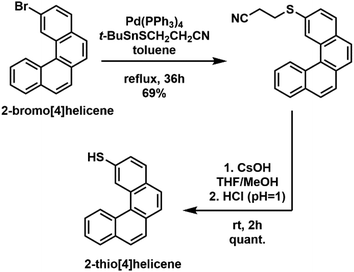 | ||
| Scheme 1 Schematic representation of a two-step synthetic procedure for the preparation of the 2-thio[4]helicene (TH4) ligand. | ||
The synthesis of TH6-Br was performed analogous to that of TH4 starting from 2,2′-dibromo[6]helicene (see details in the ESI†).
The ligand exchange reaction between the chiral Au38(2-PET)24 cluster and the TH4 ligand was carried out under mild reaction conditions(1![[thin space (1/6-em)]](https://www.rsc.org/images/entities/char_2009.gif) :
:![[thin space (1/6-em)]](https://www.rsc.org/images/entities/char_2009.gif) 20, 1
20, 1![[thin space (1/6-em)]](https://www.rsc.org/images/entities/char_2009.gif) :
:![[thin space (1/6-em)]](https://www.rsc.org/images/entities/char_2009.gif) 50 and 1
50 and 1![[thin space (1/6-em)]](https://www.rsc.org/images/entities/char_2009.gif) :
:![[thin space (1/6-em)]](https://www.rsc.org/images/entities/char_2009.gif) 100 cluster/ligand molar ratios, room temperature or at 50 °C, toluene solution, 24 h).
100 cluster/ligand molar ratios, room temperature or at 50 °C, toluene solution, 24 h).
The number of exchanged ligands on the cluster surface was controlled by altering the cluster/ligand molar ratios as well as by heating the solution up to 50 °C.
The ligand exchange reactions of the chiral Au38(2-PET)24 (racemic and enantiopure) cluster with the TH6-Br ligand (racemic and enantiopure) were performed using 1![[thin space (1/6-em)]](https://www.rsc.org/images/entities/char_2009.gif) :
:![[thin space (1/6-em)]](https://www.rsc.org/images/entities/char_2009.gif) 20 cluster/ligand ratios at room temperature. For enantiospecific recognition studies, the exchange reaction between the racemic cluster and M-TH6-Br was followed in situ by HPLC monitoring.
20 cluster/ligand ratios at room temperature. For enantiospecific recognition studies, the exchange reaction between the racemic cluster and M-TH6-Br was followed in situ by HPLC monitoring.
Characterization methods
UV-vis spectra were recorded on a Varian Cary 50 spectrophotometer using a quartz cuvette of 1 cm path length. The spectra were measured in toluene and normalized at 400 nm.CD spectra were recorded on a JASCO J-815 CD-spectrometer using a quartz cuvette of 2 mm path length. The spectra were recorded in diluted solutions of DCM and the signal of the solvent was subtracted. For each spectrum, three scans at a scanning speed of 100 nm min−1 and a data pitch of 0.1 nm were averaged. The spectra were recorded at 20 °C; for temperature control, a JACSO PFD-350S Peltier element was used. Anisotropy factors (ΔA/A) g = θ [mdeg]/(32![[thin space (1/6-em)]](https://www.rsc.org/images/entities/char_2009.gif) 980 × A) were calculated using the ultraviolet-visible spectrum provided by the CD spectrometer.
980 × A) were calculated using the ultraviolet-visible spectrum provided by the CD spectrometer.
MALDI-TOF mass spectra were obtained using a Bruker Autoflex mass spectrometer equipped with a nitrogen laser in positive linear mode. [3-(4-tert-Butylphenyl)-2-methyl-2-propenylidene]-malononitrile (abbreviated DCTB) was used as the matrix with a 1![[thin space (1/6-em)]](https://www.rsc.org/images/entities/char_2009.gif) :
:![[thin space (1/6-em)]](https://www.rsc.org/images/entities/char_2009.gif) 1000 analyte
1000 analyte![[thin space (1/6-em)]](https://www.rsc.org/images/entities/char_2009.gif) :
:![[thin space (1/6-em)]](https://www.rsc.org/images/entities/char_2009.gif) matrix ratio. 2 μl of the analyte/matrix mixture was drop casted on a plate and air-dried.
matrix ratio. 2 μl of the analyte/matrix mixture was drop casted on a plate and air-dried.
Chromatographic HPLC separation of the chiral Au38(2-PET)24 cluster and exchange samples was successfully achieved using a JASCO 20XX HPLC system equipped with a semi-preparative Phenomenex Lux-Cellulose-1 column (5 μm, 250 mm × 10 mm) using the n-hexane![[thin space (1/6-em)]](https://www.rsc.org/images/entities/char_2009.gif) :
:![[thin space (1/6-em)]](https://www.rsc.org/images/entities/char_2009.gif) isopropanol (80
isopropanol (80![[thin space (1/6-em)]](https://www.rsc.org/images/entities/char_2009.gif) :
:![[thin space (1/6-em)]](https://www.rsc.org/images/entities/char_2009.gif) 20) mobile phase at a flow rate of 3 mL min−1. The analytes were detected with a JASCO 2077 plus UV detector operated at 300 nm.
20) mobile phase at a flow rate of 3 mL min−1. The analytes were detected with a JASCO 2077 plus UV detector operated at 300 nm.
Computational methods
Density functional theory (DFT)40,41 has been applied for the optimization of geometries of Au38 clusters: the optimizations have been performed with the ADF program package (ADF2017.113 release),42–44 using the dispersion-corrected PBE-D3 functional45,46 combined with the Slater-type (STO) basis set from the ADF basis set database.47 The Au and H atoms were thus described with the DZ basis sets of double-zeta quality and the other atoms with the DZP basis set of double-zeta polarized quality. The atomic core levels were kept frozen up to the 4f level for the Au atoms, and up to the 1s level for the S and C atoms. The calculations were run spin-restricted and the scalar relativistic (SR) effects were included within the zero-order regular approximation (ZORA).48,49The low-energy parts of the absorption and CD spectra of the [Au38(SCH3)24] model cluster have been characterized by computing using the PBE functional: the energies, and oscillator and rotatory strengths of its 300 lowest-lying dipole-allowed electronic excitations within the linear response theory in time-dependent DFT (TDDFT) as implemented in ADF.50–53 The same electronic excitation calculations were also performed within the tight-binding approximation to TDDFT (TDDFT-TB),54 using also the results of the PBE ground state calculations. For the CD spectra, the calculation of the rotatory strengths only requires as input the ground-state molecular orbitals (MOs) and the solutions of the Casida equations obtained exactly or within whichever approximation, as is actually also the case for the calculation of the oscillator strengths. Thus, within TDDFT-TB, the solutions of the approximated Casida equations54 and the ground-state MOs are used to compute the oscillator strengths54 and also the rotatory strengths and electric and magnetic transition dipole moments as described in ref. 52 and 53. A good agreement is observed between the TDDFT and TDDFT-TB results obtained for [Au38(SCH3)24] (see below). Consequently, using the PBE functional, the computationally less demanding TDDFT-TB method was employed for the characterization of the 1500 lowest-lying dipole-allowed electronic excitations of the [Au38(SCH3)24] and [Au38(SCH3)23(TH4)] model clusters. The scalar-relativistic effects were included in the electronic excitation calculations, which were all performed using the ADF2019.107 version of the ADF program package.
Results and discussion
In general, the concept of ligand exchange reaction relies on tuning the chiroptical properties of the native cluster and introducing new functionalities by carefully choosing appropriate functional ligands. Since the thiol TH4 ligand is intrinsically chiral, one could expect a change in the CD signals of the Au38 cluster after the ligand exchange reaction, in case of enantiomeric selection of the ligand.However, as TH4 is configurationally labile, the ligand was always in the racemic form in solution during the ligand exchange process with both racemic and enantiopure clusters. The ligand exchange reaction between the intrinsically chiral Au38(2-PET)24 cluster (racemic mixture) and the TH4 ligand was carried out at 50 °C by using different cluster/ligand molar ratios (1![[thin space (1/6-em)]](https://www.rsc.org/images/entities/char_2009.gif) :
:![[thin space (1/6-em)]](https://www.rsc.org/images/entities/char_2009.gif) 20, 1
20, 1![[thin space (1/6-em)]](https://www.rsc.org/images/entities/char_2009.gif) :
:![[thin space (1/6-em)]](https://www.rsc.org/images/entities/char_2009.gif) 50 and 1
50 and 1![[thin space (1/6-em)]](https://www.rsc.org/images/entities/char_2009.gif) :
:![[thin space (1/6-em)]](https://www.rsc.org/images/entities/char_2009.gif) 100). Note that one incoming TH4 ligand exchanges with one 2-PET ligand leading to the formation of clusters with Au38(2-PET)24−x(TH4)x composition as shown in Scheme 2.
100). Note that one incoming TH4 ligand exchanges with one 2-PET ligand leading to the formation of clusters with Au38(2-PET)24−x(TH4)x composition as shown in Scheme 2.
First, two initial cluster/ligand ratios (1![[thin space (1/6-em)]](https://www.rsc.org/images/entities/char_2009.gif) :
:![[thin space (1/6-em)]](https://www.rsc.org/images/entities/char_2009.gif) 50 and 1
50 and 1![[thin space (1/6-em)]](https://www.rsc.org/images/entities/char_2009.gif) :
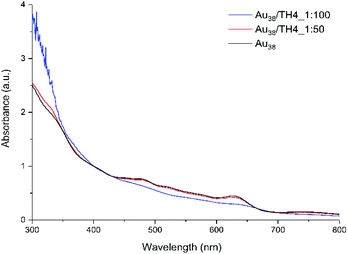
:![[thin space (1/6-em)]](https://www.rsc.org/images/entities/char_2009.gif) 100) were used to study the effect of the ligand concentration on the total number of exchange products on the cluster surface. Preliminary analyses (not shown) showed that high concentrations of helical ligand (above 10 equivalents) are necessary to drive the ligand exchange reaction forward and thus, two concentrations as mentioned above were used. The UV-vis spectrum of the Au38(2-PET)24 cluster before the reaction was recorded to be further used as the reference. According to the UV-vis results shown in Fig. 1, the spectrum of 1
100) were used to study the effect of the ligand concentration on the total number of exchange products on the cluster surface. Preliminary analyses (not shown) showed that high concentrations of helical ligand (above 10 equivalents) are necessary to drive the ligand exchange reaction forward and thus, two concentrations as mentioned above were used. The UV-vis spectrum of the Au38(2-PET)24 cluster before the reaction was recorded to be further used as the reference. According to the UV-vis results shown in Fig. 1, the spectrum of 1![[thin space (1/6-em)]](https://www.rsc.org/images/entities/char_2009.gif) :
:![[thin space (1/6-em)]](https://www.rsc.org/images/entities/char_2009.gif) 50 cluster/ligand molar ratio perfectly matches with the reference. No obvious changes are evident in the absorption spectrum after the ligand exchange reaction between the leaving 2-PET ligand and the incoming TH4 ligand.
50 cluster/ligand molar ratio perfectly matches with the reference. No obvious changes are evident in the absorption spectrum after the ligand exchange reaction between the leaving 2-PET ligand and the incoming TH4 ligand.
Yet, several exchanged species were formed in the solution according to MALDI analysis (to be discussed later). However, when the concentration of the ligand was increased (100 equivalents with respect to the cluster), the characteristic absorption fingerprints of the cluster became less expressed at higher wavelengths. Additionally, at lower wavelengths, i.e. below 400 nm, a strong increase in absorbance was observed which is mostly ascribed to the TH4 ligand (Fig. S1A†).
According to MALDI analyses (Fig. 2), up to three TH4 ligands were successfully exchanged on the cluster surface. The mass difference between the incoming ligand and the leaving ligand is about m/z 123 thus giving rise to a mass spectrum with equally spaced (Δm = 123) peaks corresponding to the addition of TH4 ligands to the parent cluster. From the mass spectrum the average exchange number can be calculated.
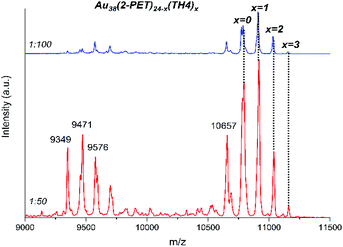 | ||
Fig. 2 MALDI analyses of the samples after ligand exchange reactions using 1![[thin space (1/6-em)]](https://www.rsc.org/images/entities/char_2009.gif) : :![[thin space (1/6-em)]](https://www.rsc.org/images/entities/char_2009.gif) 50 and 1 50 and 1![[thin space (1/6-em)]](https://www.rsc.org/images/entities/char_2009.gif) : :![[thin space (1/6-em)]](https://www.rsc.org/images/entities/char_2009.gif) 100 cluster/ligand molar ratios. The exchanged species are represented by the symbol “x”. 100 cluster/ligand molar ratios. The exchanged species are represented by the symbol “x”. | ||
By doing so, ![[x with combining macron]](https://www.rsc.org/images/entities/i_char_0078_0304.gif) = 0.87 and
= 0.87 and ![[x with combining macron]](https://www.rsc.org/images/entities/i_char_0078_0304.gif) = 0.93 were calculated for 1
= 0.93 were calculated for 1![[thin space (1/6-em)]](https://www.rsc.org/images/entities/char_2009.gif) :
:![[thin space (1/6-em)]](https://www.rsc.org/images/entities/char_2009.gif) 50 and 1
50 and 1![[thin space (1/6-em)]](https://www.rsc.org/images/entities/char_2009.gif) :
:![[thin space (1/6-em)]](https://www.rsc.org/images/entities/char_2009.gif) 100 cluster/ligand molar ratios respectively (Table S1†). We noted that depending on the ionization (laser) power of the mass spectrometer, the relative intensities of the most abundant species in the sample varied; however, the maximal exchange number of the TH4 ligand has not been much affected.
100 cluster/ligand molar ratios respectively (Table S1†). We noted that depending on the ionization (laser) power of the mass spectrometer, the relative intensities of the most abundant species in the sample varied; however, the maximal exchange number of the TH4 ligand has not been much affected.
Besides our efforts to minimize the fragmentation of the sample under applied ionization power, different fragments reached the detector and were carefully examined. As such, the mass difference between m/z 9458 and the parent peak at m/z 10![[thin space (1/6-em)]](https://www.rsc.org/images/entities/char_2009.gif) 778 is +1336 which corresponds to the very well-known cyclic Au4(2-PET)4 fragment typical for all gold clusters.55 It is believed that a tetrameric fragment unit is formed from the staple motifs56 and thus provides valuable information about the surface composition. It is especially very useful for the analysis of a mixed ligand shell cluster.
778 is +1336 which corresponds to the very well-known cyclic Au4(2-PET)4 fragment typical for all gold clusters.55 It is believed that a tetrameric fragment unit is formed from the staple motifs56 and thus provides valuable information about the surface composition. It is especially very useful for the analysis of a mixed ligand shell cluster.
Hence, the presence of these fragments incorporating a TH4 ligand such as Au4(2-PET)3TH4, Au4(2-PET)2(TH4)2, Au4(2-PET)(TH4)3 and Au4(TH4)4 was highly anticipated in the mass spectrum. A careful inspection of the mass spectrum at very low m/z range (1200–1900) for the sample containing up to 3 exchanged species (1/100 cluster/ligand ratio, top panel in Fig. 2) shows the formation of Au4(2-PET)4−x(TH4)x substituted cyclic species with x = 0–2 (Fig. S2†). Note that higher substituted fragments (x = 3, 4) were also detected for the samples containing more TH4 ligands on the surface (not shown).
Furthermore, up to nine TH4 ligands (![[x with combining macron]](https://www.rsc.org/images/entities/i_char_0078_0304.gif) = 4.3) were exchanged with 2-PET ligands on the Au38 cluster when leaving the reaction to proceed for longer times, on a large scale of starting reactants (Fig. S3†). In general, a maximum of ten TH4 ligands can be adsorbed onto the cluster (to be discussed later). Further changes in the reaction conditions did not lead to further exchange. In particular it was not possible to prepare a cluster with 24 TH4 ligands. Possibly, the limitation in having more TH4 ligands contributing to the final composition of the mixed ligand shell can be explained considering the rigidity and bulkiness of the TH4 ligand. In fact, the more TH4 ligands adsorbed onto the cluster surface, the more sterically hindered the neighbouring ligands become. This, on the other hand, vastly decreases the spatial distances between adjacent ligands and thus the repulsion between them becomes at some point unavoidable. As a matter of fact, the decomposition of the cluster due to the induced instability on the surface can take place. Indeed, we have noticed the formation of a thin plasmonic layer and insoluble by-products around the flask after the ligand exchange reaction when a bigger amount of TH4 ligands was introduced into the reaction mixture.
= 4.3) were exchanged with 2-PET ligands on the Au38 cluster when leaving the reaction to proceed for longer times, on a large scale of starting reactants (Fig. S3†). In general, a maximum of ten TH4 ligands can be adsorbed onto the cluster (to be discussed later). Further changes in the reaction conditions did not lead to further exchange. In particular it was not possible to prepare a cluster with 24 TH4 ligands. Possibly, the limitation in having more TH4 ligands contributing to the final composition of the mixed ligand shell can be explained considering the rigidity and bulkiness of the TH4 ligand. In fact, the more TH4 ligands adsorbed onto the cluster surface, the more sterically hindered the neighbouring ligands become. This, on the other hand, vastly decreases the spatial distances between adjacent ligands and thus the repulsion between them becomes at some point unavoidable. As a matter of fact, the decomposition of the cluster due to the induced instability on the surface can take place. Indeed, we have noticed the formation of a thin plasmonic layer and insoluble by-products around the flask after the ligand exchange reaction when a bigger amount of TH4 ligands was introduced into the reaction mixture.
Moreover, the increase in the number of helical ligands on the cluster surface has a direct influence on its UV-vis spectrum. Precisely, the absorption bands between 400 and 600 nm flatten and a well-pronounced peak at around 630 nm is even slightly red shifted (with respect to the reference spectrum of Au38, Fig. S4†). Previously, a similar phenomenon has also been observed in the ligand exchange reaction with the dithiol BINAS ligand.28 Even though the characteristic optical fingerprints of Au38 have been diminished, the core size of the cluster has been preserved during the ligand exchange process.
Next, since the optical properties of the cluster are strongly affected by attaching the helical ligand to the cluster, we anticipated changes in the chiroptical properties of the cluster.
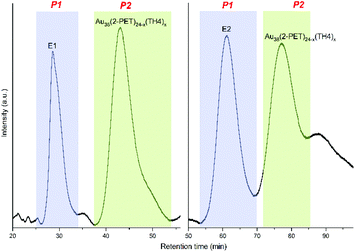
To test our hypothesis, first, the left-handed (E1) and right-handed (E2) enantiomers of the chiral Au38(2-PET)24 cluster were separated by HPLC according to the previously described protocol.57 Afterwards, a ligand exchange procedure similar to that mentioned above has been carried out. The only difference is that the ligand exchange was performed at room temperature to avoid the racemization of the cluster.58 Moreover, the initial concentration of the TH4 ligand was reduced to 20 equivalents in order to slow down the ligand exchange rate and have less exchanged TH4 on the cluster surface. Besides, we aimed to see the effect of a single helicene on the optical and chiral properties of the cluster. To start with, the reaction products were first characterized by UV-vis spectroscopy and MALDI mass spectrometry. UV-vis analyses (Fig. S5†) do not show any changes in the optical fingerprints of the cluster (similar to what we have observed when using 50 equivalents of TH4 ligand) whereas MALDI showed the appearance of up to 3 exchanged species in the mass spectra at higher m/z for both enantiomers of the cluster (Fig. S6†). The exchanged species Au38(2-PET)24−x(TH4)x (where x is up to 3) were separated from the unreacted parent Au38 cluster with an HPLC system using the same separation protocol and conditions as those reported for the enantioseparation of Au38 (Fig. 3).57
After passing the crude mixture through the SEC column to purify from free ligand, a small volume of the reaction mixture (20 μL) was injected into the chiral HPLC column operating at normal isocratic elution mode.
In the chromatograms, the first peaks associated with the enantiopure cluster were labelled as P1 (25–33 min and 54–70 min for E1 and E2 respectively) whereas the exchanged products of both enantiomers were named P2 (35–52 min and 72–85 min for the exchanged species) (Fig. 3).
Note that the P1 peaks of unreacted enantiomers (E1 and E2) have sharp and symmetrical shapes and elute earlier (short retention times) whereas the P2 peaks of exchanged species remain longer inside the column and have more asymmetrical shapes with a larger peak width. This means that several exchange products are contributing to it and since they are not well resolved, they all come out as a single peak at higher retention times.
A small broad peak after P2 of the second enantiomer of the cluster has also been observed; unfortunately, further analysis of this peak was not successful. Moreover, new peaks matching well with the HPLC retention profiles of pure enantiomers of the cluster also elute in the chromatogram. Note that the peak of the opposite enantiomer was not present before the reaction (Fig. S7†). Since only enantiopure Au38 was used for each ligand exchange reaction, the appearance of the other enantiomer in the chromatogram indicates the partial racemization of the cluster. It was previously shown58 that the racemization of the enantiopure Au38(2-PET)24 cluster takes place at relatively high temperatures, i.e. 50 °C and above. Our result indicates that the adsorbed TH4 ligand accelerates the racemization of the cluster thus leading to appreciable racemization even at room temperature. However, we cannot draw a definitive conclusion about that since no systematic studies on the racemization of the cluster after the ligand exchange reaction have been performed. Recently, Malola et al. proposed a mechanism for the racemization of Au38 based on calculations which involves the reconstruction of the metallic core without breaking a Au–S bond.59 In this case, it is possible that the adsorption of the TH4 ligand onto the cluster surface accelerates the rotation of the three Au atoms at the pole of the cluster resulting in the rearrangement of long staple motifs into the opposite enantiomer. Furthermore, we cannot exclude the possibility that the TH4 ligand present in the racemic mixture plays a role in racemization of the cluster. However, to draw definitive conclusions, one would need to study the effect of enantiopure TH4 on the racemization of the cluster, which, unfortunately, is not possible with the TH4 ligand (as mentioned in the introduction). Possibly, the influence of the ligand on the electronic structure of the cluster plays a role in this process.
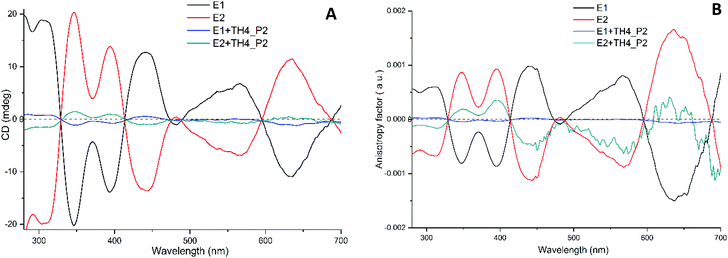
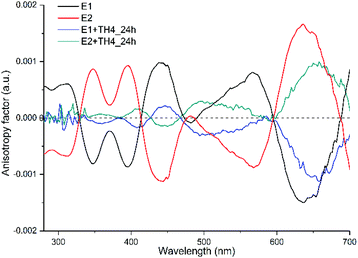
If our hypothesis is correct, one would expect to see changes and variations in the CD spectrum. For that, P2 peaks were collected repeatedly after each injection step and analysed by CD spectroscopy (Fig. 4A). The calculated CD spectrum of a non-functionalized M-[4]helicene has several negative and positive bands all positioned below 330 nm.32 Since the cluster itself has a strong absorption below 300 nm, the contribution of the exchanged TH4 ligand to the chiral signals of the cluster are obscured. Nonetheless, the metal-based CD responses in the visible region of the spectrum are drastically decreased when compared with the reference cluster. However, the intensity does not reach the zero value and both spectra are still mirror images to each other. The characteristic transitions at around 350, 400, 450, 570 and 630 nm are still recognizable. Since the intensity of CD signals is concentration dependent, to make the comparison more trustworthy, the concentration factor was excluded by calculating the anisotropy factor g for each enantiopure sample (Fig. 4B). The g factors of the exchange species of the first enantiomer (E1) were hugely affected and became very weak. As shown in Fig. S6,† MALDI analyses show more exchanged species with higher intensities for the first enantiomer. Although the same reaction conditions were applied for the ligand exchange reactions with both enantiomers of the cluster, it is not surprising, in our experience, that different exchange rates are observed for different experiments, which explains the observed changes and variations in the intensity of the CD spectra and in the total exchange number (as evidenced from MALDI in Fig. S6†), as well as the lack of mirror symmetry in g factor curves shown in Fig. 4B. This on the other hand indicates that, as one can anticipate, the influence on the electronic structure of the cluster increases with the increasing number of helicene ligands in its ligand shell.
To further corroborate this, another ligand exchange reaction was carried out under modified reaction conditions. Specifically, a higher ligand to cluster ratio was used (100![[thin space (1/6-em)]](https://www.rsc.org/images/entities/char_2009.gif) :
:![[thin space (1/6-em)]](https://www.rsc.org/images/entities/char_2009.gif) 1) and the reaction mixture was left to stir for 24 h at room temperature. As we have seen before, the UV-vis spectra of each enantiomeric sample showed less expressed features in the visible region (not shown). The MALDI mass spectrum shows up to ten exchanged species (
1) and the reaction mixture was left to stir for 24 h at room temperature. As we have seen before, the UV-vis spectra of each enantiomeric sample showed less expressed features in the visible region (not shown). The MALDI mass spectrum shows up to ten exchanged species (![[x with combining macron]](https://www.rsc.org/images/entities/i_char_0078_0304.gif) = 3 and
= 3 and ![[x with combining macron]](https://www.rsc.org/images/entities/i_char_0078_0304.gif) = 2.4 for the first and the second enantiomers respectively) in both samples (Fig. S8†).
= 2.4 for the first and the second enantiomers respectively) in both samples (Fig. S8†).
When the anisotropy factors g of the exchanged products are compared with that of the reference enantiopure cluster, not only the intensities of the peaks drop down (for some peaks drastically), but surprisingly almost all the peaks are red shifted (Fig. 5 and Table 1). Besides, the peak at around 570 nm for E2 of the cluster, which is blue shifted by about 73 nm after ligand exchange, even switched its sign with respect to the parent cluster. To further corroborate our findings and pinpoint the effect of the helical ligand on the chiroptical properties of the cluster, we have performed another set of ligand exchange reactions using the racemic and enantiopure TH6-Br ligand (Fig. S1B–D†). Unlike TH4, TH6-Br is quite rigid, has significantly high racemization barrier (ca. 157 kJ mol−1)34 and thus can be obtained in the enantiopure form.
![[thin space (1/6-em)]](https://www.rsc.org/images/entities/char_2009.gif) :
:![[thin space (1/6-em)]](https://www.rsc.org/images/entities/char_2009.gif) 100 cluster/ligand molar ratios were used for the ligand exchange reaction
100 cluster/ligand molar ratios were used for the ligand exchange reaction
| Enantiomer 2 (E2) | E2 + TH4 | ||
|---|---|---|---|
| Wavelength (nm) | g factor (a.u.) | Wavelength (nm) | g factor (a.u.) |
| 348 | 8.6 × 10⁻⁴ | 359 | 6.51 × 10⁻⁵ |
| 395 | 9.12 × 10⁻⁴ | 408 | 1.64 × 10⁻⁴ |
| 444 | −1.1 × 10⁻³ | 445 | −1.4 × 10⁻⁴ |
| 568 | −8.7 × 10 −4 | 495 | 2.86 × 10 −4 |
| 636 | 1.6 × 10⁻³ | 655 | 9.48 × 10⁻⁴ |
The following ligand exchange reactions were performed at room temperature with a 1![[thin space (1/6-em)]](https://www.rsc.org/images/entities/char_2009.gif) :
:![[thin space (1/6-em)]](https://www.rsc.org/images/entities/char_2009.gif) 20 cluster/ligand ratio: (i) enantiopure Au38(2-PET)24 with racemic TH6-Br (noted as E1/E2 + racTH6-Br) and (ii) racemic Au38(2-PET)24 with enantiopure TH6-Br (noted as racAu38(2-PET)24 + M-TH6-Br). Note, in the latter case only M-TH6-Br was studied (due to the availability of the M-form of the ligand). As evidenced from the UV-vis spectra of E1/E2 + racTH6-Br (Fig. S9†), after 20 h of reaction, a slight increase in absorbance at ca. 350 nm was observed which is mostly ascribed to the helical ligand. MALDI showed on average
20 cluster/ligand ratio: (i) enantiopure Au38(2-PET)24 with racemic TH6-Br (noted as E1/E2 + racTH6-Br) and (ii) racemic Au38(2-PET)24 with enantiopure TH6-Br (noted as racAu38(2-PET)24 + M-TH6-Br). Note, in the latter case only M-TH6-Br was studied (due to the availability of the M-form of the ligand). As evidenced from the UV-vis spectra of E1/E2 + racTH6-Br (Fig. S9†), after 20 h of reaction, a slight increase in absorbance at ca. 350 nm was observed which is mostly ascribed to the helical ligand. MALDI showed on average ![[x with combining macron]](https://www.rsc.org/images/entities/i_char_0078_0304.gif) = 0.23 and
= 0.23 and ![[x with combining macron]](https://www.rsc.org/images/entities/i_char_0078_0304.gif) = 0.1 exchanged TH6-Br ligand on the surface of E1 and E2, respectively (Fig. S10†). On the same note, slight differences were observed in the CD spectra and in the corresponding anisotropy factors g after the attachment of helicenes (Fig. S11†). When a similar ligand exchange reaction between the racemic cluster and the enantiopure ligand was monitored in situ by using the HPLC technique, here, enantiospecific recognition behaviour was clearly observed especially during the early stages of the exchange process (Fig. S12A†). In brief, after the addition of M-TH6-Br, the intensity of E1 drops down by 30% and additional peaks (P1 and P2) appear at slightly higher retention times. At the same time, the intensity of E2 drops down by 14%. P3 peak appears after 7.5 h of reaction. The plot of peak areas vs. retention times clearly shows that the ligand exchange is much faster and preferable for E1 at earlier reaction times (5 h, Fig. S12B†). At longer reaction times the quantitative analysis is complicated since one of the products has actually the same retention time as the parent cluster on the HPLC column. More interestingly, the areas of P1 and P3 increase very slowly and have similar kinetic profiles, whereas P2 increases much faster and probably contains the exchange species of both E1 and E2 (based on the changes in the enantiomer areas). It is possible that P1 and P3 correspond to one exchange and P2 to higher exchange species or they correspond to isomers (different exchange positions on the cluster). Furthermore, the UV-vis spectra after HPLC monitoring (before passing through the SEC column to get rid of free ligand and after SEC) show the diminishing of the cluster's native optical fingerprints at higher wavelengths (Fig. S13A†). In contrast, at lower wavelengths (around 350 nm) an additional peak appears which originates from the adsorbed ligand. Moreover, MALDI mass spectrometry shows the formation of up to two exchange species with an average exchange number (
= 0.1 exchanged TH6-Br ligand on the surface of E1 and E2, respectively (Fig. S10†). On the same note, slight differences were observed in the CD spectra and in the corresponding anisotropy factors g after the attachment of helicenes (Fig. S11†). When a similar ligand exchange reaction between the racemic cluster and the enantiopure ligand was monitored in situ by using the HPLC technique, here, enantiospecific recognition behaviour was clearly observed especially during the early stages of the exchange process (Fig. S12A†). In brief, after the addition of M-TH6-Br, the intensity of E1 drops down by 30% and additional peaks (P1 and P2) appear at slightly higher retention times. At the same time, the intensity of E2 drops down by 14%. P3 peak appears after 7.5 h of reaction. The plot of peak areas vs. retention times clearly shows that the ligand exchange is much faster and preferable for E1 at earlier reaction times (5 h, Fig. S12B†). At longer reaction times the quantitative analysis is complicated since one of the products has actually the same retention time as the parent cluster on the HPLC column. More interestingly, the areas of P1 and P3 increase very slowly and have similar kinetic profiles, whereas P2 increases much faster and probably contains the exchange species of both E1 and E2 (based on the changes in the enantiomer areas). It is possible that P1 and P3 correspond to one exchange and P2 to higher exchange species or they correspond to isomers (different exchange positions on the cluster). Furthermore, the UV-vis spectra after HPLC monitoring (before passing through the SEC column to get rid of free ligand and after SEC) show the diminishing of the cluster's native optical fingerprints at higher wavelengths (Fig. S13A†). In contrast, at lower wavelengths (around 350 nm) an additional peak appears which originates from the adsorbed ligand. Moreover, MALDI mass spectrometry shows the formation of up to two exchange species with an average exchange number (![[x with combining macron]](https://www.rsc.org/images/entities/i_char_0078_0304.gif) ) of 0.66 (Fig. S13B†). Based on the HPLC peak areas 41% of the cluster contains exchange species (both different numbers and positions for the same ligand, see details in the ESI†). In virtue of the above-mentioned results, we can confirm the paramount role of the rigidity of the helical ligand on the chiroptical properties of the Au38 cluster. On the other hand, these results brace the significant differences in two ligands.
) of 0.66 (Fig. S13B†). Based on the HPLC peak areas 41% of the cluster contains exchange species (both different numbers and positions for the same ligand, see details in the ESI†). In virtue of the above-mentioned results, we can confirm the paramount role of the rigidity of the helical ligand on the chiroptical properties of the Au38 cluster. On the other hand, these results brace the significant differences in two ligands.
Previously O. Lopez-Acevedo et al. have studied the electronic and optical properties of the Au38 cluster by DFT computations.12 The computational model satisfactorily reproduced the experimental CD spectrum and made the assignment of peaks at low energy possible. As such it has been shown that the peaks between 0.9 and 1.4 eV (1377 and 886 nm) arise from the combination of several metal-based HOMO–LUMO transitions. The high energy transitions at 1.6–2.2 eV (775–564 nm) include contributions from the ligand shell. Possibly the changes in the intensity and the sign especially for the peak at 568 nm is due to the TH4 ligand which influences the excitations out of the lower energy ligand orbitals.
Thus, based on the results we have presented so far, we can conclude that the ligand exchange reaction between the 2-PET and TH4 ligands leads to partial racemization of the enantiopure cluster as well as causes some changes in the electronic structure of the cluster. Going back to the question we addressed in the beginning, no preference for one enantiomer of the adsorbed TH4 helicene on the chiral cluster could be evidenced. However, we have performed additional DFT calculations with the objective to probe the extent to which the optical properties of the cluster evolve upon substitution of one ligand and to explore whether these changes depend on where the ligand exchange reactions take place at the cluster surface. Based on the crystal structure, the Au38 cluster consists of four symmetry unique sites: three on the long staples and one on the short staple at the waist. Thus, for a mono-exchanged species there are only four possible isomers (regioisomers). However, the number of possible regioisomers increases when increasing the number of exchanged ligands (e.g. 46 possible isomers upon the attachment of the second ligand). Considering the huge number of possible isomers upon the attachment of the TH4 ligand, to make the calculations possible, only a mono-exchanged species was considered for further calculations.
DFT calculations
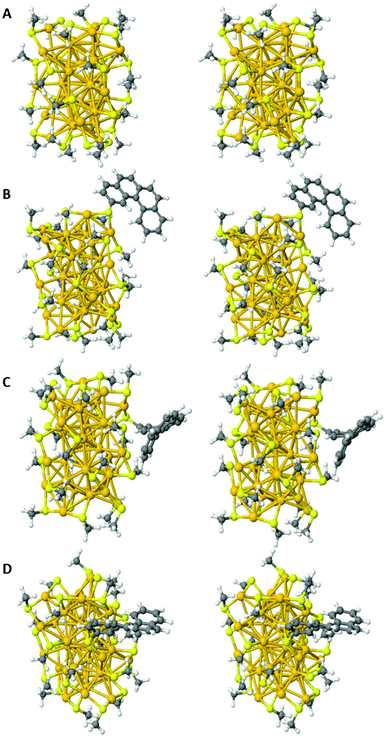
Fig. 6 shows the optimized gas-phase structure of [Au38(SCH3)24] and those of the three representative regioisomers of [Au38(SCH3)23(TH4)] retained for this study.
The atomic coordinates are available in the ESI† (XYZ format).
A comparison of the electronic energies of the regioisomers shows that the regioisomer A is the most stable, B and C lying higher in energy by only 492 cm−1 and 449 cm−1, respectively.
Chiroptical properties
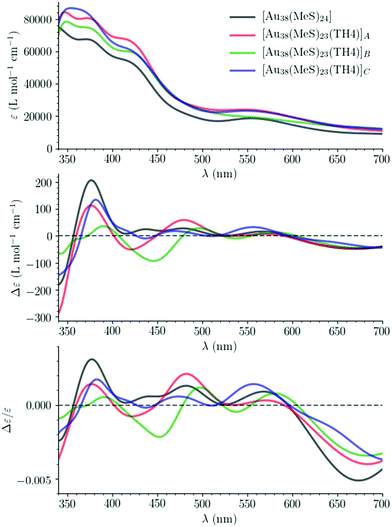
Using the TDDFT-TB results for the 1500 lowest-lying dipole-allowed transitions, the absorption and CD spectra of [Au38(SCH3)24] have also been simulated. They are plotted along with the associated anisotropy factor in Fig. S16 and S17† as a function of transition energy and wavelength, respectively. A good agreement is observed between the curves predicted from the TDDFT-TB results and the experimental results (Fig. S18†).57 This agreement and the one previously observed between the spectra obtained using the TDDFT and TDDFT-TB results validate the use of the TDDFT-TB method for characterizing the chiroptical properties of Au38 clusters over an energy range as large as the one shown in Fig. S16.†
Comparison of the chiroptical properties of [Au38(SCH3)24] and [Au38(SCH3)24(TH4)] clusters
The simulated absorption and CD spectra of [Au38(SCH3)24] and the regioisomers of [Au38(SCH3)23(TH4)] are plotted in Fig. S19† and Fig. 7 as a function of transition energy and wavelength, respectively. Noticeable changes in the absorption and CD spectra are observed upon ligand exchange. These changes depend on the site where the exchange takes place. These changes are emphasized by the plots in Fig. S20 and S21† of the differences between the simulated absorption and CD spectra of [Au38(SCH3)23(TH4)] clusters and those of the [Au38(SCH3)24] cluster taken as the reference.Charge-transfer transitions between the Au38 cluster and the TH4 ligand
Charge transfer (CT) transitions are expected to occur between the Au38 cluster and the TH4 ligand and to involve the π orbitals of the latter. This can be seen by inspecting the transitions between natural transition orbitals (NTOs).60To ease and make efficient the identification of such CT transitions in the three isomers, TDDDF-TB calculations have been performed again using as the basis set the molecular orbitals of [Au38(SCH3)23]+ and TH4− fragments, and computing for their 1500 transitions the statistical descriptors proposed by Plasser and Lischka.61 The descriptor of interest to us here is the charge transfer character (CT) which varies between 0 (for locally excited or Frenkel excitonic states) and 1 (for completely charge separated states). For the three isomers, the calculated CT is in the range of 0.0–0.5; the features of their five transitions having the highest CT are summarized in Tables S2–S4.† A LibreOffice spreadsheet summarizing the features of the characterized 1500 electronic transitions for each isomer, i.e. their energies and wavelengths, their oscillator and rotatory strengths, and selected statistical descriptors, is provided in the ESI.
Conclusions
We have shown that the ligand exchange reaction between the intrinsically chiral Au38(2-PET)24 cluster and the TH4 ligand resulted in the formation of up to ten exchanged species with a composition of Au38(2-PET)24−x(TH4)x. The adsorption of the helical ligand resulted in obvious changes in the optical spectrum of the cluster. The diminishing of the intensity of UV-vis bands and even the red shift of some electronic transitions at higher ligand concentrations indicate changes in the electronic structure upon ligand exchange reaction although the core size of the cluster has been preserved. HPLC monitoring of the reaction and separation of the enantiopure exchange products from their native cluster showed the appearance of the other enantiomer of the cluster in the solution. Thus, the ligand exchange reaction leads to partial racemization of the cluster. On the other hand, the adsorption of the TH4 ligand significantly changes the CD line shapes and even causes the inversion of the sign of some peaks. With the exploratory computational study, we have shown that (i) the substitution of an achiral CH3S-ligand in the [Au38(SCH3)24] model cluster by the chiral 2-thio[4]helicene ligand translates into noticeable changes in the absorption and CD spectra of the Au38 cluster, and that these changes depend on the site where the substitution takes place and (ii) there are charge transfer transitions between the Au38 cluster and the helicene ligand.Conflicts of interest
There are no conflicts to declare.Acknowledgements
Financial support from the Swiss National Science Foundation (Grant 200020_172511) and the University of Geneva is kindly acknowledged. Financial support in France by the CNRS, the University of Angers, the Région Pays de la Loire through the RFI LUMOMAT (grants to K. M. and M. M. T.), the National Agency for Research (ANR, Project 15-CE29-0006-01 ChiraMolCo) and the French Ministry of Foreign Affairs through the Germaine de Staël (PHC Project 39483PL) project is gratefully acknowledged. LDLM acknowledges a grant from the Swiss National Supercomputing Centre (CSCS) under project ID s894.References
- R. Jin, C. Zeng, M. Zhou and Y. Chen, Chem. Rev., 2016, 116, 10346–10413 CrossRef CAS PubMed.
- I. Chakraborty and T. Pradeep, Chem. Rev., 2017, 117, 8208–8271 CrossRef CAS PubMed.
- O. Varnavski, G. Ramakrishna, J. Kim, D. Lee and T. Goodson, J. Am. Chem. Soc., 2010, 132, 16–17 CrossRef CAS PubMed.
- M. C. M. Daniel and D. Astruc, Chem. Rev., 2004, 104, 293–346 CrossRef CAS PubMed.
- N. L. Rosi, D. A. Giljohann, C. S. Thaxton, A. K. R. Lytton-Jean, M. S. Han and C. A. Mirkin, Science, 2006, 312, 1027–1030 CrossRef CAS PubMed.
- N. T. Kim Thanh and Z. Rosenzweig, Anal. Chem., 2002, 74, 1624–1628 CrossRef PubMed.
- C. M. Niemeyer, Angew. Chem., Int. Ed., 2001, 40, 4128–4158 CrossRef CAS PubMed.
- H. Wohltjen and A. W. Snow, Anal. Chem., 1998, 70, 2856–2859 CrossRef CAS.
- N. Zheng and G. D. Stucky, J. Am. Chem. Soc., 2006, 128, 14278–14280 CrossRef CAS PubMed.
- M. Pumera, J. Wang, E. Grushka and R. Polsky, Anal. Chem., 2001, 73, 5625–5628 CrossRef CAS PubMed.
- R. Jin, Nanoscale, 2015, 7, 1549–1565 RSC.
- O. Lopez-Acevedo, H. Tsunoyama, T. Tsukuda, H. Häkkinen and C. M. Aikens, J. Am. Chem. Soc., 2010, 132, 8210–8218 CrossRef CAS PubMed.
- I. Dolamic, B. Varnholt and T. Bürgi, Nat. Commun., 2015, 6, 7117 CrossRef CAS PubMed.
- B. Nieto-Ortega and T. Bürgi, Acc. Chem. Res., 2018, 51, 2811–2819 CrossRef CAS PubMed.
- S. Knoppe and T. Bürgi, Acc. Chem. Res., 2014, 47, 1318–1326 CrossRef CAS PubMed.
- R. Philip, P. Chantharasupawong, H. Qian, R. Jin and J. Thomas, Nano Lett., 2012, 12, 4661–4667 CrossRef CAS PubMed.
- H. Inouye, K. Tanaka, I. Tanahashi and K. Hirao, Phys. Rev. B: Condens. Matter Mater. Phys., 1998, 57, 11334–11340 CrossRef CAS.
- M. Cui, Y. Zhao and Q. Song, TrAC, Trends Anal. Chem., 2014, 57, 73–82 CrossRef CAS.
- X. Qu, Y. Li, L. Li, Y. Wang, J. Liang and J. Liang, J. Nanomater., 2015, 2015, 1–23 Search PubMed.
- H. Häkkinen, M. Walter and H. Grönbeck, J. Phys. Chem. B, 2006, 110, 9927–9931 CrossRef PubMed.
- H. Qian, Y. Zhu and R. Jin, ACS Nano, 2009, 3, 3795–3803 CrossRef CAS PubMed.
- H. Qian, W. T. Eckenhoff, Y. Zhu, T. Pintauer and R. Jin, J. Am. Chem. Soc., 2010, 132, 8280–8281 CrossRef CAS PubMed.
- Y. Niihori, S. Hossain, B. Kumar, L. V. Nair, W. Kurashige and Y. Negishi, APL Mater., 2017, 5, 053201 CrossRef.
- C. Zeng, C. Liu, Y. Pei and R. Jin, ACS Nano, 2013, 7, 6138–6145 CrossRef CAS PubMed.
- A. Das, C. Liu, C. Zeng, G. Li, T. Li, N. L. Rosi and R. Jin, J. Phys. Chem. A, 2014, 118, 8264–8269 CrossRef CAS PubMed.
- S. Knoppe, R. Azoulay, A. Dass and T. Bürgi, J. Am. Chem. Soc., 2012, 134, 20302–20305 CrossRef CAS PubMed.
- L. Beqa, D. Deschamps, S. Perrio, A. C. Gaumont, S. Knoppe and T. Bürgi, J. Phys. Chem. C, 2013, 117, 21619–21625 CrossRef CAS.
- S. Knoppe, A. C. Dharmaratne, E. Schreiner, A. Dass and T. Bürgi, J. Am. Chem. Soc., 2010, 132, 16783–16789 CrossRef CAS PubMed.
- Y. Wang, B. Nieto-Ortega and T. Bürgi, Chem. Commun., 2019, 55, 14914–14917 RSC.
- C. Zeng, H. Qian, T. Li, G. Li, N. L. Rosi, B. Yoon, R. N. Barnett, R. L. Whetten, U. Landman and R. Jin, Angew. Chem., Int. Ed., 2012, 51, 13114–13118 CrossRef CAS PubMed.
- Y. Shen and C. F. Chen, Chem. Rev., 2012, 112, 1463–1535 CrossRef CAS PubMed.
- F. Furche, R. Ahlrichs, C. Wachsmann, E. Weber, A. Sobanski, F. Vögtle and S. Grimme, J. Am. Chem. Soc., 2000, 122, 1717–1724 CrossRef CAS.
- S. Grimme and S. D. Peyerimhoff, Chem. Phys., 1996, 204, 411–417 CrossRef CAS.
- J. Barroso, J. L. Cabellos, S. Pan, F. Murillo, X. Zarate, M. A. Fernandez-Herrera and G. Merino, Chem. Commun., 2017, 54, 188–191 RSC.
- C. Wäckerlin, J. Li, A. Mairena, K. Martin, N. Avarvari and K. H. Ernst, Chem. Commun., 2016, 52, 12694–12697 RSC.
- S. Knoppe, J. Boudon, I. Dolamic, A. Dass and T. Bürgi, Anal. Chem., 2011, 83, 5056–5061 CrossRef CAS PubMed.
- R. H. Martin, J. Moriau and N. Defay, Tetrahedron, 1974, 30, 179–185 CrossRef CAS.
- M. A. Brooks and L. T. Scott, J. Am. Chem. Soc., 1999, 121, 5444–5449 CrossRef CAS.
- T. Biet, A. Fihey, T. Cauchy, N. Vanthuyne, C. Roussel, J. Crassous and N. Avarvari, Chem. – Eur. J., 2013, 19, 13160–13167 CrossRef CAS PubMed.
- P. Hohenberg and W. Kohn, Phys. Rev., 1964, 136, B864–B871 CrossRef.
- W. Kohn and L. J. Sham, Phys. Rev., 1965, 140, A1133–A1138 CrossRef.
- G. te Velde, F. M. Bickelhaupt, E. J. Baerends, C. Fonseca Guerra, S. J. A. van Gisbergen, J. G. Snijders and T. Ziegler, J. Comput. Chem., 2001, 22, 931–967 CrossRef CAS.
- C. Fonseca Guerra, J. G. Snijders, G. Velde and E. J. Baerends, Theor. Chem. Acc., 1998, 99, 391–403 Search PubMed.
- E. J. Baerends, T. Ziegler, A. J. Atkins, J. Autschbach, D. Bashford, O. Baseggio, A. Bérces, F. M. Bickelhaupt, C. Bo, P. M. Boerritger, L. Cavallo, C. Daul, D. P. Chong, D. V. Chulhai, L. Deng, R. M. Dickson, J. M. Dieterich, D. E. Ellis, M. van Faassen, A. Ghysels, A. Giammona, S. J. A. van Gisbergen, A. Goez, A. W. Götz, S. Gusarov, F. E. Harris, P. van den Hoek, Z. Hu, C. R. Jacob, H. Jacobsen, L. Jensen, L. Joubert, J. W. Kaminski, G. van Kessel, C. König, F. Kootstra, A. Kovalenko, M. Krykunov, E. van Lenthe, D. A. McCormack, A. Michalak, M. Mitoraj, S. M. Morton, J. Neugebauer, V. P. Nicu, L. Noodleman, V. P. Osinga, S. Patchkovskii, M. Pavanello, C. A. Peeples, P. H. T. Philipsen, D. Post, C. C. Pye, H. Ramanantoanina, P. Ramos, W. Ravenek, J. I. Rodríguez, P. Ros, R. Rüger, P. R. T. Schipper, D. Schlüns, H. van Schoot, G. Schreckenbach, J. S. Seldenthuis, M. Seth, J. G. Snijders, M. Solà, M. Stener, M. Swart, D. Swerhone, G. te Velde, V. Tognetti, P. Vernooijs, L. Versluis, L. Visscher, O. Visser, F. Wang, T. A. Wesolowski, E. M. van Wezenbeek, G. Wiesenekker, S. K. Wolff, T. K. Woo and A. L. Yakovlev, ADF, SCM, Theoretical Chemistry, Vrije Universiteit, Amsterdam, The Netherlands, https://www.scm.com Search PubMed.
- J. P. Perdew, K. Burke and M. Ernzerhof, Phys. Rev. Lett., 1996, 77, 3865–3868 CrossRef CAS PubMed.
- S. Grimme, J. Antony, S. Ehrlich and H. Krieg, J. Chem. Phys., 2010, 132, 154104 CrossRef PubMed.
- E. Van Lenthe and E. J. Baerends, J. Comput. Chem., 2003, 24, 1142–1156 CrossRef CAS PubMed.
- E. van Lenthe, A. Ehlers and E.-J. Baerends, J. Chem. Phys., 1999, 110, 8943–8953 CrossRef CAS.
- E. van Lenthe, E. J. Baerends and J. G. Snijders, J. Chem. Phys., 1994, 101, 9783–9792 CrossRef CAS.
- M. E. Casida, in Recent Advances in Density Functional Methods, Part I, ed. D. P. Chong, World Scientific, Singapore, 1995, pp. 155–192 Search PubMed.
- S. J. A. van Gisbergen, F. Kootstra, P. R. T. Schipper, O. V. Gritsenko, J. G. Snijders and E. J. Baerends, Phys. Rev. A, 1998, 57, 2556–2571 CrossRef CAS.
- J. Autschbach and T. Ziegler, J. Chem. Phys., 2002, 116, 891–896 CrossRef CAS.
- J. Autschbach, T. Ziegler, S. J. A. Van Gisbergen and E. J. Baerends, J. Chem. Phys., 2002, 116, 6930–6940 CrossRef CAS.
- R. Rüger, E. van Lenthe, T. Heine and L. Visscher, J. Chem. Phys., 2016, 144, 184103 CrossRef PubMed.
- A. Dass, A. Stevenson, G. R. Dubay, J. B. Tracy and R. W. Murray, J. Am. Chem. Soc., 2008, 130, 5940–5946 CrossRef CAS PubMed.
- Y. Zhang, S. Shuang, C. Dong, C. K. Lo, M. C. Paau and M. M. F. Choi, Anal. Chem., 2009, 81, 1676–1685 CrossRef CAS PubMed.
- I. Dolamic, S. Knoppe, A. Dass and T. Bürgi, Nat. Commun., 2012, 3, 798 CrossRef PubMed.
- S. Knoppe, I. Dolamic and T. Bürgi, J. Am. Chem. Soc., 2012, 134, 13114–13120 CrossRef CAS PubMed.
- S. Malola and H. Häkkinen, J. Am. Chem. Soc., 2019, 141, 6006–6012 CrossRef CAS PubMed.
- R. L. Martin, J. Chem. Phys., 2003, 118, 4775–4777 CrossRef CAS.
- F. Plasser and H. Lischka, J. Chem. Theory Comput., 2012, 8, 2777–2789 CrossRef CAS PubMed.
Footnote |
| † Electronic supplementary information (ESI) available: Synthesis procedure of TH4, experimental and calculated absorption and CD spectra, mass spectra and calculated features of selected electronic transitions. See DOI: 10.1039/d0nr03824e |
| This journal is © The Royal Society of Chemistry 2020 |

