Magnetite-like mixed-valence iron ferrimagnetic homohelical chains exhibiting spin canting, spin-flop and field induced SCM like behaviours†
Lin-Lin
Lv
a,
Ying-Xi
Sun
a,
Cui-Xian
Ji
a,
Shuai
Ma
a,
Jian-Wei
Ren
a,
Wei-Wei
Wang
a,
Jiong-Peng
Zhao
 *a,
Zhong-Yi
Liu
*b,
Qing
Lin
*c,
Kaimin
Su
c,
Yun
He
 c and
Fu-Chen
Liu
 *a
*a
aSchool of Chemistry and Chemical Engineering, TKL of Organic Solar Cells and Photochemical Conversion, Tianjin University of Technology, Tianjin, China 300384. E-mail: zhaojp@tjut.edu.cn; fuchenliutj@yahoo.com
bCollege of Chemistry, Key Laboratory of inorganic-organic hybrid Functional Material Chemistry, Tianjin Normal University, Tianjin 300387, China. E-mail: hxxylzy@tjnu.edu.cn
cCollege of Physics and Technology, Guangxi Normal University, Guilin 541004, China. E-mail: elinqing@126.com
First published on 17th October 2019
Abstract
In this work, an Fe3O triangle based helical chain complex [Fe3(μ3-O)(μ-O2CH)6H2O] was assembled in a solvothermal reaction. The complex was a rare polymeric complex bearing charge separation of Fe3+ and Fe2.5+, in which the charge distribution was like that of magnetite. The valence distribution and polymeric nature result in various magnetism behaviours e.g., ferrimagnetism along the chain, canted antiferromagnetic order, spin-flop and field induced SCM like behavior at low temperature.
Mixed valence iron(II,III) complexes have been studied extensively due to their potential applications in magnetic storage, conductivity and small molecule activation.1 Depending on the strength of the electronic interaction between the oxidized Fe3+ and reduced Fe2+ sites, the mixed valence iron complexes could be characterized as Class I, II or III according to the classification of mixed-valence systems by Robin and Day.2 In Class II and Class III systems, the interactions between the donor and acceptor sites could bring interesting features, e.g. ferromagnetic coupling dominated by a double-exchange mechanism3 and dramatic changes of physical properties accompanied by charge ordering transition in mixed valence systems.4 Thus, assembling mixed valence iron(II,III) complexes with specific charge distribution is very important in obtaining materials with multiple functions, especially magnetic properties.
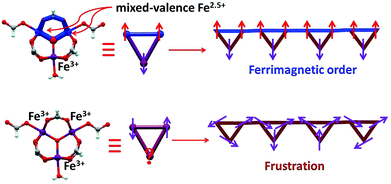
The oxo-centered trinuclear units [Fe3O(RCO2)6(H2O)3]n+ that can bear different valence distributions among the iron ions are a good building block in assembling mixed valence iron complexes.5 However, there are two key points that should be taken into account in practice. First, in order to realize strong interactions between them, the trinuclear units should be connected by coordinated bonds via irons rather than covalent bonds via carboxylates in most cases.6 Second, in the assembly process an appropriate redox environment should be maintained, otherwise trivalent iron complexes are easily produced.7 In this work, we successfully realized a helix chain complex based on a mixed valence oxo magnetic triangle [Fe3(μ3-O)(μ-O2CH)6] as the building block [Fe3(μ3-O)(μ-O2CH)6H2O] (1). In the complex the formate not only plays a role in the construction of the oxo triangle units but also bridges them into a 1D chain. 1 is the first polymeric magnetic triangle based complex bearing valence separation of Fe3+ ions and two Fe2.5+ ions, which is generally reminiscent of the valence distribution of magnetite.8 In Fe3O4, the Fe2.5+ ions in octahedral B sites have ferromagnetic interactions for a double-exchange mechanism; then these are antiferromagnetically coupled to the Fe3+ ions in tetrahedral A sites, leading to a ferromagnetic state.9 Interestingly, like that of magnetite in 1, ferromagnetically coupled Fe2.5+ ions have antiferromagnetic interactions with the Fe3+ ions leading to a ferrimagnetic state. Furthermore, at low temperature, spin canting and field-induced spin-flop are detected in 1 for its 1D nature. Thus, 1 could be considered as a molecule based “magnetite” but with more interesting magnetic behaviors.
1 was obtained by a solvothermal reaction of FeCl3·6H2O in HCOOH and organic amine solutions at 140 °C for 2 days, in which the amines adjust the acidity of the solutions. While reducing the reaction temperature to 80 °C, it produced a chain structural complex [Fe3(μ3-O)(μ-O2CH)7H2O·HO2CH·H2O] (2) with trivalent [Fe3(μ3-O)(μ-O2CH)6] units as the building block. The higher temperature favors the reduction of the Fe3+ ions and produces the mixed valence complex.10
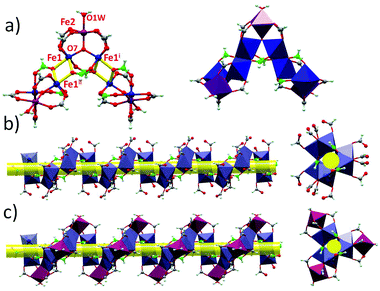
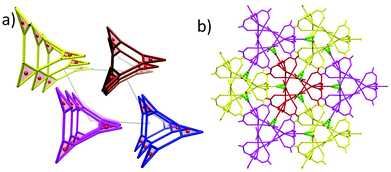
The structures of 1 and 2 are both triangular [Fe3(μ3-O)(μ-O2CH)6] based on 1D chain structures. The asymmetric units of 1 have two Fe ions (Fe1 and Fe2), one O2− anion (O7), one water molecule (O1 W) and three types of formate anions, in which the O2− anion, O1 W and Fe2 locate at the 21 axis. A [Fe3(μ3-O)(μ-O2CH)6] unit is constructed by one O2− anion, two Fe1 ions, one Fe2 ion and six formate anions in a syn,syn mode. The unsaturated sites of Fe2 are occupied by a water molecule, while those of Fe1 are occupied by μ2-O from a formate anion (C atoms in green). This type of formate (C atoms in green) taking the syn,syn,anti mode coordinates to two Fe1 ions (Fe1 and Fe1i) in the same triangle and one Fe1ii in the neighbouring triangle. The other two types of formate anions (C atoms in gray) taking syn,syn modes only coordinate to Fe1 and Fe2 in the same triangles (Fig. 1a). In this way, the syn,syn,anti formate anions bridge Fe1 ions to produce a single helical structure around the 32 axis (Fig. 1b). The syn,syn formate and O2− anions link up Fe2 at the helices (Fig. 1d). It is worth noting that all the helices have the same handedness resulting in a chiral structure of 1 (Fig. 2a). The helices connect each other through H bonds between the coordinated water and oxygen atoms of the syn,syn formate anion and form a 3D network (Fig. 2b).
Different from that of 1, six syn,syn formate anions and one μ3-O2− anion coordinate with three Fe3+ ions to construct a [Fe3(μ3-O)(μ-O2CH)6] triangle in 2. The unsaturated sites of the Fe3+ ions are occupied by an anti,anti formate anion for Fe1 and Fe2, and by one water molecule for Fe3. In this way, [Fe3(μ3-O)(μ-O2CH)6] units are linked through anti,anti formate anions between Fe1 and Fe2, forming an infinite 1D chain (Scheme 1 and Fig. S1†). A 3D supermolecule net in the polar space group Cc is shaped by the H-bonds between the polymeric chains, solvate formic acid and water molecules.
The valence states of the iron ions in 1 and 2 are identified by the bond lengths. First, in 2, the length of Fe–O (1.918(11)–2.101(11)) is very typical of the Fe3+ ion.7 The valence states are confirmed by Bond Valence Sum (BVS) analysis: Fe1 (3.04), Fe2 (2.99) and Fe3 (3.02).11 In 1 the length of Fe2–O (1.863(8)–2.051(7)) is similar to that of 2 and the valence of Fe2 calculated by BVS analysis is 3.14. The length of Fe1–O in 1 is 1.914(4)–2.183(6), and the valence is 2.70 for trivalent iron and 2.26 for divalent iron, which approve the mixed valence iron locating at the Fe1 site in 1. To further confirm the mixed valence state of Fe ions in a bulk sample, UV-vis spectra of 1 and 2 were investigated (Fig. S2†). An intense absorption peak of the bulk sample appears around 200 nm, and a peak around 750 nm was found in 1 but was absent in 2, which are the characteristic bands for intervalence charge-transfer in mixed-valence iron(II,III) complexes.12 This proves the mixed valence nature of 1 and suggests that the interactions between the donor and acceptor sites in Fe1 are strong.
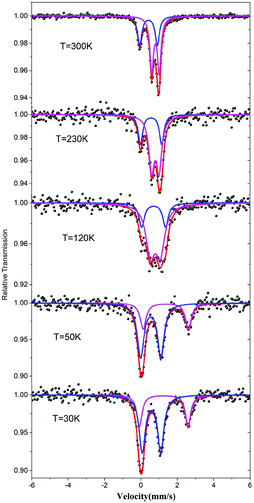
The valence states of the iron atoms in 1 were unambiguously determined using the 57Fe Mössbauer spectra recorded at different temperatures. The resulting spectral hyperfine parameters are given in Table S2† and selected spectra are shown in Fig. 3. The spectra clearly indicate a charge order below 120 K. As shown in Fig. 3, the spectra feature two components with a ratio about 1![[thin space (1/6-em)]](https://www.rsc.org/images/entities/char_2009.gif) :
:![[thin space (1/6-em)]](https://www.rsc.org/images/entities/char_2009.gif) 2 above 120 K, which correspond to one Fe3+ and two Fe2.5+ with rapid valence exchange between the mixed-valence Fe1 sites.5b,13 When the temperature drops to 50 K, the signals of Fe2+ become significant and the data can be fitted by a two Fe2+ and one Fe3+ model which suggests that the valence localization takes place between two iron atoms at the Fe1 site. This decides the magnetic behavior of 1 (vide infra).
2 above 120 K, which correspond to one Fe3+ and two Fe2.5+ with rapid valence exchange between the mixed-valence Fe1 sites.5b,13 When the temperature drops to 50 K, the signals of Fe2+ become significant and the data can be fitted by a two Fe2+ and one Fe3+ model which suggests that the valence localization takes place between two iron atoms at the Fe1 site. This decides the magnetic behavior of 1 (vide infra).
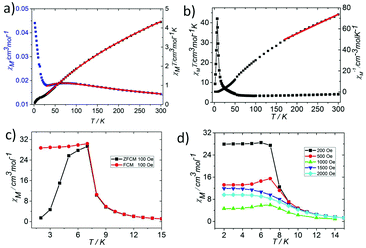
In order to explore the effect of the valence distribution on the magnetic behaviour, the temperature dependence of the magnetic susceptibility of 1 and 2 was measured from 300 to 2 K in an applied magnetic field of 1000 Oe (phase purity confirmed by XRPD, see Fig. S3†). The magnetism of the two complexes is quite different, where 1 has more interesting magnetic behaviors than 2. Thus, we described the simple magnetic properties of 2 first. The magnetism of 2 has the typical characteristics of an oxo-centered trinuclear unit with strong antiferromagnetic coupling (Fig. 4a, Fig. S4 and 5†).7 The θ value of 2 is −564.69 K and the parameters J = −20.66 ± 0.1859 cm−1, zJ′ = −1.94 ± 0.49 cm−1, and g = 1.90 ± 0.01 could be obtained by fitting the data above 35 K by the isotropic Heisenberg spin Hamiltonian H = −2J(S1S2 + S2S3 + S3S1) (for details, see the ESI†) with a mean field approximation for intercluster magnetic interactions.14
At room temperature, the χMT plots of 1 have a value of 4.07 cm3 mol−1 which is also much smaller than the spin value expected for two high-spin Fe3+ ions and one Fe2+ ion. Different from that of 2, along with cooling, the χMT plots of 1 have a minimum at about 70 K, and then they increase sharply to a maximum of 42.25 cm3 mol−1 K at about 8 K before finally dropping (Fig. 4b). This is a typical ferrimagnetic or spin canted antiferromagnetic behavior. The attempt to fit the magnetic data by the Heisenberg–Dirac–Van Vleck (HDVV) formalism as S2 = 2, S1 = S3 = 5/2 trimer H = −2J1(S1S2 + S2S3) − (2J2S3S1) with a mean field approximation for intercluster interactions failed. This indicates different magnetic interactions between Fe1(II)–Fe2(III) and Fe1(III)–Fe1(III). The Weiss constant θ = −101.09 K of 1 fitted by the data above 170 K is much larger than that of 2, which suggests that some ferromagnetic contribution may exist among the metal ions in 1. As revealed by the structure analysis, valence delocalization emerges from the interaction of two iron atoms at the Fe1 site, which may lead to ferromagnetic interactions dominated by the double exchange mechanism. At 2 K, the magnetization of 1 is 3.76Nβ under applied field 50![[thin space (1/6-em)]](https://www.rsc.org/images/entities/char_2009.gif) 000 Oe, which reaches the saturated value for a high spin Fe2+ ion. That suggests the spin of Fe3+ ions cancels each other and a ferrimagnetic state is generated (Fig. S5†).
000 Oe, which reaches the saturated value for a high spin Fe2+ ion. That suggests the spin of Fe3+ ions cancels each other and a ferrimagnetic state is generated (Fig. S5†).
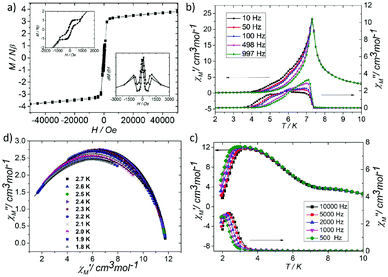
At low temperature, more complex magnetic behaviors were found in 1. The field-cooled magnetization (FCM) and zero-field-cooled magnetization (ZFCM) are irreversible below 7 K, indicating the occurrence of a long range order (LRO) (Fig. 4c). The χMvs. T plots are field dependent, and decrease with the increase in the applied field that is lower than 1000 Oe, suggesting a long range order again (Fig. 4d). However, this trend is discontinuous at an applied field higher than 1000 Oe. The χM value increases when the applied field is reaching 1500 Oe, and then it decreases at 2000 Oe again, which may be due to the field induced spin-flop transition (Fig. 5a). The field induced spin-flop transition is further approved by the magnetization at 2 K. The first-order derivative of the magnetization at 2 K shows multiple peaks at 1000 Oe (−1000 Oe) and 0 Oe, indicating a metamagnetic transition at a critical field, Hc, of 1000 Oe. Below the critical field, there is a very small hysteresis loop with coercivity of about 140 Oe and remanence of 0.50Nβ, which is typical of a spin-canted antiferromagnet, whereas above this field, all of the uncompensated iron(II) moments are oriented in parallel with the applied field. Thus, the magnetism of 1 should be comprehended such that, the electron transfer between the ions in the Fe1 sites results in a parallel arrangement of the spins, which are coupled with the spins in the Fe2 sites in an antiferromagnetic way. Thus, the chain ferrimagnetism would be expected. The uncompensated moments in the chains are antiferromagnetically coupled to the neighbors through dipole–dipole interactions with canting. The canted antiferromagnetic state could be overcome by an external field with a value larger than 1000 Oe. A canting angle of 12° can be roughly estimated by θ = tan−1(Mr/Ms), in which Mr is the magnetization at the critical field and Ms is the saturation magnetization of the ferrimagnetic chain.15 The weak magnetic interaction between the chains can also be confirmed by the ac susceptibility (Fig. 5b). Strong signals in and out of the phase appear in the χ′M and χ′′Mversus T plot at 5–7 K. In a zero dc field, the real, χ′M, ac susceptibility components show an asymmetrical peak at 7.0 K with a shoulder at low temperature. The shape of the out-of-phase signal shows sharp peaks overlapping with broader peaks, at lower temperature, indicating that more than one slow-relaxation phenomenon is taking place below 7 K. A ln(χMT) versus 1/T plot (Fig. S6†) has been drawn to further investigate the one-dimensional Ising character of 1, and the data in 20–7 K fitted by the expression χMT = Ceff![[thin space (1/6-em)]](https://www.rsc.org/images/entities/char_2009.gif) exp(Δξ/kBT) are used to fit the data between 20–7 giving Ceff = 3.05 cm3 mol−1 and Δξ/kB = 20.21 K.16 Thus, SCM like behaviour may also be responsible for the magnetic relaxation at 4–7 K. In order to investigate the slow relaxation at low temperature, ac susceptibility is obtained under the static magnetic fields 0.1 T and 0.2 T (Fig. 5c, Fig. S7 and 8†). The ac signals at 5–7 K are suppressed by the static fields which suggested a transformation of the canted antiferromagnetic state into the paramagnetic state. More interesting obvious frequency dependent ac signals at a low temperature of about 3 K are detected under applied fields of 0.1 and 0.2 T. The peak temperatures of χ′′M extracted from these data can be fitted well by the Arrhenius plots (Fig. S9†), giving a characteristic relaxation time τ0 of 9.31 × 10⁻¹² s and 2.33 × 10⁻¹⁰ s and energy barriers Δτ/kB = 34.92 K and Δτ/kB = 27.99 K for 0.1 T and 0.2 T, respectively. The frequency shift parameter Φ = ΔTp/[TpΔ(log
exp(Δξ/kBT) are used to fit the data between 20–7 giving Ceff = 3.05 cm3 mol−1 and Δξ/kB = 20.21 K.16 Thus, SCM like behaviour may also be responsible for the magnetic relaxation at 4–7 K. In order to investigate the slow relaxation at low temperature, ac susceptibility is obtained under the static magnetic fields 0.1 T and 0.2 T (Fig. 5c, Fig. S7 and 8†). The ac signals at 5–7 K are suppressed by the static fields which suggested a transformation of the canted antiferromagnetic state into the paramagnetic state. More interesting obvious frequency dependent ac signals at a low temperature of about 3 K are detected under applied fields of 0.1 and 0.2 T. The peak temperatures of χ′′M extracted from these data can be fitted well by the Arrhenius plots (Fig. S9†), giving a characteristic relaxation time τ0 of 9.31 × 10⁻¹² s and 2.33 × 10⁻¹⁰ s and energy barriers Δτ/kB = 34.92 K and Δτ/kB = 27.99 K for 0.1 T and 0.2 T, respectively. The frequency shift parameter Φ = ΔTp/[TpΔ(log![[thin space (1/6-em)]](https://www.rsc.org/images/entities/char_2009.gif) f)] = 0.13 is in excellent agreement with that expected for superparamagnetic behavior.17 The Cole–Cole plot (Fig. 5d) of χ′′Mvs. χ′M can be fitted to a generalized Debye model in the range of 0.26–0.54 at 2.7–1.8 K, indicating a widened distribution of relaxation time but still lying in the range for previously reported SCMs.18 Thus the SCM behaviour appears when the canted antiferromagnetic state is suppressed. Without the static magnetic field, the magnetic relaxation at 4–7 K may be attributed to the moving of the domain wall, which is frequent in magnets constructed with a low dimensional structure.19 In such complexes, the magnetic interactions among the low dimensional structures are weak.
f)] = 0.13 is in excellent agreement with that expected for superparamagnetic behavior.17 The Cole–Cole plot (Fig. 5d) of χ′′Mvs. χ′M can be fitted to a generalized Debye model in the range of 0.26–0.54 at 2.7–1.8 K, indicating a widened distribution of relaxation time but still lying in the range for previously reported SCMs.18 Thus the SCM behaviour appears when the canted antiferromagnetic state is suppressed. Without the static magnetic field, the magnetic relaxation at 4–7 K may be attributed to the moving of the domain wall, which is frequent in magnets constructed with a low dimensional structure.19 In such complexes, the magnetic interactions among the low dimensional structures are weak.
Conclusions
In summary, two magnetic chain based magnetic triangles [Fe3(μ3-O)(μ-O2CH)6] are obtained depending on the assembly temperature. The low temperature product is trivalent magnetic chains with strong antiferromagnetic interactions, while the mixed valence iron(II,III) complex is obtained at high temperature for the reduction of Fe3+ by formic acid. In the mixed valence complex, valence delocalization takes place between only two iron sites, which results in ferrimagnetic chains. The valence distribution and the magnetism of the mixed valence complex are similar to those of magnetite and the mixed valence complex could be considered as a molecule based “magnetite”. Intramolecular charge separation to Fe3+ and Fe2.5+ has been observed in a few discrete trinuclear mixed valence complexes at low temperature. However, the present example involves intermolecular charge separation in an infinite coordination polymer. This leads to more interesting magnetism, such as canted antiferromagnetism, field-induced spin-flop transition and SCM like behaviour at low temperature.Conflicts of interest
There are no conflicts to declare.Acknowledgements
This work was supported by the NSFC of China (21871209 and 21571139), the Natural Science Foundation of Tianjin (17JCQNJC05900) and the Special Program of Talents Development for Excellent Youth Scholars in Tianjin (TJTZJH-QNBJRC-2-3).Notes and references
- (a) X. Ma, C. Lin, X. Zhu, S. Hu, T. Sheng and X. Wu, Angew. Chem., Int. Ed., 2017, 56, 1605–1609 CrossRef CAS; (b) L. S. Xie, L. Sun, R. Wan, S. S. Park, J. A. DeGayner, C. H. Hendon and M. Dincă, J. Am. Chem. Soc., 2018, 140, 7411–7414 CrossRef CAS PubMed; (c) C. H. Arnett, M. J. Chalkley and T. Agapie, J. Am. Chem. Soc., 2018, 140, 5569–5578 CrossRef CAS; (d) Z. Li, J. Dai, M. Damjanovic, T. Shiga, J. Wang, J. Zhao, H. Oshio, M. Yamashita and X. Bu, Angew. Chem., Int. Ed., 2019, 58, 4339–4344 CrossRef CAS.
- M. B. Robin and P. Day, Adv. Inorg. Chem. Radiochem., 1967, 10, 247 CrossRef CAS.
- A. I. Gaudette, I. R. Jeon, J. S. Anderson, F. Grandjean, G. J. Long and T. D. Harris, J. Am. Chem. Soc., 2015, 137, 12617–12626 CrossRef CAS.
- M. S. Senn, J. P. Wright and J. P. Attfield, Nature, 2012, 481, 173–176 CrossRef CAS.
- (a) J. Overgaard, F. K. Larsen, B. Schiøtt and B. B. Iversen, J. Am. Chem. Soc., 2003, 125, 11088–11099 CrossRef CAS; (b) T. Sato, F. Ambe, K. Endo, M. Katada, H. Maeda, T. Nakamoto and H. Sano, J. Am. Chem. Soc., 1996, 118, 3450–3458 CrossRef CAS; (c) T. Mochida, E. Nagabuchi, M. Takahashi and H. Mori, Chem. Commun., 2014, 50, 2481–2483 RSC.
- J. W. Yoon, Y.-K. Seo, Y. K. Hwang, J.-S. Chang, H. Leclerc, S. Wuttke, P. Bazin, A. Vimont, M. Daturi, E. Bloch, P. L. Llewellyn, C. Serre, P. Horcajada, J.-M. Grenèche, A. E. Rodrigues and G. Férey, Angew. Chem., Int. Ed., 2010, 49, 5949–5952 CrossRef CAS.
- M. P. Yutkin, M. S. Zavakhina, A. V. Virovets, D. N. Dybtsev, V. P. Fedin, T. Kusamoto and H. Nishihara, Inorg. Chim. Acta, 2011, 365, 513–516 CrossRef CAS.
- G. Perversi, J. Cumby, E. Pachoud, J. P. Wright and J. P. Attfield, Chem. Commun., 2016, 52, 4864–4867 RSC.
- E. J. W. Verwey, Nature, 1939, 144, 327–328 CrossRef CAS.
- (a) Q. L. Wu, S. D. Han, Q. L. Wang, J. P. Zhao, F. Ma, X. Jiang, F. C. Liu and X. H. Bu, Chem. Commun., 2015, 51, 15336–15339 RSC; (b) J. P. Zhao, J. Xu, S. D. Han, Q. L. Wang and X. H. Bu, Adv. Mater., 2017, 29, 1606966 CrossRef.
- (a) I. D. Brown and D. Altermatt, Acta Crystallogr., Sect. B: Struct. Sci., 1985, 41, 244–247 CrossRef; (b) N. E. Brese and M. O'Keeffe, Acta Crystallogr., Sect. B: Struct. Sci., 1991, 47, 192–197 CrossRef; (c) I. D. Brown, R. J. Gillespie, K. R. Morgan, Z. Tun and P. K. Ummat, Inorg. Chem., 1984, 23, 4506–4508 CrossRef CAS.
- D. Lee, C. Krebs, B. H. Huynh, M. P. Hendrich and S. J. Lippard, J. Am. Chem. Soc., 2000, 122, 5000–5001 CrossRef CAS.
- (a) T. Y. Dong, L. S. Chang, G. H. Lee and S. M. Peng, Organometallics, 2002, 21, 4192–4200 CrossRef CAS; (b) H. Sano, Hyperfine Interact., 1990, 53, 97–112 CrossRef CAS; (c) D. N. Hendrickson, S. M. Oh, T. Y. Dong, T. Kambara, M. J. Cohn and M. F. Moore, Comments Inorg. Chem., 1985, 4, 329–349 CrossRef CAS; (d) T. Mochida, S. Yamazaki, S. Suzuki, S. Shimizu and H. M. Bull, Chem. Soc. Jpn., 2003, 76, 2321–2328 CrossRef CAS.
- (a) K. J. Kambe, J. Phys. Soc. Jpn., 1950, 5, 48–51 CrossRef CAS; (b) C. J. O'Connor, Prog. Inorg. Chem., 1982, 29, 203–283 Search PubMed.
- F. Palacio, M. Andres, R. Horne and A. Duyneveldt, J. Magn. Magn. Mater., 1986, 54, 1487–1488 CrossRef.
- C. Coulon, H. Miyasaka and R. Clérac, Struct. Bonding, 2006, 122, 163 CrossRef CAS.
- A. H. Morrish, The Physical Principles of Magnetism, Wiley, New York, 1966 Search PubMed.
- (a) P. Kar, R. Biswas, M. G. B. Drew, Y. Ida, T. Ishida and A. Ghosh, Dalton Trans., 2011, 40, 3295–3304 RSC; (b) R. Li, Y. Xiao, S. Wang, X. Jiang, Y. Tang, J. Xu, Y. Yan, F. Zheng and G. Guo, J. Mater. Chem. C, 2017, 5, 513–517 RSC and references cited therein.
- (a) E. Coronado, J. R. G. Mascarós, C. J. G. García and A. M. Martínex, Chem. – Eur. J., 2006, 12, 3484–3492 CrossRef CAS; (b) F. Thétiot, J. S. Pala, J. R. G. Mascarós and S. Golhen, Chem. Commun., 2002, 1078–1079 RSC; (c) J. P. Zhao, B. W. Hu, E. C. Sañudo, Y. Qian, Y. F. Zeng and X. H. Bu, Inorg. Chem., 2009, 48, 2482–2489 CrossRef CAS.
Footnote |
| † Electronic supplementary information (ESI) available: CCDC 1861919 and 1861920. For ESI and crystallographic data in CIF or other electronic format see DOI: 10.1039/c9qi00869a |
| This journal is © the Partner Organisations 2020 |

