 Open Access Article
A composite with a gradient distribution of graphene and its anisotropic electromagnetic reflection†
Dayong Zhang ab,
Zhi Jin*a,
Jingyuan Shia,
Songang Peng
 ab,
Xinnan Huanga,
Yao Yao
 a,
Yankui Lia,
Wuchang Dinga and
Dahai Wanga
aHigh-Frequency High-Voltage Device and Integrated Circuits R&D Centre, Institute of Microelectronics of Chinese Academy of Sciences, Beijing 100029, P. R. China. E-mail: jinzhi@ime.ac.cn
bKey Laboratory of Microelectronic Devices & Integrated Technology, Institute of Microelectronics of Chinese Academy of Sciences, Beijing 100029, P. R. China
First published on 20th January 2020
Abstract
So far, it is still difficult to construct composites with a gradient distribution of graphene for decreasing the reflection and increasing the absorption of electromagnetic energy. Here, we introduce an electrochemical method to efficiently prepare a graphene/polyurethane composite with a gradient graphene distribution. And the composite shows obvious anisotropic reflection of electromagnetic waves, with low reflection loss (<−30 dB) and high absorption (>99.5%) in the whole X-band when electromagnetic waves are incident to the surface that has low graphene content. More importantly, the electrochemical method could be extended to the preparation of functional materials with similar structures based on the electrophoresis of charged nanoparticles.
Microwave-absorbing materials can transform electromagnetic energy into heat through dielectric loss and/or magnetic loss, helping to eliminate electromagnetic radiation in the environment.1–3 Therefore, electromagnetic absorbing composites containing magnetic fillers such as ferrite4 and carbonyl iron,5 or conducting fillers such as carbon fibers,6 conducting polymers,7 carbon nanotubes8,9 and graphene,10–12 have been created. Previous studies have shown that compared with graphite, carbon nanotubes and high-quality graphene, reduced graphene oxide (rGO) demonstrates better electromagnetic absorption characteristic of its residual defects and functional groups.13–15
The reflection of electromagnetic waves at the surface of a material is mainly caused by the mismatch in the impedance between the material and free space.1,16 For maximal absorption but also low reflection, finely adjusting the electromagnetic constant of the material to satisfy the impedance matching is one solution.1,17 Another important solution involves the preparation of multi-layered or gradient structures with gradually increasing concentrations of active fillers.18–20 This kind of materials could reduce reflection at the input interface due to the low concentration of active fillers, and ensure absorption in the inner layers due to their higher filler content.21–23 Current preparation methods of gradient structures mainly involve the multi-step assembly of composite slices with different active filler content18,20 or time-consuming supercritical carbon dioxide technology.19 Compared with the multi-layered structure, a continuous variation of active filler content could more efficiently reduce the reflection to achieve continuously varied impedance. As far as we know, electromagnetic absorbing materials based on graphene composites with continuous variation of graphene content have not yet been reported.
Here, we present an efficient electrochemical method to prepare reduced graphene oxide/polyurethane (rGO/PU) composite foams with continuous variation of graphene content. This method takes advantage of the negative correlation between the size of GO nanoparticles and their migration velocity in an electric field. Through optimizing the distribution by controlling the electrophoretic time, the gradient graphene composite shows obvious anisotropic reflection of electromagnetic waves. Furthermore, a low reflection (<−30 dB) and high absorption (>99.5%) in the whole X-band was attainted when the electromagnetic waves are incident to the surface with a low graphene content.
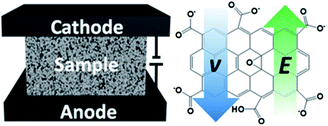
The electrophoretic process for the preparation of the graphene oxide/polyurethane (GO/PU) composite foams is illustrated in Scheme 1, and the optical image of the equipment is shown in Fig. S1.† The PU foam filled with graphene oxide solution was placed between two graphite electrodes and a direct voltage of 30 V was applied to the electrodes for a certain period of time. For the ionization of the carboxylic acid and phenolic hydroxyl groups on the GO sheets,24 the negatively charged GO nanosheets migrated to the anode under the external electric field. According to colloid theory, the migration velocity v of GO can be determined by the applied electric field E and the electrophoretic mobility m based on the equation: v = Em; and m for GO nanosheets is given by the following formula:
| m = Cr0.5n−1 | (1) |
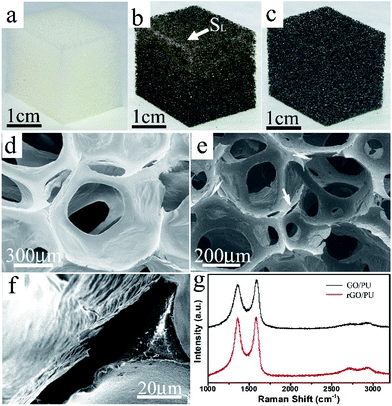
As shown in Fig. 1a–c, after the deposition of GO, the color of the foam changed from white (for pure PU) to brown (for the GO/PU composite). After the reduction to rGO/PU composites by hydrazine in a hydrothermal environment, the color of rGO/PU turned to black, as shown in Fig. 1c. It is important to note that the color of the GO/PU composite continuously deepened along the direction from SL to SH, which indicates that the GO content in the composite gradually increased along this direction. The morphology and structure of the rGO/PU composite foam were investigated by scanning electron microscopy. As shown in Fig. 1d–f, the PU foam exhibits a highly porous and interconnected three-dimensional network structure with continuous macropores of several hundred micrometers. The morphology of rGO/PU is similar to that of PU foam but the skeleton of the network exhibits a peeled region marked by the white arrow in Fig. 1e, which is associated with the presence of graphene sheets. This indicates that the graphene sheets assembled around the PU backbones after the electrophoresis and reduction process.
Raman spectra of the GO/PU composite sample before and after reduction of graphene oxide are shown in Fig. 1e. There are two strong major bands, the D-band at around 1352 cm−1 and the G-band at around 1580 cm−1, which originate from the disorder and the E2g mode of the aromatic carbon rings,27 respectively. The G-band was down-shifted from 1589 cm−1 to 1575 cm−1 after the reduction of graphene oxide, which was attributed to a certain degree of recovery of the aromatic rings.28,29 Moreover, the intensity ratio of D-band to G-band increased notably after the reduction. This indicates that reduction increases the number of small domains of aromaticity responsible for the D-band, but not necessarily their overall size which is responsible for the G-band.30
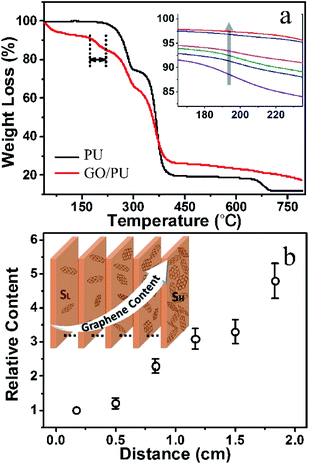
In order to determine the GO relative content at different positions in the electrophoretically treated GO/PU composite, the GO/PU composite foam was uniformly sliced into six pieces along the direction parallel to SL and SH, and TGA was used to analyze the GO relative content in these pieces. As shown in Fig. 2a, the three stages of the degradation process of the pure PU sponge at 220–290 °C, 300–380 °C and 660–700 °C are referred to as T1st, T2nd and T3rd, respectively.31 Compared with the PU sponge, there is an obvious weight loss in the range from 175 °C to 225 °C in the GO/PU composite, which could be due to the thermal decomposition of the oxygen-containing groups in graphene oxide.32 A close-up view of the weight loss in the temperature range from 165 °C to 235 °C is shown in the inset of Fig. 2a, and the arrow shows the order of the specimens. The weight loss in the temperature range of 175 °C to 225 °C gradually reduced along this order, which indicates that the GO content in these specimens gradually decreased. The relative content, defined as the ratio of GO content of the sample to that of SL, could be concluded from the weight loss ratio. As shown in Fig. 2b, the farther away the sample was from SL, the more GO it contained, further indicating that the content of rGO in the rGO/PU composite foam gradually increased from SL to SH, as shown in the inset in Fig. 2b.
According to the electromagnetic theory, when an electromagnetic wave travels through the interface of two materials with different impedance, reflection, absorption and transmission of the electromagnetic wave can be observed. The incident power is divided into reflected power, absorbed power and transmitted power. The corresponding power coefficients of absorptivity (A), reflectivity (R), and transmissivity (T) meet the equation of R = |S11|2, T = |S21|2, and A + R + T = 1, where the S11 and S21 are the forward reflection and transmission coefficients measured using the wave-guide method.33,34 In the test of electromagnetic characteristics, the rGO/PU composites were placed into the middle of an aluminum waveguide fitted into the test fixture, as shown in Fig. S2.†
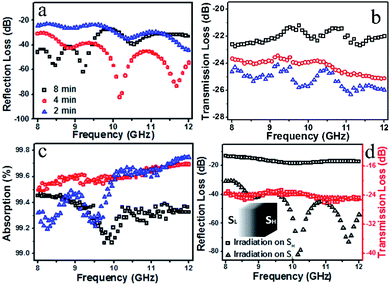
Fig. 3 shows the electromagnetic testing results of rGO/PU composites electrophoretically treated for different times. Increasing the time from 2 min to 4 min, the maximum reflection loss reduced from −23 dB to −30 dB. However, when the time was increased to 8 min, the maximum reflection loss enhanced to −27 dB. This indicates that the distribution of rGO in the composite significantly affects the reflection loss of electromagnetic waves. Meanwhile, the maximum transmission loss increased from −24 dB to −23 dB and −21 dB, as shown in Fig. 3b. These curves in Fig. 3c indicate that the composites treated for 4 min exhibit an absorption of higher than 99.5% over the whole frequency range, while the values for the other samples were less than 99.2% at certain frequencies. All these results indicate that the composite treated for 4 min not only exhibited significantly reduced reflection loss, but also demonstrated high absorption over the whole X-band. It is worth pointing out that the reflection loss of the rGO/PU composite is related to the incident direction of the electromagnetic waves. As shown in Fig. 3d, the reflection loss was higher than −20 dB over the whole X-band when SH was irradiated with electromagnetic waves, but it significantly decreased to −30 dB over the whole X-band when the waves were incident to SL. On the contrary, the curves of transmission loss almost coincide, showing that it is entirely unrelated to the incident direction.
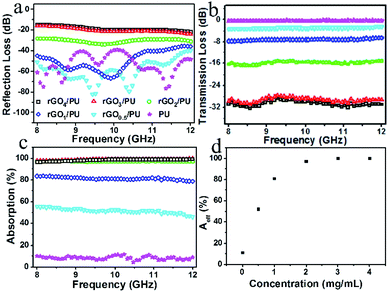
To gain a better understanding of the electromagnetic absorption of the gradient rGO/PU composites, we prepared several rGO/PU composites with uniform rGO content and studied their electromagnetic characteristics. For convenience, the rGO/PU composite prepared using GO solution with a concentration of n was denoted as rGOn/PU. Fig. 4a and b show the variation in reflection loss and transmission loss of the uniform rGO/PU composites. By raising the rGO content, the reflection loss enhanced, and the maximum reflection loss increased to −15 dB for the rGO4/PU composite, which could be attributed to the greater deterioration of the impedance matching between the rGO/PU composite and free space with increased rGO content. Due to the strong dissipation of electromagnetic waves on graphene, the transmission loss decreased to −32 dB with increasing content of rGO. These curves in Fig. 4c indicate that absorption increased with increasing content of rGO and reached 83% at 8 GHz for rGO1/PU; when the rGO content was increased further, the absorption increased to about 99%. The real intensity of electromagnetic waves entering the interior of the composites is based on (1 − R), so the effective absorption (Aeff) could be described as: Aeff = (1 − R − T)/(1 − R), which can evaluate the real absorbing capacity of rGO/PU composites.35 The Aeff values of the rGO/PU composites with different rGO content at the frequency of 10 GHz are shown in Fig. 4d. The Aeff value enhanced with increasing rGO content; however, the slope of the curve gradually decreased with increasing rGO content, which means that the absorption capacity per unit rGO mass decreased with increasing rGO content. This also clearly explains the phenomenon of gradient rGO/PU composites, in which the absorption firstly increases and then decreases with increasing the electrophoretic time.
Conclusions
We have demonstrated an efficient electrochemical method for the preparation of rGO/PU composite foams with a gradient graphene distribution. The composite shows obvious anisotropic reflection of electromagnetic waves. When the surface with low graphene content was irradiated, reflection loss of −30 dB and absorption of more than 99.5% over the whole X-band were achieved. More importantly, this method could be easily extended to the preparation of other functional composites with a gradient distribution of active fillers based on the electrophoresis of charged nanoparticles.Conflicts of interest
The authors declare no competing financial interests.Notes and references
- F. Qin and C. Brosseau, J. Appl. Phys., 2012, 111, 061301 CrossRef.
- R. C. Che, L. M. Peng, X. F. Duan, Q. Chen and X. L. Liang, Adv. Mater., 2004, 16, 401–405 CrossRef CAS.
- Y. X. Huang, W. L. Song, C. X. Wang, Y. N. Xu, W. Y. Wei, M. J. Chen, L. Q. Tang and D. N. Fang, Compos. Sci. Technol., 2018, 162, 206–214 CrossRef CAS.
- X. A. Li, B. Zhang, C. H. Ju, X. J. Han, Y. C. Du and P. Xu, J. Phys. Chem. C, 2011, 115, 12350–12357 CrossRef CAS.
- A. M. Wang, W. Wang, C. Long, W. Li, J. G. Guan, H. S. Gu and G. X. Xu, J. Mater. Chem. C, 2014, 2, 3769–3776 RSC.
- Y. L. Yang, M. C. Gupta, K. L. Dudley and R. W. Lawrence, Adv. Mater., 2005, 17, 1999–2003 CrossRef CAS.
- P. Saini, V. Choudhary and S. K. Dhawan, Polym. Adv. Technol., 2012, 23, 343–349 CrossRef CAS.
- Z. Ye, W. D. Deering, A. Krokhin and J. A. Roberts, Phys. Rev. B: Condens. Matter Mater. Phys., 2006, 74, 075425 CrossRef.
- K. R. Paton and A. H. Windle, Carbon, 2008, 46, 1935–1941 CrossRef CAS.
- X. Bai, Y. H. Zhai and Y. Zhang, J. Phys. Chem. C, 2011, 115, 11673–11677 CrossRef CAS.
- B. Wu, H. M. Tuncer, A. Katsounaros, W. P. Wu, T. C. Matthew, K. Ying, L. H. Zhang, W. I. Milne and Y. Hao, Carbon, 2014, 77, 814–822 CrossRef CAS.
- Y. M. Huangfu, C. B. Liang, Y. X. Han, H. Qiu, P. Song, L. Wang, J. Kong and J. W. Gu, Compos. Sci. Technol., 2019, 169, 70–75 CrossRef CAS.
- B. Wen, M. S. Cao, M. M. Lu, W. Q. Cao, H. L. Shi, J. Liu, X. X. Wang, H. B. Jin, X. Y. Fang, W. Z. Wang and J. Yuan, Adv. Mater., 2014, 26, 3484–3489 CrossRef CAS PubMed.
- C. Wang, X. J. Han, P. Xu, X. L. Zhang, Y. C. Du, S. R. Hu, J. Y. Wang and X. H. Wang, Appl. Phys. Lett., 2011, 98, 072906 CrossRef.
- P. M. Sudeep, S. Vinayasree, P. Mohanan, P. M. Ajayan, T. N. Narayanan and M. R. Anantharaman, Appl. Phys. Lett., 2015, 106, 221603 CrossRef.
- D. D. L. Chung, Carbon, 2001, 39, 279–285 CrossRef CAS.
- S. Chandrasekaran, S. Ramanathan and T. Basak, AIChE J., 2012, 58, 330–363 CrossRef CAS.
- Y. Li, B. Shen, D. Yi, L. H. Zhang, W. T. Zhai, X. C. Wei and W. G. Zheng, Compos. Sci. Technol., 2017, 138, 209–216 CrossRef CAS.
- L. Monnereau, L. Urbanczyk, J. M. Thomassin, T. Pardoen, C. Bailly, I. Huynen, C. Jerome and C. Detrembleur, Polymer, 2015, 59, 117–123 CrossRef CAS.
- M. X. Chen, Y. Zhu, Y. B. Pan, H. M. Kou, H. Xu and J. K. Guo, Mater. Des., 2011, 32, 3013–3016 CrossRef CAS.
- Y. Danlee, I. Huynen and C. Bailly, Appl. Phys. Lett., 2012, 100, 213105 CrossRef.
- X. M. Li, L. T. Zhang and X. W. Yin, J. Eur. Ceram. Soc., 2013, 33, 647–651 CrossRef CAS.
- R. B. Schulz, V. C. Plantz and D. R. Brush, IEEE Trans. Electromagn. Compat., 1988, 30, 187–201 Search PubMed.
- D. Li, M. B. Muller, S. Gilje, R. B. Kaner and G. G. Wallace, Nat. Nanotechnol., 2008, 3, 101–105 CrossRef CAS PubMed.
- Y. Liu, D. Zhang, S. W. Pang, Y. Y. Liu and Y. Shang, J. Sep. Sci., 2015, 38, 157–163 CrossRef CAS PubMed.
- S. Y. Pan and I. A. Aksay, ACS Nano, 2011, 5, 4073–4083 CrossRef CAS PubMed.
- H. S. Ahn, J. M. Kim, C. Park, J. W. Jang, J. S. Lee, H. Kim, M. Kaviany and M. H. Kim, Sci. Rep., 2013, 3, 1960 CrossRef PubMed.
- I. K. Moon, J. Lee, R. S. Ruoff and H. Lee, Nat. Commun., 2010, 1, 73 CrossRef PubMed.
- C. Wu, X. Y. Huang, X. F. Wu, R. Qian and P. K. Jiang, Adv. Mater., 2013, 25, 5658–5662 CrossRef CAS PubMed.
- V. C. Tung, M. J. Allen, Y. Yang and R. B. Kaner, Nat. Nanotechnol., 2009, 4, 25–29 CrossRef CAS PubMed.
- J. N. Gavgani, H. Adelnia, D. Zaarei and M. M. Gudarzi, RSC Adv., 2016, 6, 27517–27527 RSC.
- S. Stankovich, D. A. Dikin, R. D. Piner, K. A. Kohlhaas, A. Kleinhammes, Y. Jia, Y. Wu, S. T. Nguyen and R. S. Ruoff, Carbon, 2007, 45, 1558–1565 CrossRef CAS.
- L. Kong, X. W. Yin, X. Y. Yuan, Y. J. Zhang, X. M. Liu, L. F. Cheng and L. T. Zhang, Carbon, 2014, 73, 185–193 CrossRef CAS.
- M. H. Al-Saleh, W. H. Saadeh and U. Sundararaj, Carbon, 2013, 60, 146–156 CrossRef CAS.
- W. L. Song, M. S. Cao, M. M. Lu, S. Bi, C. Y. Wang, J. Liu, J. Yuan and L. Z. Fan, Carbon, 2014, 66, 67–76 CrossRef CAS.
Footnote |
| † Electronic supplementary information (ESI) available. See DOI: 10.1039/c9ra04951g |
| This journal is © The Royal Society of Chemistry 2020 |

