 Open Access Article
First principles study of ferroelectric hexagonal compounds RInO3 (R = Dy, Er, and Ho): electronic structure, optical and dielectric properties
Yifei Yua,
Na Lin *ab,
Haoyuan Wanga,
Ran Xua,
Hao Ren
 c and
Xian Zhao*a
aState Key Laboratory of Crystal Materials, Shandong University, 250100 Jinan, Shandong, PR China. E-mail: linnakth@gmail.com; xianzhao@sdu.edu.cn
bDepartment of Chemistry, University of Calgary, T2N 1N4 Calgary, Alberta, Canada
cState Key Laboratory of Heavy Oil Processing, Center for Bioengineering and Biotechnology, China University of Petroleum (East China), 266580 Qingdao, PR China
First published on 24th January 2020
Abstract
The 4f-shell electrons of rare-earth ion R have a certain influence on both the electrical and optical properties of RInO3. We have studied the electronic structures, optical and dielectric properties of hexagonal compounds RInO3 (R = Dy, Ho, and Er) by performing first principles calculations. After optimization, the lattice parameters are in great agreement with the experiment with an error within 1%. Band structure calculations reveal decreasing band gaps with the increase of atomic number, yielding the highest conductivity for ErInO3, which has the smallest band gap in the present study. We have calculated the density of states of RInO3 and characterized the displacement of In and O. The dielectric properties and ionic contribution have been calculated and a detailed comparison has been made on the dielectric function including the static dielectric tensor. The absorption coefficient, the reflectivity, the refractive index, the conductivity and the electron energy-loss spectrum of hexagonal DyInO3, HoInO3 and DyInO3 have been calculated and analyzed.
1 Introduction
A group of materials with hexagonal ABO3-type structure have been extensively invoked for their geometric multiferroic characteristics and potential applications in capacitors, FRAM storage, computer memory and other multifunctional devices.1–4 Research on these materials mainly pays attention to the correlation between ferromagnetism and ferroelectricity, however, rarely does a study exist on their optical and dielectric properties which are also important to explore. It is worth noting that there are some ABO3 perovskites reflecting superior dielectric properties5,6 which have potential applications in manufacturing dielectric devices. People can control the dielectric and optical properties of the perovskite structures by selecting appropriate A and B cations due to the fact that physical properties of ABO3 perovskite depend on the mass and ionic radius of the A and B cations.Among the ABO3 perovskite structures, RMnO3 (R = rare-earth element) has been widely studied due to its excellent ferroelectric and dielectric properties,7–13 and hexagonal RInO3 with the space group of P63cm is isomorphic to the hexagonal RMnO3.14 If we replace Mn3+ ions with non-transition metal In3+ ions, the dielectric and optical properties of the RInO3 perovskite system are only contributed by the 4f-shell electrons of the rare-earth ions R3+,15–21 which makes it much more straightforward to study the optical and dielectric properties of RInO3 than in RMnO3. Studies have shown that the spontaneous polarization of hexagonal RInO3 increases with the increase of the atomic number of rare-earth elements.22 In order to explore the dielectric and optical properties as a function of the atomic number of rare-earth elements, in present study we have chosen Dy, Ho and Er with increasing atomic number. Moreover, the hexagonal DyInO3 and HoInO3 are stable at normal pressure and temperature but transform to 6% denser pseudohexagonal orthorhombic phases at 20 kbar, 1000 °C,23 while the properties of ErInO3 have not yet been confirmed. In this work, we have performed first principles calculations on the electronic structure, optical and dielectric properties of hexagonal RInO3 (R = Dy, Ho, and Er) and further discussed their potentials in the preparation of high quality multifunctional devices.
2 Computational details
All calculations in present paper are based on density functional theory (DFT) with Perdew–Burke–Ernzerhof (PBE) of the generalized gradient approximation (GGA)24 functional for the exchange–correlation function, implemented in Vienna Ab initio Simulation Package (VASP)25,26 by solving the Kohn–Sham equation and corrected the results by the GW method of quasi-particle approximation. The specific Kohn–Sham equation is as follows,
 | (1) |
 is the effective potential and εi is the eigenvalue of the Kohn–Sham equation. We employ the projector augmented-wave (PAW) method to describe the interaction of ions and electrons. The cut-off energy in the plane-wave expansion has been set to 450 eV, which had been accurately proved to ensure the well-converged total energy.27 In order to obtain the well-polymerized geometrical configurations, we fully relaxed the hexagonal structures with a 5 × 5 × 2 k-point mesh grid and 8 × 8 × 3 for the subsequent calculations of properties. Convergences of energy and force have been respectively set to 0.01 meV per cell and −0.02 eV A−1. We have also employed the density functional perturbation theory (DFPT) with a linear response method implemented in the Cambridge Serial Total Energy (CASTEP)28 code in the calculations for optical and dielectric properties. The calculated lattice parameters of RInO3 (R = Dy, Ho, Er) has been determined to be a = b = 6.357 Å, c = 12.404 Å, which are in great agreement with the experimental value of a = b = 6.300 Å and c = 12.300 Å,29 with an error within 1%, indicating the accuracy of present calculations.
3 Results and discussion
3.1 Electronic structure of hexagonal DyInO3, HoInO3 and ErInO3
The optimized geometrical configurations for hexagonal RInO3 is shown in Fig. 1(a), containing 6 rare-earth (R) atoms, 18 oxygen (O) atoms and 6 indium (In) atoms. A 2 × 2 × 1 super-cell of RInO3 has been made for a better understanding, as shown in Fig. 1(b). We can see that the structure of RInO3 along c-axis direction is formed by the alternating bonding of In and O atoms with hexagonal structure, and the bond length of In–O is 2.11 Å. Therefore, hexagonal RInO3 has been proved to be quite stable which lays the foundation for further study on its optical and dielectric properties.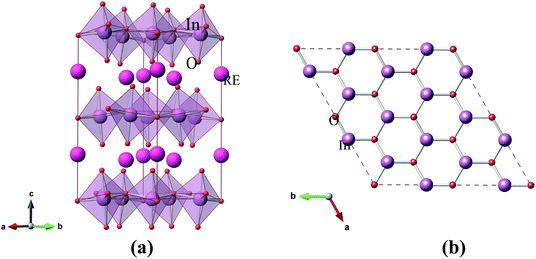 | ||
| Fig. 1 (a) Optimized structure of hexagonal RInO3 (R = Dy, Er, Ho). (b) Quadrilateral arrangement of a 2 × 2 × 1 super-cell of optimized hexagonal RInO3 along c-axis. | ||
The calculated band structure of hexagonal RInO3 (R = Dy, Ho, Er) is shown in Fig. 2. We position the Fermi level corresponding to the top of the valence band at zero energy and marked with dotted line. From Fig. 2 we can see that hexagonal RInO3 are indirect band gap crystals with band-gap values respectively to be 1.90 eV, 1.85 eV and 1.80 eV for DyInO3, HoInO3 and ErInO3, which reveals decreasing band gaps with the increase of atomic number. The smaller the band gap, the easier it is for the electron to be excited by the valence band to the conduction band, and the higher the conductivity. Among three crystals in present study, DyInO3 which has the largest band gap will give the smallest conductivity, whereas ErInO3 which has the smallest band gap yields highest conductivity.
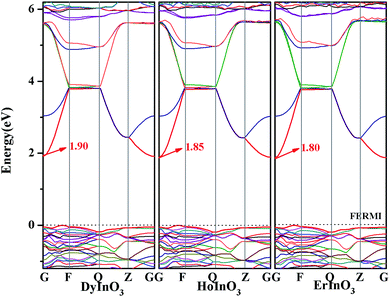 | ||
| Fig. 2 Band structure of hexagonal DyInO3, HoInO3 and ErInO3 along the high symmetry direction. The Fermi level is positioned at zero energy and marked with dotted line. | ||
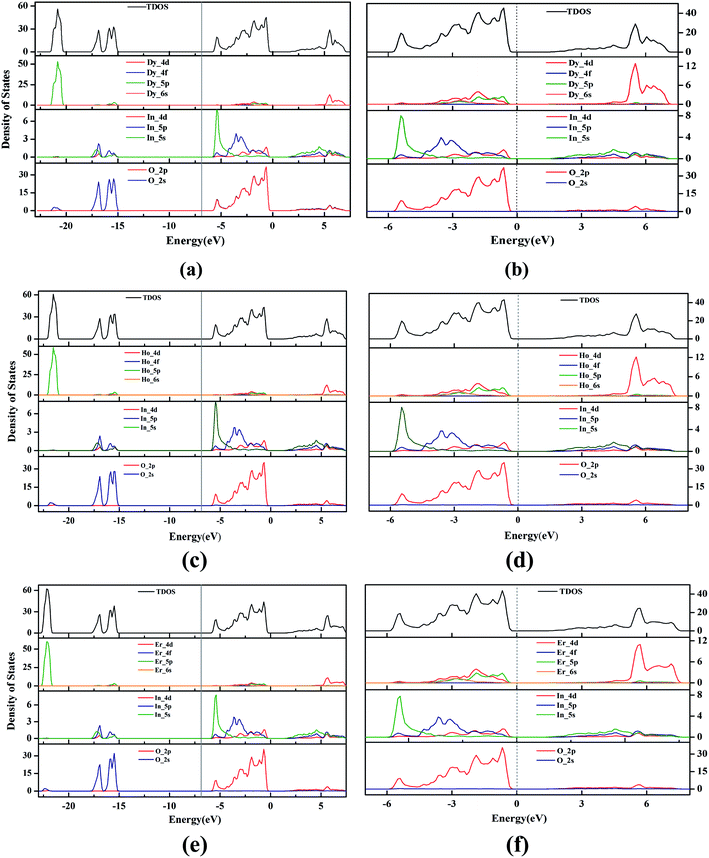
Fig. 3 shows the total density of states (TDOS) and the partial density of states (PDOS) of unit-cell hexagonal DyInO3, HoInO3 and ErInO3. Due to the similarity between these three crystals and the properties of the lanthanides compound, it's not difficult to observe from Fig. 3(a), (c) and (e) that the curves of total density of states of DyInO3, HoInO3 and ErInO3 are roughly similar and there only exist minor different density peak in the energy range from −27 to −20 eV. In addition to observing the overall state density distribution, we also plot the distribution of density of states near the valence band maximum (VBM) and the conduction band minimum (CBM), that is, in the energy range from −7 to 7 eV, as collected in Fig. 3(b), (d) and (f). From Fig. 3(b), we can see in the energy range from −7 to 0 eV the VBM of DyInO3 mainly contributed by O 2p states, together with a part of contribution from In 4d states. Since the electronic contribution of Dy to partial density of states is less than 0.5 eV, therefore, we do not take the contribution of Dy into account. In the energy range from 0 to 7 eV, the CBM of DyInO3 is mainly contributed by In 4d states, together with a small contribution from O 2p states. The density of In is much larger than the density of O in the contribution to the VBM, which indicates that a large part of the electrons of O transfer from the valence band to the conduction band and hybridize with Ti 3d electrons. For the case where the contribution of different atomic orbitals to the conduction band and the valence band of RInO3, we can see similar situations in Fig. 3(d) and (f). The VBM and the CBM of these three structures are mainly contributed by O and In, while the contribution of the lanthanides to the total density of states is not significant. This indicates that the band structure properties of hexagonal DyInO3, HoInO3 and ErInO3 are mainly provided by the strong bonding of In and O whereas lanthanides show limited effects.
3.2 Dielectric properties of hexagonal DyInO3, HoInO3 and ErInO3
We calculate the optical properties of hexagonal DyInO3, HoInO3 and ErInO3 by calculating the static dielectric function ε(ω),| ε(ω) = ε1(ω) + iε2(ω) | (2) |
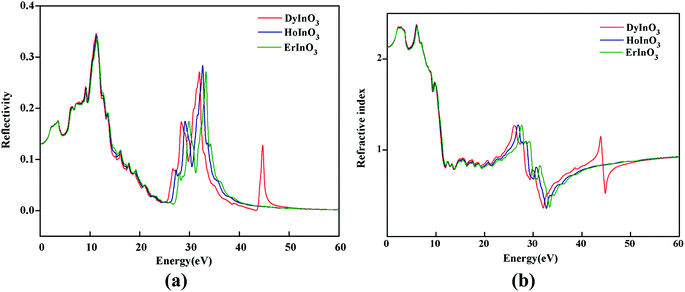
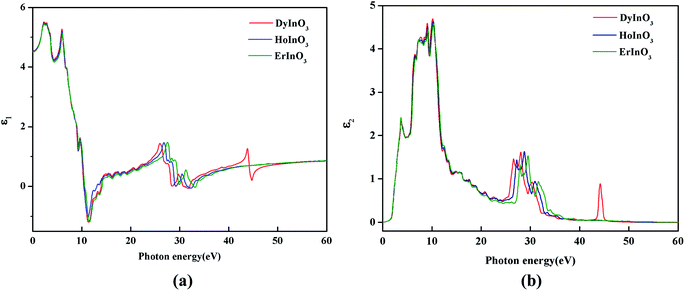
Fig. 4(a) shows the real part curves of the static dielectric function of hexagonal DyInO3, HoInO3 and ErInO3 and we can see that the static dielectric constants of these three crystals are all 4.53. The real part curves all reach the maximum when the photon energy reaches 2.24 eV. As shown in Fig. 4(b), the corresponding imaginary part curves of the dielectric function of DyInO3, HoInO3 and ErInO3 show an increasing pattern in the energy range from 0 to 10.4 eV and decrease from 10.4 eV to 24.3 eV. All three systems under study give similar imaginary part curves, only with mutual shifts on peaks located in the energy range from 20 eV to 40 eV. It can be seen from Fig. 4(b) that the imaginary part function at 10.1 eV is much stronger than other dielectric function peaks, which corresponds to the transition of electrons from the O 2s valence band to the 4d conduction band of these three rare-earth elements. The peak at high energy (at around 28.0 eV) should be originated from the transition of electrons from the O 2p valence band to the 4d conduction band of rare-earth elements. The imaginary part function of DyInO3 at 10.1 eV is slightly stronger than that of the other two materials. As the energy increases, the peaks show a blue-shift from DyInO3 to HoInO3 and to ErInO3, which is consistent with the trend of the reflectivity curves of these three materials in Fig. 6(a) shown below.
 | ||
| Fig. 4 The real part (a) and the imaginary part (b) of the static dielectric function of hexagonal DyInO3, HoInO3 and ErInO3. | ||
3.3 Optical properties of hexagonal DyInO3, HoInO3 and ErInO3
We calculated the real part ε1(ω) and the imaginary part ε2(ω) respectively of dielectric function of hexagonal RInO3 in Perdew–Burke–Ernzerhof method by VASP and calculate the absorption spectrum coefficient α(ω),30,31
 | (3) |
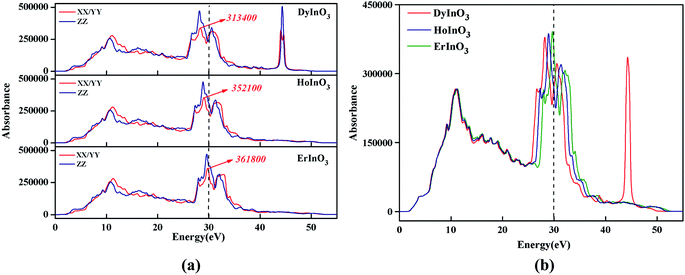
Fig. 5(a) shows the absorption spectra of unit-cell hexagonal DyInO3, HoInO3 and ErInO3 along the directions of XX, YY and ZZ respectively in the energy range from 0 to 60 eV. We can see from Fig. 5(a) that the absorption spectra of all three crystals are all very similar in the energy range from 0 to 25 eV. In the energy range from 25 to 30 eV, the absorption intensity of ErInO3 at the absorption peak along the XX direction is significantly larger than that of HoInO3, and the absorption intensity of DyInO3 is the smallest among these three compounds, while their absorption intensity along the ZZ direction is equivalent. The absorption spectrum of DyInO3 shows a distinct absorption peak at an energy of around 43 eV along all directions of XX, YY and ZZ, which is absent in the absorption spectra of both ErInO3 and HoInO3. The total absorption averaged over all three directions has been displayed in Fig. 5(b), from which we can see all three crystals show an absorption peak located at around 11 eV. Visible differences start to appear in the second peak region at around 30 eV. The three materials show very slight differences in peak intensities. A blue-shift of the peak can be observed with the decrease of atomic number of R. In addition, only DyInO3 has a distinct absorption peak at the energy of around 43 eV.
 | ||
| Fig. 5 Absorption spectra of hexagonal DyInO3, HoInO3 and ErInO3 along different directions respectively (a) and their comparison of total absorption spectra (b) in energy range from 0 to 60 eV. | ||
We calculate the reflectivity R(ω) and refractive index n(ω) of all three crystals under study according to the imaginary part of the dielectric function,
 | (4) |
 | (5) |
Fig. 6(a) shows the reflectivity of hexagonal DyInO3, HoInO3 and ErInO3, from which we can see that the strongest peak locates at around 10 eV. A similar trend as the absorption spectra can be found for the second peak which shows a shift with the increase of atomic number of R. Again, only DyInO3 has a reflectance peak at the energy of around 45 eV, the same as observed in the absorption spectra. In the energy range from 0 to 6 eV and 12 to 32 eV, the reflectivity curve of hexagonal RInO3 is lower than 0.2, showing that these three structures are transparent for photons in these energy ranges.
Fig. 6(b) shows the refractive index of unit-cell hexagonal DyInO3, HoInO3 and ErInO3. The refractive peak in the energy range from 0 to 10 eV arise from the transition from the O 2p to In 5s states, while a relatively small refractive peak at an energy of around 26 eV corresponds to the transition from the In 5p states to the conduction band. We can see from the figure that the static refractive index of DyInO3, HoInO3 and ErInO3 are calculated to be 2.130, 2.127 and 2.124 respectively, which are in good consistency with the trend in the dielectric constant curve as shown in Fig. 4(a). The high refractive index of DyInO3, HoInO3 and ErInO3 appearing in the low energy range reflect a high band gap,32,33 which is consistent with the band structure calculations.
We calculate the electron energy loss function L(ω) and molar extinction coefficient k(ω) of hexagonal DyInO3, HoInO3 and ErInO3 according to the imaginary part of the dielectric function,
 | (6) |
 | (7) |
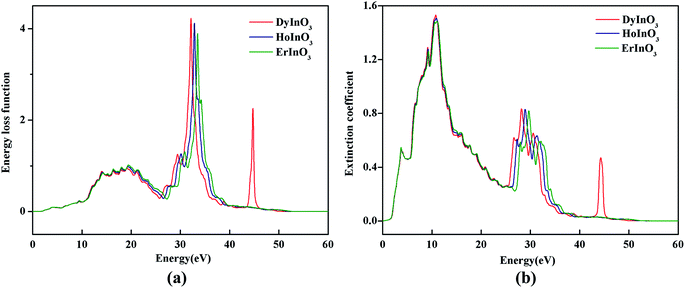
Fig. 7(a) shows the electron energy loss spectrum of hexagonal DyInO3, HoInO3 and ErInO3. The electron energy loss spectrum is the inelastic scattering of the incident electron beam in DyInO3, HoInO3 and ErInO3, and explores the electronic structure of them. We can see from Fig. 7(a) that there are 5 weak peaks in the electron energy loss spectrum of DyInO3, HoInO3 and ErInO3 in the energy range from 14 to 21 eV. At an energy of around 33 eV, they both have a narrow and sharp peak and the ordering of the energy loss function is DyInO3 > HoInO3 > ErInO3. The peaks of DyInO3, HoInO3 and ErInO3 occur at the energy of 32.2 eV, 33.0 eV and 33.5 eV respectively, which are related to the decrease of refractive index of DyInO3, HoInO3 and ErInO3 as shown in Fig. 6(b). It indicates that the unit-cell of hexagonal DyInO3, HoInO3 and ErInO3 can be used as effective optical storage materials at the energy of around 33 eV.
 | ||
| Fig. 7 The electron energy loss spectrum (a) and molar extinction coefficient (b) of hexagonal DyInO3, HoInO3 and ErInO3. | ||
Molar extinction coefficient, also known as molar absorptivity, refers to the extinction coefficient at a concentration of 1 mol L−1. When the unit of concentration is expressed in g L−1, the molar absorptivity k(ω) is numerically equal to the product of the extinction coefficient and the molecular weight (M) of the substance,
| k(ω) = α(ω)M | (8) |
Fig. 7(b) shows the molar extinction coefficient of unit-cell hexagonal DyInO3, HoInO3 and ErInO3. We can see the extinction peaks of DyInO3, HoInO3 and ErInO3 are the same as their absorption peaks at the energy of around 30 eV. However, unlike the trend of the absorption spectrum, the extinction peaks appearing at around 12 eV are larger than the extinction peak at 30 eV, which is also in good consistency with the trend of the reflectivity curves as shown in Fig. 6(a).
4 Conclusions
In this paper, we have studied the electronic structure, the optical and dielectric properties of hexagonal DyInO3, HoInO3 and DyInO3 by performing first principles studies. After optimization, the lattice parameters are in great agreement with the experimental values within an error of 1%. Our calculation has determined that the three hexagonal RInO3 in present study are indirect band gap crystals with band-gap values decreasing with the increase of atomic number. DOS calculations indicate that the electronic properties of hexagonal DyInO3, HoInO3 and ErInO3 are mainly provided by the strong bonding of In and O whereas lanthanides show limited effect. The dielectric properties and ionic contribution are calculated and a comparison has been made on the dielectric function including the static dielectric tensor. We have also calculated the absorption coefficient, the reflectivity, the refractive index, the conductivity and the electron energy-loss spectrum of hexagonal DyInO3, HoInO3 and DyInO3. The present study reveals that the dependence of the optical and dielectric properties of RInO3 on the rare-earth atomic number is not evident, which also can be a useful guideline in the manufacture of multifunctional devices based on RInO3.Conflicts of interest
There are no conflicts to declare.Acknowledgements
We acknowledge the National Nature Science Foundation of China (Grant No. 21573129 and 21403300). The authors also acknowledge a generous grant of computer time from the National Supercomputer Center in Tianjin-TianHe-1(A).References
- D. W. Bondurant and F. P. Gnadinger, Ferroelectrics for nonvolatile RAMs, IEEE Spectrum, 1989, 26, 30–33 Search PubMed.
- C. A. -Paz de Araujo, J. D. Cuchiaro, L. D. McMillan, M. C. Scott and J. F. Scott, Fatigue-free ferroelectric capacitors with platinum electrodes, Nature, 1995, 374, 627–629 CrossRef.
- R. Ramesh and N. A. Spaldin, Multiferroics: progress and prospects in thin films, Nat. Mater., 2007, 6, 21–29 CrossRef CAS PubMed.
- M. Bibes and A. Barthélémy, Towards a magnetoelectric memory, Nat. Mater., 2008, 7, 425–426 CrossRef CAS PubMed.
- E. Cockayne and B. P. Burton, Phonons and Static Dielectric Constant in CaTiO3 from First Principle, Phys. Rev. B: Condens. Matter Mater. Phys., 2000, 62, 3735 CrossRef CAS.
- G. A. Samara, The relaxational properties of compositionally disordered ABO3 perovskites, J. Phys.: Condens. Matter, 2003, 15, R367–R411 CrossRef CAS.
- T. Katsufuji, M. Masaki, A. Machida, M. Moritomo, K. Kato, E. Nishibori, M. Takata, M. Sakata, K. Ohoyama, K. Kitazawa and H. Takagi, Crystal structure and magnetic properties of hexagonal RMnO3 (R=Y, Lu and Sc) and the effect of doping, Phys. Rev. B: Condens. Matter Mater. Phys., 2002, 66, 134434 CrossRef.
- C. J. Fennie and K. M. Rabe, Polar phonons and intrinsic dielectric response of the ferromagnetic insulating spinel CdCr2S4 from first principles, Phys. Rev. B: Condens. Matter Mater. Phys., 2005, 72, 1–4 Search PubMed.
- Q. Zhang, G. Tan, L. Gu, Y. Yao, C. Jin, Y. Wang, X. Duan and R. Yu, Direct Observation of Multiferroic Vortex Domains in YMnO3, Sci. Rep., 2013, 3, 1–5 Search PubMed.
- M. G. Han, Y. Zhu, L. Wu, T. Aoki, V. Volkow, X. Wang, S. C. Chae, Y. S. Oh and S. W. Cheong, Ferroelectric Switching Dynamics of Topological Vortex Domains in a Hexagonal Manganite, Adv. Mater., 2013, 25, 2415–2421 CrossRef CAS PubMed.
- M. Lilienblum, T. Lottermoser, S. Manz, S. M. Selbatch, A. Cano and M. Fiebig, Ferroelectricity in the multiferroic hexagonal manganites, Nat. Phys., 2015, 11, 1070–1073 Search PubMed.
- B. B. V. Aken, T. T. M. Palstra, A. Filippetti and N. A. Spaldin, The origin of ferroelectricity in magnetoelectric YMnO3, Nat. Mater., 2004, 3, 164–170 CrossRef PubMed.
- Z. J. Huang, Y. Cao, Y. Y. Xue and C. W. Chu, Coupling between the ferroelectric and antiferromagnetic orders in YMnO3, Phys. Rev. B: Condens. Matter Mater. Phys., 1997, 56, 2623 CrossRef CAS.
- C. L. Lin, J. Liu, Y. C. Lin, X. D. Li and R. Li, Pressure-induced structural and vibrational evolution in ferroelectric RInO3 (R=Eu, Gd, Dy), Solid State Commun., 2013, 173, 51–55 CrossRef CAS.
- Y. B. Li, Y. Z. Wang, W. J. Tan, W. B. Wang, J. J. Zhang, J. W. Kim, S. W. Cheong and X. T. Tao, Laser floating zone growth of improper geometric ferroelectric GdInO3 single crystals with Z6 topological defects, J. Mater. Chem. C, 2018, 6, 7024 RSC.
- S. C. Abrahams, Ferroelectricity and structure in the YMnO3 family, Acta Crystallogr., Sect. B: Struct. Sci., 2001, 57, 485–490 CrossRef CAS PubMed.
- R. Shukla, V. Grover, S. K. Deshpande, D. Jain and A. K. Tyagi, Synthesis and Structural and Electrical Investigations of a Hexagonal Y1–xGdxInO3 (0.0 ≤ x ≤ 1.0) System Obtained via Metastable C-Type Intermediates, Inorg. Chem., 2013, 52, 13179–13187 CrossRef CAS PubMed.
- R. Shukla, F. N. Sayed, V. Grover, S. K. Deshpande, A. Guleria and A. K. Tyagi, Quest for Lead Free Relaxors in YIn1–xFexO3 (0.0 ≤ x ≤ 1.0) System: Role of Synthesis and Structure, Inorg. Chem., 2014, 53, 10101–10111 CrossRef CAS PubMed.
- V. Grover, R. Shukla, D. Jain, S. K. Deshpande, A. Arya, C. G. S. Pillai and A. K. Tyagi, Complex GdSc1–xInxO3 Oxides: Synthesis and Structure Driven Tunable Electrical Properties, Chem. Mater., 2012, 24, 2186–2196 CrossRef CAS.
- B. Paul, S. Chatterjee, S. Gop, A. Roy, V. Grover, R. Shukla and A. K. Tyagi, Evolution of lattice dynamics in ferroelectric hexagonal REInO3 (RE = Ho, Dy, Tb, Gd, Eu, Sm) perovskites, Mater. Res. Express, 2016, 3, 075703 CrossRef.
- H. Sawamoto, High-Pressure Synthesis of Perovskite Type RInO3(R=Eu, Gd, and Dy), Jpn. J. Appl. Phys., 1973, 12, 1432 CrossRef CAS.
- T. Tohei, H. Moriwake, H. Murata, A. Kuwabara, R. Hashimoto, T. Uamamoto and I. Tanaka, Geometric ferroelectricity in rare-earth compounds RGaO3 and RInO3, Phys. Rev. B: Condens. Matter Mater. Phys., 2009, 79, 744125 CrossRef.
- C. W. F. T. Pistorius and G. J. Kruger, Stability and structure of noncentrosymmetric hexagonal LnInO3 (Ln = Eu, Gd, Tb, Dy, Ho, Y), J. Inorg. Nucl. Chem., 1976, 38, 1471 CrossRef CAS.
- J. P. Perdew, K. Burke and M. Ernzerhof, Generalized Gradient Approximation Made Simple, Phys. Rev. Lett., 1996, 77, 3865 CrossRef CAS PubMed.
- G. Kresse and J. Furthmüller, Efficient iterative schemes for ab initio total-energy calculations using a plane-wave basis set, Phys. Rev. B: Condens. Matter Mater. Phys., 1996, 54, 11169 CrossRef CAS PubMed.
- G. Kresse and J. Furthmüller, Efficiency of ab-initio total energy calculations for metals and semiconductors using a plane-wave basis set, Comput. Mater. Sci., 1996, 6, 15 CrossRef CAS.
- H. J. Monkhorst and J. D. Pack, Special points for Brillouin-zone integrations, Phys. Rev. B: Solid State, 1976, 13, 5188–5192 CrossRef.
- C. W. F. T. Pistorius and G. J. Kruger, Stability and structure of noncentrosymmetric hexagonal LnInO3 (Ln = Eu, Gd, Tb, Ho, Y), J. Inorg. Nucl. Chem., 1976, 38, 1471–1475 CrossRef CAS.
- S. J. Clark, M. D. Segall, C. J. Pickard, P. J. Hasnip, M. I. J. Probert, K. Refson and M. C. Payne, First principles methods using CASTEP, Z. Kristallogr., 2005, 220, 567–570 CAS.
- S. Saha, T. P. Sinha and A. Mookerjee, Electronic structure, chemical bonding, and optical properties of paraelectric BaTiO3, Phys. Rev. B: Condens. Matter Mater. Phys., 2000, 62, 8828–8834 CrossRef CAS.
- C. Chen, T. Sasaki, R. Li, Y. Wu, Z. Lin, Y. Mori, Z. Hu, J. Wang, G. Aka, M. Yoshimura and others, Theoretical Basis for the Development of Borate Nonlinear Optical Crystals, Nonlinear Optical Borate Crystals, Principals and Applications, John Wiley & Sons, 2012 Search PubMed.
- B. Luo, X. Wang, E. Tian, G. Li and L. Li, Electronic structure, optical and dielectric properties of BaTiO3/CaTiO3/SrTiO3 ferroelectric superlattices from first-principles calculations, J. Mater. Chem. C, 2015, 3, 8625–8633 RSC.
- X. D. Zhang, M. L. Guo, W. X. Li and C. L. Liu, First-principle study of electronic and optical properties in wurtzite Zn1-xCdxO, J. Appl. Phys., 2008, 103, 063721 CrossRef.
| This journal is © The Royal Society of Chemistry 2020 |

