 Open Access Article
Biorefinery of turmeric (Curcuma longa L.) using non-thermal and clean emerging technologies: an update on the curcumin recovery step†
Maria Isabel Landim Neves ,
Monique Martins Strieder,
Renata Vardanega,
Eric Keven Silva and
M. Angela A. Meireles
 *
*
LASEFI/DEA/FEA (School of Food Engineering), UNICAMP (University of Campinas), Rua Monteiro Lobato, 80, Campinas, SP CEP 13083-862, Brazil. E-mail: maameireles@lasefi.com
First published on 23rd December 2019
Abstract
In this study, a biorefinery for the processing of turmeric (Curcuma longa L.) based on clean and emerging technologies has been proposed. High-intensity ultrasound (HIUS) technology was evaluated as a promising technique for curcumin recovery aiming to improve its extraction yield and technological properties as a colorant. In addition, we evaluated the effects of process conditions on the turmeric biomass after the extractions. The process variables were the number of stages of extraction with ethanol (1, 3 and 5) and the solvent to feed ratio (S/F) of 3, 5, 7, 9 (w/w). The highest curcumin content (41.6 g/100 g extract) was obtained using 1 wash and a S/F of 5 w/w, while the highest curcumin yield (3.9 g/100 g unflavored turmeric) was obtained using 5 stages and a S/F of 7. The extracts obtained by solid–liquid extraction assisted by HIUS showed a yellow color (157 and 169 of yellowness index) more intense than those obtained by the pressurized liquid extraction technique (101 of yellowness index) and better yield results than low-pressure solid–liquid extraction (using the same processing time). Thus, it was possible to obtain a characteristic yellow colorant with high curcumin yield in a short process time (5 min of extraction) using HIUS technology. Besides that, SEM images and FTIR spectra demonstrated that the turmeric biomasses processed by HIUS technology were not degraded.
1. Introduction
Curcuma longa L., commonly known as turmeric, has been traditionally used as an antioxidant, antiseptic, wound healing, and anti-inflammatory agent.1,2 In addition to its bioactive properties, curcumin has been used as a colorant, flavoring substance, and as a food preservative.2,3 In light of the curcumin importance for food and pharmaceutical industries, many studies have searched for ways to obtain curcumin from turmeric, seeking extraction processes that result in high yields while maintaining its bioactive properties.2,4–8The conventional process for obtaining turmeric powder, oleoresin and curcumin is presented in Fig. 1. In the conventional process, there is no full use of the vegetable matrix. Turmeric rhizomes are cooked in water and dried using air circulation dryers between 65 and 68 °C for obtaining turmeric powder by way an expensive and long process (48 h), in which the product is exposed to high temperature, light, and oxygen. Then, hexane solvent is added to the material for removing off-flavors generated by the cooking and drying process.9,10 Therefore, the conventional processing makes necessary the use of toxic organic solvents. In this sense, a production model-based on clean technologies can be used to overcome the main drawbacks associated with the turmeric processing chain.
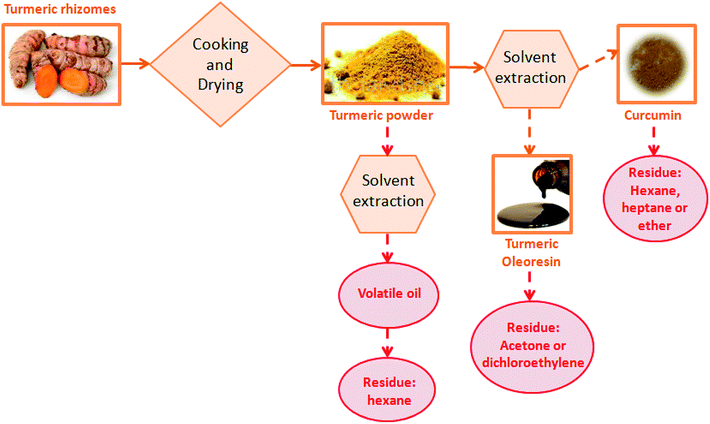 | ||
| Fig. 1 Process flow diagram for the conventional turmeric processing chain.9 | ||
A biorefinery model for turmeric processing from green emerging technologies which enables the full utilization of Curcuma longa L. is presented in Fig. 2. Biorefinery represents the exploration of all fractions originated from a single raw material.11 The turmeric biorefinery was studied by Silva, et al. (2018),12 where turmeric biomass was evaluated after the integration of emerging processes. In the first step, the oil fraction was recovered from turmeric powder by supercritical technology using carbon dioxide as a solvent. In the sequence, the pigments were extracted from unflavored turmeric powder by using pressurized liquid extraction (PLE) with ethanol as solvent. The use of alternative techniques such as supercritical carbon dioxide and pressurized ethanol have been studied to overcome the limitations of the conventional processes. These emerging processes are environmentally friendly and assist in better compound integrity.7,13
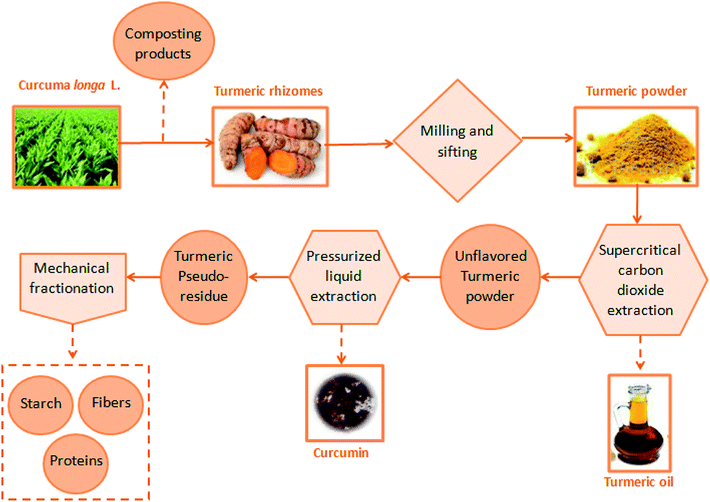 | ||
| Fig. 2 Turmeric's biorefinery from clean emerging technologies.7,14 | ||
The use of PLE technology to obtain curcumin extracts from turmeric powder using ethanol as a solvent was studied by Osorio-Tobón, et al. (2014).7 In general, the PLE procedure involves the use of liquid solvents at moderate to high-temperatures and pressures below their critical point.7,15 Curcumin is thermally unstable and can be degraded during longer extraction times even at moderate temperatures (60–80 °C).16 To overcome the drawbacks associated with the thermal sensitivity of several bioactive compounds, the development of non-thermal extraction techniques based on process intensification approaches is required.4,17
In this context, the solid–liquid extraction assisted by high-intensity ultrasound (HIUS) has proven to be an efficient emerging technology to recover phytochemical compounds from vegetable matrices, presenting advantages such as short processing time and high extraction yields compared to those obtained by conventional techniques.18 The efficiency improvement of solid–liquid extraction assisted by HIUS is based on the cavitation phenomenon, that causes intense shear stress associated with extreme levels of localized turbulence.18,19 The cavitation has a strong impact on the microstructure, causing ruptures that reduce the particle size and promotes better mass transfer. Also, the cavitation breaks up the surface of the cell walls, facilitating the solvent penetration into the cell and increasing the contact surface area between solid and liquid phases.20,21 The use of solid–liquid extraction assisted by HIUS is environmentally and economically advantageous in terms of less residue generation and short processing time.18 The recovery of curcumin assisted by HIUS technique can be a novel approach for the turmeric biorefinery, in which coproducts with high added value will be obtained by a non-thermal way with reduced processing time. HIUS technology requires low energy consumption to obtain high-quality phytochemical extracts and its low maintenance cost makes it economically profitable. HIUS technique is considered as the most feasible and economically lucrative large-scale application in the food field.22 Nonetheless, previous work done by our research group has shown that the turmeric biorefinery is economically viable employing SFE followed by PLE, therefore, it will most certainly be economically viable when PLE is substituted by HIUS.7,23 Osorio-Tobón, et al. (2016)23 performed an economic evaluation of an integrated process using SFE, PLE, and supercritical antisolvent (SAS) process to produce high-quality products derived from turmeric processing chain such as turmeric essential oil and powdered curcuminoid-rich extract. The authors demonstrated that the scale-up led to an increase in process productivity and a decrease in the cost of manufacture for both the products and concluded that the integrated process is a feasible alternative and an attractive option to produce derivatives from turmeric.
Previous studies developed by our research group showed that the turmeric biomass obtained after the volatile oil extraction using supercritical technology and curcuminoids by PLE technique exhibited a high content of dietary fiber (30 g/100 g), leading the authors to propose some applications for this material, such as wall material for encapsulation processes; fat replacer in processed foods; substance for addition to gluten-free pasta, cakes or bread; food additive for gelatinization, hydrogel formation, and digestibility; for adjusting the viscosity, food additive which include dietary fiber input; novel types of biodegradable plastics; food additive rich in antioxidants because it might contain quantities.12 Additionally, turmeric residue can be used for bioactive film production.6
Considering the full use of turmeric, the choice of non-thermal emerging extraction techniques with high extraction efficiency adds value to extracts and biomasses. Therefore, the solid–liquid extraction assisted by HIUS could be integrated into the turmeric biorefinery, replacing the PLE process in the curcumin recovery step. Since the HIUS process has a shorter processing time and lower process temperatures than PLE, besides a greater extraction efficiency. Thus, the aim of this study was to evaluate the HIUS as a potential step for curcumin recovery in a turmeric biorefinery approach that operates with non-thermal and clean emerging technologies. As well as to verify how the solid–liquid extraction assisted by HIUS conditions affect the characteristics of the resulting biomasses.
2. Material and methods
2.1. Turmeric
Turmeric rhizomes were donated by “Oficina das Ervas” (Ribeirão Preto, Brazil). The rhizomes were grounded in a knife mill (Marconi, model MA340, Piracicaba, Brazil) and were initially submitted to supercritical fluid extraction (SFE) for the volatile oil extraction at 60 °C and 25 MPa according to Carvalho, et al. (2014).13 The global yield was 6.4 ± 0.1 g/100 g rhizomes and the ar-turmerone yield was 1.02 ± 0.01 g/100 g rhizomes. After the volatile oil extraction, the remaining solid material was used as the unflavored turmeric. The particle size distribution was determined using sieves from 9 to 80 mesh (WS Tyler, Wheeling, USA), being the average particle diameter of 0.53 ± 0.01 mm.2.2. Solid–liquid extraction assisted by HIUS
The samples for the solid–liquid extraction assisted by HIUS were prepared using unflavored turmeric and ethanol 99.8% (Dinâmica, Brazil) to reach a final mass of 30 g. Solvent to feed ratios (S/F) of 3, 5, 7 and 9 (w/w) and different numbers of stages (1, 3, and 5 times) were the variables studied. The process conditions were evaluated through a randomized full factorial design (4 × 3), in duplicate, with a total of 24 experimental runs.The samples were processed using a 13 mm diameter ultrasonic probe (Unique, Disruptor, 500 W, Indaiatuba, Brazil) at 19 kHz and nominal power of 400 W during 1 min for all experiments. The height of the contact between the ultrasound probe and the mixture was kept at 15 mm. For the experiments performed with 3 and 5 stages, after the extraction period (1 min) the mixture containing extract and solvent was replaced by fresh solvent 2 or 4 times, which means that for the experiments with 1, 3 and 5 stages, the total extraction time was 1, 3 and 5 min, respectively.
After the extractions, the extracts were separated from the biomasses by centrifugation at 2500 rpm for 5 min. The extracts were left under air circulation for 2 days at room temperature and pressure and the biomass for 4 h to evaporate the solvent. Afterward, both were oven-dried at 40 °C under vacuum for 6 h to eliminate the residual solvent. The biomasses were stored in a desiccator in amber packages until performing the further analyzes. The extraction yield was calculated according to eqn (1).
 | (1) |
The acoustic power provided by the ultrasound probe was determined by calorimetric methodology and HIUS efficiency was calculated according to eqn (2).24
 | (2) |
2.3. Low-pressure solid–liquid extraction and PLE process
For comparison purpose, conventional low-pressure solid–liquid extraction and PLE process were carried out to obtain curcumin from unflavored turmeric. The low-pressure solid–liquid extraction (named as control) was performed in a shaker (Marconi, MA 420, Piracicaba, Brazil) at 200 rpm for 5 min at 25 °C using a S/F of 7. PLE process was performed according to the best condition (60 °C, 10 MPa, S/F = 10) reported by Osorio-Tobón, et al. (2014).7 The extracts and turmeric biomasses were stored for characterization as previously described for the samples obtained by solid–liquid extraction assisted by HIUS. These experiments were performed in duplicate.2.4. Extracts and turmeric residues characterization
 | (3) |
 | (4) |
 | (5) |
![[thin space (1/6-em)]](https://www.rsc.org/images/entities/char_2009.gif) :
:![[thin space (1/6-em)]](https://www.rsc.org/images/entities/char_2009.gif) 100 (sample/KBr) for reading. The spectra were recorded in the 4000–800 cm−1 region.
100 (sample/KBr) for reading. The spectra were recorded in the 4000–800 cm−1 region.2.5. Statistical analysis
The effect of the process conditions on extraction yield, curcumin yield, curcumin content and color parameters of the biomasses and dry extracts was evaluated by analysis of variance (ANOVA) using the Minitab 16® software (Minitab Inc., State College, PA, USA) with a 95% confidence level (p-value ≤ 0.05).3. Results and discussion
3.1. Acoustic power and energy efficiency of the HIUS process
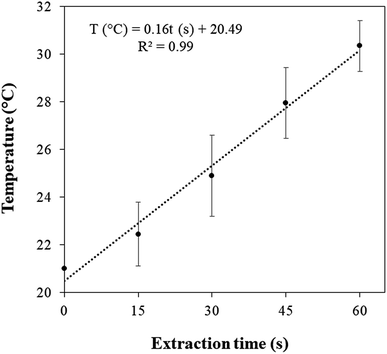
Fig. 3 presents the temperature profile of the extraction system (unflavored turmeric + ethanol) subjected to the HIUS process. From the calorimetric method, the acoustic power, real power provided by the ultrasound probe to the extraction system, was 13 ± 1 W. According to eqn (2), the HIUS efficiency was and 3.1%. A similar result was reported by Shirsath, et al. (2017).4 The authors verified an energy efficiency of 5.6% for the solid–liquid extraction assisted by HIUS of curcumin from Curcuma amada using a 20 mm probe diameter and employing a nominal power of 250 W.In addition, the HIUS processing in the conditions performed in this study was a non-thermal process. It was observed an increase of only 10 degrees during the extraction time, reaching about 30 °C.
3.2. Extraction yield
Fig. 4 presents the extraction yield obtained by HIUS using different S/F and the number of stages. Only the number of stages significantly influenced (p-value < 0.001) the extraction yield where the higher yields were obtained for extractions using more than one wash reaching to 11.0 ± 0.2 (g/100 g) with 5 stages and an S/F of 9 w/w. This result suggests that the use of fresh solvent in each wash favored the extraction because minimized the solvent saturation with curcumin during the process. Besides that, the contact time between the biomass and solvent was increased with the increase in the number of stages, which can also favor the extraction.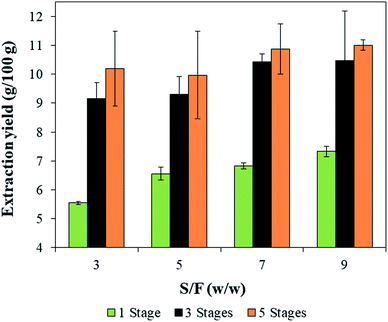 | ||
| Fig. 4 Extraction yields obtained by solid–liquid extraction assisted by HIUS with different S/F and number of stages. | ||
3.3. Curcumin recovery
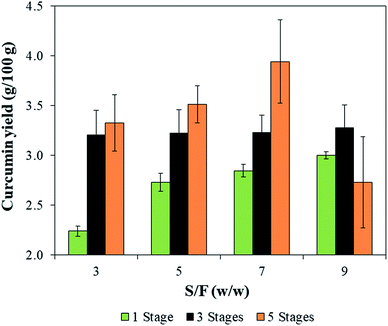
Fig. 5 presents the results for curcumin yield, where the highest value of 3.9 ± 0.4 g/100 g was obtained at S/F = 7 and 5 stages. These results agree with the literature since according to Kiamahalleh, et al. (2016),26 turmeric rhizomes contain 2 to 5 g/100 g of curcumin. For curcumin yield, both the number of stages (p-value = 0.001) and interaction between the number of stages and S/F (p-value = 0.04) had a positive effect on the curcumin yield.Wakte, et al. (2011)2 obtained 2.1 g/100 g of curcumin yield after 8 h of extraction using acetone as a solvent in a Soxhlet apparatus. The same authors recovered 0.7 g/100 g using ethanol and a probe ultrasonic system at a nominal power of 150 W. The curcumin yields obtained in the present study were higher than that reported in literature probably as a result of the more intensive ultrasound specific energy applied, whereas the nominal power was 60% higher in this study.
On the other hand, for the curcumin content, only the number of stages was significant (p-value < 0.001), the highest contents were obtained for the extractions employing only one wash, reaching up to 41.7 ± 0.3 g/100 g obtained at S/F = 5 (Fig. 6). This result is due to the lower amount of solvent used during the extraction, which in turn, minimize the dilution of curcumin. Although the use of one wash does not exhaust the curcumin content from the biomass, a more concentrated extract can be interesting in industrial applications. Besides that, the reduced extraction time (1 min) and the low amount of solvent used (S/F = 5 w/w) are the advantages of this process, considering that other solid–liquid extractions use higher S/F (10 w/w) and longer extraction times (about 1 h).26 Thus, it was possible to obtain high values of curcumin content reducing the process time and the amount of solvent employed thus, reducing the residue generation.
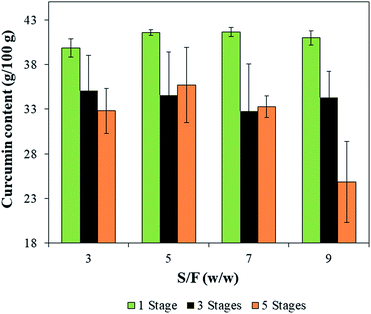 | ||
| Fig. 6 Curcumin contents of extracts obtained by solid–liquid extraction assisted by HIUS with different S/F and number of stages. | ||
3.4. Color of the turmeric residues
Another way of evaluating the efficiency of extraction of a colorant is verifying the color of the turmeric residues from which the colorant was recovered. The color of the turmeric residues according to the CIEL*a*b system are shown in Table 1.| HIUS conditions | Color parameter | Yellowness index average | |||
|---|---|---|---|---|---|
| S/F (w/w) | Number of stages | L | a* | b* | |
| a Mean values ± standard deviation (in triplicate, n = 3). | |||||
| 3 | 1 | 58 ± 2 | 17.3 ± 0.9 | 69 ± 2 | 171 |
| 3 | 3 | 57 ± 2 | 13.9 ± 0.7 | 63 ± 2 | 158 |
| 3 | 5 | 57.7 ± 0.8 | 15.0 ± 0.5 | 63 ± 1 | 158 |
| 5 | 1 | 57 ± 2 | 16.5 ± 0.6 | 68 ± 2 | 169 |
| 5 | 3 | 59.1 ± 0.6 | 14 ± 1 | 66 ± 1 | 159 |
| 5 | 5 | 59 ± 1 | 14.3 ± 0.3 | 66 ± 2 | 159 |
| 7 | 1 | 59 ± 1 | 16 ± 1 | 69 ± 1 | 168 |
| 7 | 3 | 58 ± 1 | 14.5 ± 0.7 | 65 ± 1 | 160 |
| 7 | 5 | 58 ± 1 | 13.4 ± 0.7 | 63 ± 2 | 156 |
| 9 | 1 | 58 ± 2 | 15 ± 1 | 66 ± 2 | 163 |
| 9 | 3 | 58 ± 2 | 14.4 ± 0.3 | 65 ± 2 | 160 |
| 9 | 5 | 58 ± 1 | 14 ± 1 | 64 ± 1 | 158 |
It is possible to observe in Table 1 that the major color variation occurred for the coordinates a* and b*. In general, the a* and b* values were reduced by increasing the number of stages, indicating a reduction of red and yellow colors of biomasses, which means that the colorant was more efficiently extracted. The same was observed for the yellowness index values indicating the yellow color reduction in the biomasses. These results agree with curcumin yield that also demonstrated that increasing the number of stages enable the greater recovery of curcumin.
3.5. Comparison of the solid–liquid extraction assisted by HIUS with other extraction techniques
The extraction conditions assisted by HIUS that provided the highest curcumin content [S/F = 5 and one stage, named as HIUS (S/F: 5S![[thin space (1/6-em)]](https://www.rsc.org/images/entities/char_2009.gif) :
:![[thin space (1/6-em)]](https://www.rsc.org/images/entities/char_2009.gif) 1)] and curcumin yield (S/F = 7 and 5 stages, named as S/F: 7S
1)] and curcumin yield (S/F = 7 and 5 stages, named as S/F: 7S![[thin space (1/6-em)]](https://www.rsc.org/images/entities/char_2009.gif) :
:![[thin space (1/6-em)]](https://www.rsc.org/images/entities/char_2009.gif) 1) were selected to be compared with the control and PLE processes and the results are presented in Fig. 7, 8 and Table 2.
1) were selected to be compared with the control and PLE processes and the results are presented in Fig. 7, 8 and Table 2.
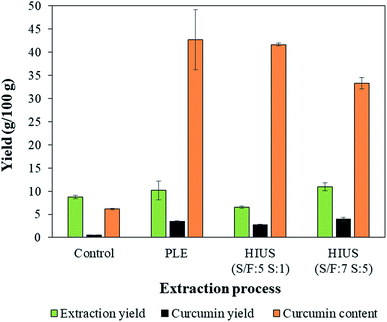 | ||
| Fig. 7 Extraction yield, curcumin yield and curcumin content obtained by different extraction techniques. | ||
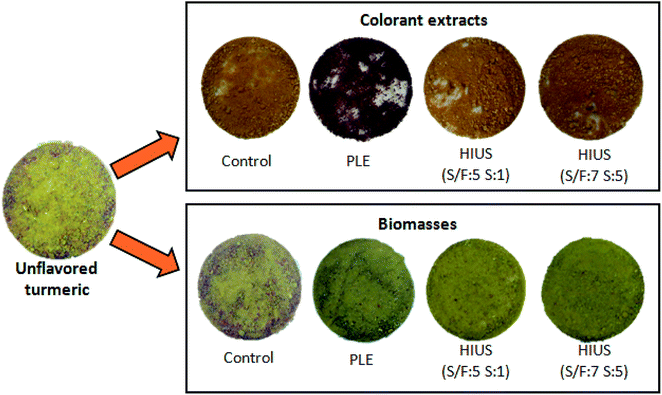 | ||
| Fig. 8 Unflavored turmeric, dry extracts and biomasses obtained by the different extraction techniques. | ||
| Product | Process | L | a* | b* | Yellowness index |
|---|---|---|---|---|---|
| a Mean values ± standard deviation (in duplicate, n = 2). Values followed by different letters in the same column show differences by Tukey's test at 95% significance (p-value < 0.05). Results are expressed in the dry base. | |||||
| Unflavored turmeric | — | 55.4 ± 0.2a | 25.4 ± 0.4a | 67.4 ± 0.2a | 174 |
| Dry extracts | Control | 45 ± 3a,b | 35 ± 2a | 54 ± 2a | 170 |
| PLE | 26 ± 1b | 27.1 ± 0.4a | 18 ± 1b | 101 | |
HIUS (S/F: 5S![[thin space (1/6-em)]](https://www.rsc.org/images/entities/char_2009.gif) : :![[thin space (1/6-em)]](https://www.rsc.org/images/entities/char_2009.gif) 1) 1) |
49 ± 3a | 27 ± 4a | 54 ± 3a | 157 | |
HIUS (S/F: 7S![[thin space (1/6-em)]](https://www.rsc.org/images/entities/char_2009.gif) : :![[thin space (1/6-em)]](https://www.rsc.org/images/entities/char_2009.gif) 5) 5) |
47 ± 1a,b | 35 ± 2a | 55 ± 2a | 169 | |
| Biomasses | Control | 55 ± 2a | 16.3 ± 1.1b | 65 ± 2a | 165 |
| PLE | 63 ± 2a | 9.4 ± 0.8b,c | 52 ± 1b | 118 | |
HIUS (S/F: 5S![[thin space (1/6-em)]](https://www.rsc.org/images/entities/char_2009.gif) : :![[thin space (1/6-em)]](https://www.rsc.org/images/entities/char_2009.gif) 1) 1) |
57 ± 2a | 16.5 ± 0.6b | 68 ± 2a | 169 | |
HIUS (S/F: 7S![[thin space (1/6-em)]](https://www.rsc.org/images/entities/char_2009.gif) : :![[thin space (1/6-em)]](https://www.rsc.org/images/entities/char_2009.gif) 5) 5) |
58 ± 1a | 13.4 ± 0.7b,c | 63 ± 2a | 156 | |
The extraction yield obtained by HIUS (S/F: 7S![[thin space (1/6-em)]](https://www.rsc.org/images/entities/char_2009.gif) :
:![[thin space (1/6-em)]](https://www.rsc.org/images/entities/char_2009.gif) 5) was (10.8 ± 0.8) g/100 g, which was the same value obtained by PLE ((10 ± 2) g/100 g) (Fig. 7). The highest curcumin yield was also obtained by HIUS using S/F = 7 and 5 stages ((3.9 ± 0.4) g/100 g) and PLE ((3.4 ± 0.2) g/100 g) with results statistically equal (Fig. 7). It can also be observed that the condition that resulted in a similar value curcumin content to that obtained by PLE ((43 ± 10) g/100 g) was HIUS (S/F: 5S
5) was (10.8 ± 0.8) g/100 g, which was the same value obtained by PLE ((10 ± 2) g/100 g) (Fig. 7). The highest curcumin yield was also obtained by HIUS using S/F = 7 and 5 stages ((3.9 ± 0.4) g/100 g) and PLE ((3.4 ± 0.2) g/100 g) with results statistically equal (Fig. 7). It can also be observed that the condition that resulted in a similar value curcumin content to that obtained by PLE ((43 ± 10) g/100 g) was HIUS (S/F: 5S![[thin space (1/6-em)]](https://www.rsc.org/images/entities/char_2009.gif) :
:![[thin space (1/6-em)]](https://www.rsc.org/images/entities/char_2009.gif) 1) that resulted in (41.6 ± 0.3) g/100 g. Although HIUS and PLE achieved similar results of curcumin yield and curcumin content, the HIUS process was shorter than the PLE since HIUS had a processing time of about 5 min while PLE was about 1 h.
1) that resulted in (41.6 ± 0.3) g/100 g. Although HIUS and PLE achieved similar results of curcumin yield and curcumin content, the HIUS process was shorter than the PLE since HIUS had a processing time of about 5 min while PLE was about 1 h.
Although the HIUS and PLE techniques presented similar results of curcumin yield and curcumin content, the color characteristics of the dried extracts presented significant differences (Table 2 and Fig. 8).
The extracts obtained by the HIUS as well as the control process presented b* values around 55 similarly to the values reported by Zheng, et al. (2017),27 who verified values between 66 ± 3 and 68 ± 3 for curcumin aqueous solutions. On the other hand, PLE extract presented a b* value of 18 ± 1, which does not characterize the yellow color of curcumin. In fact, the PLE extract presented a reddish color (Fig. 8 and Table 2) what can be a result of degradation process occurred due to the conditions in PLE process, which was of 60 °C for 1 h, which in turn, modified the extract coloration. Osorio-Tobón, et al. (2014)7 observed that as the temperature increased in the PLE process, the curcuminoids content in the extracts decreased. The preservation of yellow color observed in the HIUS extracts (yellowness index in Table 2) can be attributed to the low temperature used in this process that reached up to (30 ± 1) °C.
Besides that, in Fig. 8 were showed the unflavored turmeric and biomasses images, wherein is possible observed visual differences in the particle size and color. Unflavored turmeric and control presented a bigger particles size and a more intense coloration than PLE and HIUS biomasses. These results were consistent with the results of SEM and color.
3.6. Biomass characterization
![[thin space (1/6-em)]](https://www.rsc.org/images/entities/char_2009.gif) :
:![[thin space (1/6-em)]](https://www.rsc.org/images/entities/char_2009.gif) 1) and (S/F: 7S
1) and (S/F: 7S![[thin space (1/6-em)]](https://www.rsc.org/images/entities/char_2009.gif) :
:![[thin space (1/6-em)]](https://www.rsc.org/images/entities/char_2009.gif) 5). Although all samples presented an irregular shape, it can be observed in the micrographs that both HIUS processes caused morphological modifications in the biomasses. Analyzing the images at a magnitude of 250× (Fig. 9a), the size of the unflavored turmeric particles is larger than the biomasses because extractions processes promote rupture of the unflavored structure facilitating the release of the compounds. This effect was intensified when HIUS was applied due to the cavitation phenomenon.18,28 The fragmentation is due to collisions between particles and shock waves created from collapsed cavitation microbubbles in the liquid medium. The consequence of the size reduction of particles by ultrasound is the increase of the surface area of the solid, resulting in greater mass transfer and increase of extraction rate and yield.18,29,30
5). Although all samples presented an irregular shape, it can be observed in the micrographs that both HIUS processes caused morphological modifications in the biomasses. Analyzing the images at a magnitude of 250× (Fig. 9a), the size of the unflavored turmeric particles is larger than the biomasses because extractions processes promote rupture of the unflavored structure facilitating the release of the compounds. This effect was intensified when HIUS was applied due to the cavitation phenomenon.18,28 The fragmentation is due to collisions between particles and shock waves created from collapsed cavitation microbubbles in the liquid medium. The consequence of the size reduction of particles by ultrasound is the increase of the surface area of the solid, resulting in greater mass transfer and increase of extraction rate and yield.18,29,30
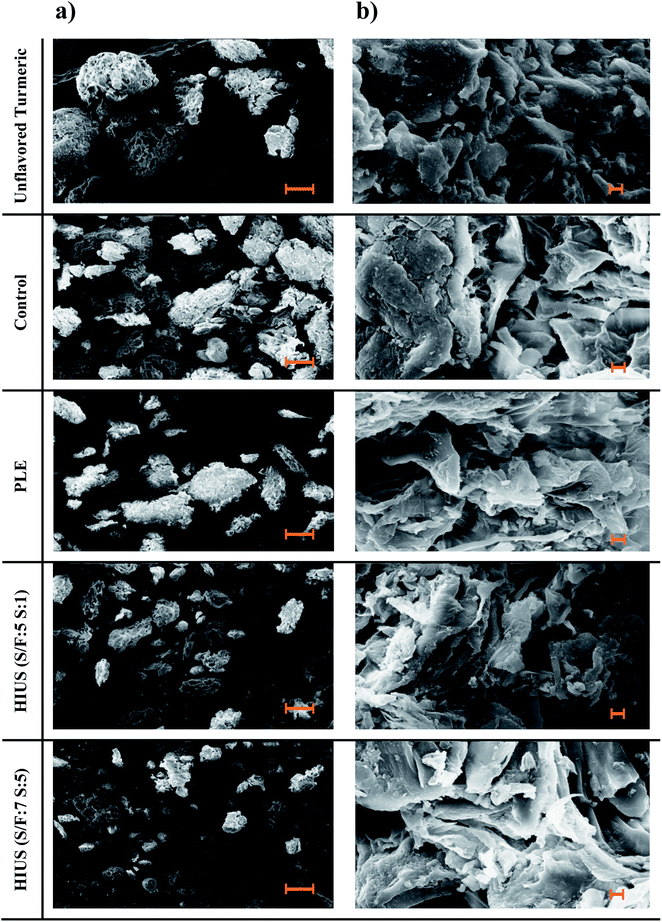 | ||
| Fig. 9 Morphology of the unflavored turmeric powder (before curcumin extraction processes), and biomasses (control, PLE and HIUS). (a) 250× (100 μm), (b) 5000× (2 μm). | ||
The micrographs at a magnitude of 5000× (Fig. 9b) show that, in general, the structure of the biomasses was not significantly altered by the extractions processes. This allows inferring that the processes do not affect its microstructure, which does not compromise its futures application. Comparing the different HIUS, it was observed that only the particle size was reduced in the HIUS (S/F: 7S![[thin space (1/6-em)]](https://www.rsc.org/images/entities/char_2009.gif) :
:![[thin space (1/6-em)]](https://www.rsc.org/images/entities/char_2009.gif) 5) due to the higher exposition to the acoustic cavitation, but there was no difference in the structures of biomasses, which means that regardless of the choice of process, the biomasses characteristics are preserved.
5) due to the higher exposition to the acoustic cavitation, but there was no difference in the structures of biomasses, which means that regardless of the choice of process, the biomasses characteristics are preserved.
Fig. 10 shows the FTIR spectrum of the unflavored turmeric and the biomasses obtained by the control, PLE and HIUS processes. It was possible to observe that different processes conditions did not alter the FTIR spectrum of the biomasses, demonstrating that the primary structure of the unflavored turmeric was preserved. This result can be attributed to the HIUS milder conditions (400 W for 1 and 5 min at 25 °C) used in the present study. The literature reports that HIUS process can alter the primary structure of biomass,31,32 which usually occurs due to high powers and energies applied 302 W cm−2 and 100 W respectively.
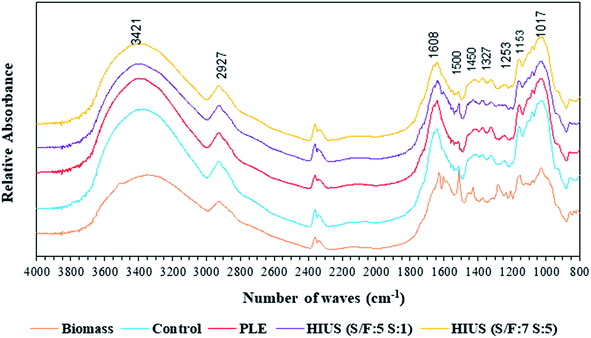 | ||
| Fig. 10 Fourier Transform Infrared Spectroscopy (FTIR) spectra of turmeric biomass and biomasses obtained by control, HIUS and PLE processes. | ||
The functional groups of the unflavored turmeric and biomasses were observed and the two bands in 4000–2000 cm−1 region, being abroad band centered at 3421 cm−1 assigned to hydrogen-bonded O–H stretching vibrations and the second one a weak signal at 2927 cm−1 due to C–H stretching vibrations, including CH, CH2, and CH3; these two bands are characteristics of all polysaccharides.33 Considering that the turmeric biomass has 81% of carbohydrates,12 the spectrum corroborates this information. The stretching peaks in the range of 950–1200 cm−1 was the characteristic absorbance of the polysaccharides.34 The band 1153 cm−1 represent the bending vibration of C–O–C. The broad band at 1620 cm−1 is mainly attributed to the OH bending mode of adsorbed water and protein amide (C![[double bond, length as m-dash]](https://www.rsc.org/images/entities/char_e001.gif) O).35 Bands at 1273, 1500 and 1313 cm−1 are close to the absorptions of aromatic ring vibration.36 Bands at 1017 cm−1 are due to C–O stretching vibration.37
O).35 Bands at 1273, 1500 and 1313 cm−1 are close to the absorptions of aromatic ring vibration.36 Bands at 1017 cm−1 are due to C–O stretching vibration.37
4. Conclusion
In this study, an upgrade for the turmeric biorefinery operating with clean emerging technologies was proposed. Our results demonstrated that HIUS processing was more efficient to recover curcumin from unflavored turmeric, with shorter processing time by a non-thermal way using mild temperature, which resulted in the maintenance of the color characteristics of the colorant. Although the curcumin yield and content obtained by HIUS process were the same obtained by PLE, the processing time of the HIUS was 12 times shorter than PLE. In addition, HIUS provided a dry extract with a yellow coloration characteristic of curcumin, differently from PLE that resulted in an extract with a reddish color. Therefore, the PLE process modified the curcumin coloration due to moderate temperature employed (60 °C), while HIUS reached 30 ± 1 °C. The biomasses obtained were not affected by the ultrasound treatment allowing their future applications, such as a gluten-free starch, modified starch, dietary fiber, natural encapsulating material, starchy material, and others.Conflicts of interest
There are no conflicts to declare.Acknowledgements
Maria Isabel L. Neves and Renata Vardanega thanks CAPES (Financial Code 001) for their doctoral and postdoctoral assistantships, respectively. Monique Martins Strieder thanks CNPq (141110/2018-0) for her doctoral assistantship. Eric Keven Silva thanks FAPESP (2015/22226-6) for his postdoctoral assistantship at University of Campinas. M. Angela A. Meireles thanks CNPq (302423/2015-0) for her productivity grant.References
- K. Bairwa, J. Grover, M. Kania and S. M. Jachak, RSC Adv., 2014, 4, 13946–13978 RSC.
- Y. Hu, J. Luo, W. Kong, J. Zhang, A. F. Logrieco, X. Wang and M. Yang, RSC Adv., 2015, 5, 41967–41976 RSC.
- P. Joshi, S. Jain and V. Sharma, Int. J. Food Sci. Technol., 2009, 44, 2402–2406 CrossRef CAS.
- S. Shirsath, S. Sable, S. Gaikwad, S. Sonawane, D. Saini and P. Gogate, Ultrason. Sonochem., 2017, 38, 437–445 CrossRef CAS PubMed.
- B. Hadi, M. M. Sanagi, W. A. W. Ibrahim, S. Jamil, M. AbdullahiMu'azu and H. Y. Aboul-Enein, Food Anal. Methods, 2015, 8, 1373–1381 CrossRef.
- B. C. Maniglia, R. L. de Paula, J. R. Domingos and D. R. Tapia-Blácido, LWT--Food Sci. Technol., 2015, 64, 1187–1195 CrossRef CAS.
- J. F. Osorio-Tobón, P. I. Carvalho, M. A. Rostagno, A. J. Petenate and M. A. A. Meireles, J. Supercrit. Fluids, 2014, 95, 167–174 CrossRef.
- V. Mandal, S. Dewanjee, R. Sahu and S. C. Mandal, Nat. Prod. Commun., 2009, 4, 95–100 CAS.
- A. S. Pereira and P. C. Stringheta, Hortic. Bras., 1998, 16, 102–105 CrossRef.
- J. Verghese, Flavour Fragrance J., 1993, 8, 315–319 CrossRef CAS.
- H. Bateni and K. Karimi, RSC Adv., 2016, 6, 34492–34500 RSC.
- E. K. Silva, M. Martelli-Tosi, R. Vardanega, G. C. Nogueira, G. L. Zabot and M. A. A. Meireles, J. Cleaner Prod., 2018, 189, 231–239 CrossRef CAS.
- P. I. N. Carvalho, J. F. Osorio-Tobón, M. A. Rostagno, A. J. Petenate and M. Meireles, in EMSF 2014: 14th European Meeting on Supercritical Fluids, 18–21 May, 2014, Marseilles, France, Poster 31 Search PubMed.
- Á. L. Santana, D. T. Santos and M. A. A. Meireles, Current Opinion in Green and Sustainable Chemistry, 2019, 18, 1–12 CrossRef.
- F. Chemat, N. Rombaut, A. Meullemiestre, M. Turk, S. Perino, A.-S. Fabiano-Tixier and M. Abert-Vian, Innov. Food Sci. Emerg. Technol., 2017, 41, 357–377 CrossRef CAS.
- O. Naksuriya, M. J. van Steenbergen, J. S. Torano, S. Okonogi and W. E. Hennink, AAPS J., 2016, 18, 777–787 CrossRef CAS PubMed.
- A. C. Kimbaris, N. G. Siatis, D. J. Daferera, P. A. Tarantilis, C. S. Pappas and M. G. Polissiou, Ultrason. Sonochem., 2006, 13, 54–60 CrossRef CAS PubMed.
- F. Chemat, N. Rombaut, A.-G. Sicaire, A. Meullemiestre, A.-S. Fabiano-Tixier and M. Abert-Vian, Ultrason. Sonochem., 2017, 34, 540–560 CrossRef CAS PubMed.
- E. K. Silva, M. T. M. Gomes, M. D. Hubinger, R. L. Cunha and M. A. A. Meireles, Food Hydrocolloids, 2015, 47, 1–13 CrossRef CAS.
- B. K. Tiwari, TrAC, Trends Anal. Chem., 2015, 71, 100–109 CrossRef CAS.
- H. S. Arruda, E. K. Silva, G. A. Pereira, C. F. F. Angolini, M. N. Eberlin, M. A. A. Meireles and G. M. Pastore, Ultrason. Sonochem., 2019, 50, 82–95 CrossRef CAS PubMed.
- A. C. Soria and M. Villamiel, Trends Food Sci. Technol., 2010, 21, 323–331 CrossRef CAS.
- J. F. Osorio-Tobón, P. I. N. Carvalho, M. A. Rostagno and M. A. A. Meireles, Food Bioprod. Process., 2016, 98, 227–235 CrossRef.
- P. R. Gogate, I. Z. Shirgaonkar, M. Sivakumar, P. Senthilkumar, N. P. Vichare and A. B. Pandit, AIChE J., 2001, 47, 2526–2538 CrossRef CAS.
- Y. Zhao, R. R. Huerta and M. D. Saldaña, J. Supercrit. Fluids, 2019, 148, 55–65 CrossRef CAS.
- M. V. Kiamahalleh, G. Najafpour-Darzi, M. Rahimnejad, A. A. Moghadamnia and M. V. Kiamahalleh, J. Chromatogr. B: Anal. Technol. Biomed. Life Sci., 2016, 1022, 191–198 CrossRef PubMed.
- B. Zheng, Z. Zhang, F. Chen, X. Luo and D. J. McClements, Food Hydrocolloids, 2017, 71, 187–197 CrossRef CAS.
- K. A. Kusters, S. E. Pratsinis, S. G. Thoma and D. M. Smith, Powder Technol., 1994, 80, 253–263 CrossRef.
- S. Both, F. Chemat and J. Strube, Ultrason. Sonochem., 2014, 21, 1030–1034 CrossRef CAS PubMed.
- Z. Xiong, M. Wang, H. Guo, J. Xu, J. Ye, J. Zhao and L. Zhao, New J. Chem., 2019, 43, 644–650 RSC.
- L. Zhang, X. Ye, T. Ding, X. Sun, Y. Xu and D. Liu, Ultrason. Sonochem., 2013, 20, 222–231 CrossRef CAS PubMed.
- A. Ebringerová and Z. Hromádková, Ultrason. Sonochem., 1997, 4, 305–309 CrossRef.
- G. A. Pereira, E. K. Silva, N. M. P. Araujo, H. S. Arruda, M. A. A. Meireles and G. M. Pastore, Ultrason. Sonochem., 2019, 55, 332–340 CrossRef CAS PubMed.
- Z. Liu, Z. Chen, F. Han, X. Kang, H. Gu and L. Yang, Ind. Crops Prod., 2016, 81, 152–161 CrossRef CAS.
- Y. Liu, Z. He, M. Shankle and H. Tewolde, Ind. Crops Prod., 2016, 79, 283–286 CrossRef CAS.
- F. Xu, J. Yu, T. Tesso, F. Dowell and D. Wang, Appl. Energy, 2013, 104, 801–809 CrossRef CAS.
- E. Rohaeti, M. Rafi, U. D. Syafitri and R. Heryanto, Spectrochim. Acta, Part A, 2015, 137, 1244–1249 CrossRef CAS PubMed.
Footnote |
| † Electronic supplementary information (ESI) available. See DOI: 10.1039/c9ra08265d |
| This journal is © The Royal Society of Chemistry 2020 |

