 Open Access Article
Study on the grain size control of metatitanic acid in a mixture acid system based on Arrhenius and Boltzmann fitting†
Ming Tianab,
Yahui Liu *ab,
Wei Zhaoab,
Weijing Wangab,
Lina Wangab,
Desheng Chenab,
Hongxin Zhaoab,
Fancheng Mengab,
Yulan Zhenab and
Tao Qi*ab
aNational Engineering Laboratory for Hydrometallurgical Cleaner Production Technology, Institute of Process Engineering, Beijing, 100190, PR China. E-mail: yhliu@ipe.ac.cn
bUniversity of Chinese Academy of Sciences, Beijing 100190, PR China
First published on 6th January 2020
Abstract
Herein, to control the particle size of metatitanic acid produced via titanium thermal hydrolysis in sulfuric–chloric mixture acid (SCMA) solutions, the relationship between its grain size and hydrolysis parameters is discussed, and the corresponding mathematical model was established using the experimental data. Firstly, Ti(OH)(SO4)(Cl)(H2O)3 was selected as the most likely initial structure in the SCMA solution by comparing the experimental and corresponding simulated Raman spectra by density functional theory (DFT). Secondly, according to the predicted initial structure of TiO2+ and the experimental data for the hydrolysis process, with an increase in the concentration of TiO2+ and reaction temperature, the hydrolysis rate and grain size increased, while the agglomerate particle size decreased. Finally, a mathematic model was established and fitted by the Arrhenius equation and the Boltzmann distribution to describe the relationship between the grain size and hydrolysis parameters, as follows: 
1. Introduction
Metatitanic acid is an important intermediate for the preparation of titanium dioxide, which is mainly obtained via the hydrolysis of titanyl sulfate solution.1 Controlling the particle size of metatitanic acid is the key step in the whole process since it directly decides the pigment performance. Thus, determining the relationship between particle size and hydrolysis parameters is an important reference for the flexible regulation of this process.2,3 Generally, suitable TiO2 products are only available through doping and calcinating metatitanic acid with a particle size of 1–2 μm, which originates from hydrolysis.3–11 Therefore, to obtain the appropriate metatitanic acid, the relationship between particle size and hydrolysis parameters, such as solution composition, acidity, and reaction temperature, must be clarified.In current popular single sulfuric/chloric systems, the hydrolysis degree and particle size of the obtained metatitanic acid significantly depends on the concentration of the titanium oxyacid salt (TiOSO4/TiOCl2) and the acid used (H2SO4/HCl).8,12 The temperature is also an important effective factor in the hydrolysis process.13 Hence, these parameters are frequently applied in mathematical models, e.g. Siamak developed a mathematical model to predict austenite phase transformation based on the Avrami model and the finite element method.14 Zhang et al.13 used a mathematical model based on the Avrami equation to study the precipitation and growth process of metatitanic acid particles in titanium sulfate solution and established a series of empirical expressions, but for agglomerated particles, these expressions are valuable only if their data is adapted to the titanium conversion rate and time variation. Based on single acid leaching data and mathematical models, it was found that the hydrolysis process typically undergoes three steps: (i) grain formation of crystallization, (ii) nuclei growth and hydrated titania precipitation, and (iii) hydrated titania aggregation and composition changes in the precipitate.15 Among these steps, the step of grain formation and growth plays an important role in particle growth and agglomeration, which influences the particle size and product properties during agglomeration. The other steps are related to the crystallization environment,16 nuclear growth and precipitation rate, thereby changing the aggregated particle size and its distribution.17
In other research, Ti cluster structures18 were proposed to explain the grain size formation and growth process. Using Raman spectroscopy,19 two complexes of [Ti(OH)2SO4] (aq.) and [Ti(OH)2(SO4)2]2− (aq.)9 were shown to exist in sulfuric solution, and [Ti(OH)nCl6−n]12 existed in TiOCl2 solution, which represent the essential intermediates in the hydrolysis processes. Based on these proven titanium intermediate structures, Wang et al.20 used the Boltzmann growth model to describe the influence of the initial concentration of TiOSO4 and sulfuric acid on the hydrolysis process and also proposed the mechanism of titanium hydrolysis in titanyl sulfate solution.21
However, in the above single sulfuric acid system, the low acidolysis rate problem for the perovskite phase titanium slag (CaTiO3) is still not fundamentally resolved due to the relatively high stability of CaTiO3 and relatively low solubility of CaSO4,22,23 although the thermal hydrolysis method was proposed to alleviate this problem based on its higher reaction rate and higher solubility. However, although in single chloric acid systems, the acidolysis rate problem can be resolved due to the solubility of CaCl2, the reaction rate is too fast and the particle size of metatitanic acid cannot be adjusted effectively in this system, resulting in poor quality titanium dioxide.
It is well known the Cl− has strong coordination ability, but if Cl− is added to the sulfuric acid system, strong coordinating interaction will occur between the titanium ions and Cl− anions, which will result in different clusters of titanium and more complicated structures in this mixture acid solution. Therefore, the relationship between primary particle size of metatitanic acid and hydrolysis parameter is of great significance for predicting the particle size and scale production of metatitanic acid. In addition, density functional theory (DFT) calculation was successfully introduced to study the hydrolysis process of metal ions.24,25 Meanwhile, Raman spectroscopy is also a very appropriate tool to study the fundamental physical properties of phase transitions and structural characteristics.26 Thus, the use of DFT calculation together with Raman spectroscopy can give information about the possible cluster structures existing in solution.27
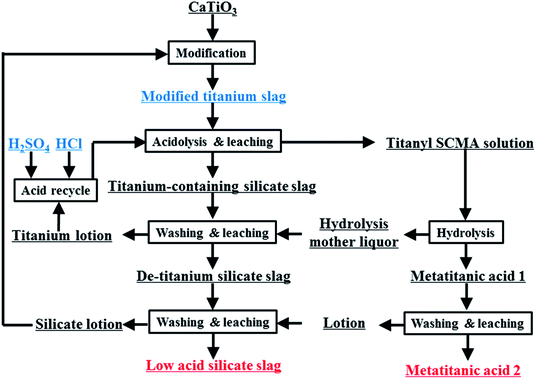
In this work, the sulfuric–chloric mixture acid (SCMA) system for TiO2 production is proposed for the first time as a new method to treat perovskite-phase titanium slag (Fig. 1). Based on DFT calculations, a series of TiO2+ structures in SCMA solution were first simulated and optimized using the DMol3 program,28 and their most suitable structures were evaluated by comparing the theoretical and experimental Raman spectra. The influence of the concentration of titanium and the reaction temperature on the titanium hydrolysis was determined via experimental and theoretical investigation. A series of hydrolysis relationships between the grain size and TiO2+ concentration was fitted to further predict the grain size of metatitanic acid, providing a meaningful basis for this new hydrolysis process.
2. Experimental and computational details
2.1 Experimental details
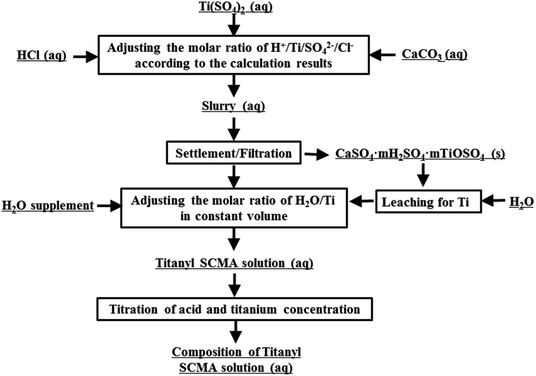
To maintain consistency with the titanium and acid concentration in the actual solutions and avoid the effect of impurities and other effects, the TiO2+ simulative solution was obtained by dissolving chemically pure solid Ti(SO4)2, aqueous HCl and deionized water, shown as Fig. 2. In this process, CaCO3 was used for CaSO4 precipitation to decrease the acidy of H+ in HCl and HSO4−, shown in eqn (1).29 However, in this solution, the concentration of SO42− was much more than that of Ca2+ and the concentration of Ca2+ was only about 0.1 g L−1. Thus, the effect of Ca2+ could be ignored in this work.These solutions, prepared with nTi![[thin space (1/6-em)]](https://www.rsc.org/images/entities/char_2009.gif) :
:![[thin space (1/6-em)]](https://www.rsc.org/images/entities/char_2009.gif) nH2O ratios of 22.98, 21.31, 19.65 and 17.98, corresponding to the titanium concentrations of 1.62, 1.75, 1.85, 1.97 mol L−1, respectively, were hydrolyzed in the temperature range of 110–150 °C for 4 h. The hydrolyzed metatitanic acid was leached and washed with deionized water and its properties were characterized via X-ray diffractometer (XRD, X'Pert PRO MPD, PANalytical, Netherlands) to determine the crystal phase and its composition. It also confirmed the grain sizes of A, B, and C and lattice parameters of a, b and c using the formula D = kλ/(β
nH2O ratios of 22.98, 21.31, 19.65 and 17.98, corresponding to the titanium concentrations of 1.62, 1.75, 1.85, 1.97 mol L−1, respectively, were hydrolyzed in the temperature range of 110–150 °C for 4 h. The hydrolyzed metatitanic acid was leached and washed with deionized water and its properties were characterized via X-ray diffractometer (XRD, X'Pert PRO MPD, PANalytical, Netherlands) to determine the crystal phase and its composition. It also confirmed the grain sizes of A, B, and C and lattice parameters of a, b and c using the formula D = kλ/(β![[thin space (1/6-em)]](https://www.rsc.org/images/entities/char_2009.gif) cos
cos![[thin space (1/6-em)]](https://www.rsc.org/images/entities/char_2009.gif) θ). The agglomerated particle size and its distribution were determined using a Mastersizer 2000 laser size analyzer (Malvern Instruments Co., Ltd., UK). The morphology characteristics were measured via SEM (JSM-7001F, Electron Company, Japan). Raman spectra were measured using a confocal laser Raman system (Horiba Jobin Yvon, LabRAM HR800, England) with a full area CCD detector and an Ar laser operating at 514.5 nm with 50 mW incident power. The Ti concentration (Ct) in the filtrate was examined by titration, where Ti4+ was reduced to Ti3+ with aluminum sheets and titrated with 0.10 mol L−1 ammonium iron(III) sulfate using acid ammonium thiocyanate as an indicator. Also, the hydrolysis ratio (α) was calculated using the equation α = [(Co − Ct)/Co] × 100%.
θ). The agglomerated particle size and its distribution were determined using a Mastersizer 2000 laser size analyzer (Malvern Instruments Co., Ltd., UK). The morphology characteristics were measured via SEM (JSM-7001F, Electron Company, Japan). Raman spectra were measured using a confocal laser Raman system (Horiba Jobin Yvon, LabRAM HR800, England) with a full area CCD detector and an Ar laser operating at 514.5 nm with 50 mW incident power. The Ti concentration (Ct) in the filtrate was examined by titration, where Ti4+ was reduced to Ti3+ with aluminum sheets and titrated with 0.10 mol L−1 ammonium iron(III) sulfate using acid ammonium thiocyanate as an indicator. Also, the hydrolysis ratio (α) was calculated using the equation α = [(Co − Ct)/Co] × 100%.
2.2. Theoretical calculation method
To ensure TiO2+ clusters were present in the SCMA solution, all the calculations were performed using the DMol3 software package with fine quality and geometry optimization convergence criteria at a threshold of 10−6 for the density convergence during the self-consistent field (SCF) minimization. According to the “d” electron present in titanium,30 the simplest calculation method was pseudopotential simulation. Besides, the solvation model31 with effective core potentials32 was performed, which replaced the chemically inert core electrons with an effective potential, and used to incorporate the dominant effects of relativity and has the advantage that the size of the basis set needed to treat the molecule can be significantly reduced. To consider the hydrogen polarization in solution, we used the DNP (double-numerical with “d” and “p” polarization) basis set and generalized-gradient approximation (GGA) density functional of Perdew–Burke–Ernzerhof (PBE).33After full geometry optimization, the Raman activity and intensities of the vibrational modes were calculated. The Raman spectra were fitted as a function of intensity at 298 K, incident light wavelength of 514.5 nm and smearing of 20 cm−1. All the structural figures were described using the Vesta software.28
3 Results and discussion
3.1 Structures of stable TiO2+ clusters in SCMA solution
In SCMA solution, the TiO2+ clusters have complex coordination structures composed of Cl−, SO42−, HSO4−, OH− and H2O. According to the reported sulfate method, the Ti4+ ion exists in the form of TiO2+ in solution.21 Therefore, its initial structure began with the already accepted models, regarded as the TiO2+–HSO4−–(H2O)3–Cl− cluster, considering the internal hydrogen bonds. Also, its optimized structure could be described as TiOH3+–SO42−–(H2O)3–Cl−, as shown in Fig. 3(b). However, the internal hydrogen bond of the SO42− in the titanium cluster was formed by H2O combined with Ti, so that there was no HSO4− structure in the cluster. Thus, structure (a) was obtained with a lower energy than that of structure (b) of 7.876 kJ mol−1 based on the DFT calculation results. Moreover, the structure of (a) was also more stable than that of (b) even in the water environment (embedded Ti clusters in ice super cell).34 | ||
| Fig. 3 Theoretical structures of (a) Ti(OH)(SO4)Cl(H2O)3, (b) Ti(OH)(SO4)Cl(H2O)3 and (c) [Ti(SO4)(Cl)(H2O)4]+. | ||
To find the most reasonable structures from them, the calculated Raman spectrum by DFT35 was compared with the experimental data.36 The corresponding Raman spectra highly agreed with the experimental result (TiO2 concentration of 1 mol L−1) in the range of 200–1300 cm−1. It can be clearly seen from Fig. 4(c) that the Raman peaks of the experimental data were very close to that of [Ti(SO4)Cl(H2O)4]+ having Cs point group symmetry but there was a strong peak caused by the vibration of Ti–O at 564 cm−1. By contrast, this peak at 564 cm−1 was not found in the simulated structures of Ti(OH)(SO4)Cl(H2O)3 (both (a) and (b)). However, the other main peaks were shifted compared to the experimental results. Thus, the effects of removing H+ from [Ti(SO4)Cl(H2O)4]+ was mainly reflected in two aspects: (i) the original symmetry (Cs point group) was destroyed and the number of peaks changed and (ii) the peak position varied with bond length. According to the structures in Fig. 3(a and b), the peaks associated with S–O (6) shifted to a lower wavenumber (peak B) due to the hydrogen bond formed by H+ and the O2− on SO42− due to its longer bond length and higher bond energy. Similarly, the peaks related to Ti–O bond (5) shifted to a higher wavenumber (peak A) because H2O became OH− due to its shorter bond length and lower bond energy. In summary, a reasonable explanation is that the internal hydrogen bond composed of H2O and SO42− was overestimated (the ability of DFT to calculate H still had some deviation), but regardless of the structure, it can be considered that the TiO2+ cluster has a structure between Ti(OH)(SO4)Cl(H2O)3 and [Ti(SO4)Cl(H2O)4]+. The full vibration analysis is shown in ESI Fig. 1 and 2.† After eliminating the influence of SO42− and HSO4−, as shown in Fig. 4(b), the structure of Ti(OH)(SO4)Cl(H2O)3 presented in SCMA solution was considered as the basis for controlling the metatitanic acid grain size.
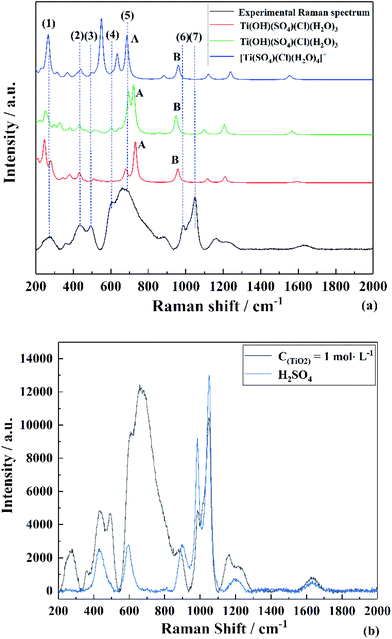 | ||
| Fig. 4 Experimental and theoretical Raman spectra of (a) TiO2+ clusters in SCMA solution and comparison with the Raman spectrum of (b) H2SO4. | ||
3.2 Calculation process between concentration of titanium and hydrolysis temperature
| TiO2+(aq) + H2O → TiO2(s) + 2H+(aq) | (1) |
ΔG = −RT{2![[thin space (1/6-em)]](https://www.rsc.org/images/entities/char_2009.gif) ln[H+] + ln[TiO2] − ln[H2O] − ln[TiO2+]} ln[H+] + ln[TiO2] − ln[H2O] − ln[TiO2+]}
| (2) |
Generally, the solid term of ln[TiO2] and the liquid term of ln[H2O] were not considered in the reaction calculation, but eqn (3) did not give the grain size species. In this calculation, it was assumed that all the Ti clusters were the most stable cluster structure of Ti(OH)(SO4)(Cl)(H2O)3. Therefore, the hydrolysis process can be expressed as Table 1.
When hydrogen ions enter the solution, they form hydronium ions, as shown in eqn (3):
| H+ + nH2O ↔ H2n+1O+ | (3) |
To simplify the calculation, we made n = 1. Before and after the reaction (Table 1), because H+ combined with H2O to form H3O+, the amount of free water can seem to have no change under this condition.38 In Table 1, nCl, nSO, and nw represent the number of free anions of Cl−, SO42− and free H2O, respectively, and Σn is regarded as their sum. In the hydrolysis calculation, the concentration (mol L−1) was replaced by the ratio of the number of particles before and after the reaction to the number of particles participating in the reaction. Therefore, eqn (3) could be estimated using the following formula, where η represents the hydrolysis rate:
ΔG = −kBT{2![[thin space (1/6-em)]](https://www.rsc.org/images/entities/char_2009.gif) ln[(nH + 2η)/(Σn + 1 + 3η)] + ln[(nCl + η)/(Σn + 1 + 3η)] + ln[(nSO + η)/(Σn + 1 + 3η)] + 2 ln[(nH + 2η)/(Σn + 1 + 3η)] + ln[(nCl + η)/(Σn + 1 + 3η)] + ln[(nSO + η)/(Σn + 1 + 3η)] + 2![[thin space (1/6-em)]](https://www.rsc.org/images/entities/char_2009.gif) ln[(nw)/(Σn + 1 + 3η)] − ln[(1 − η)/(Σn + 1 + 3η)] + ln[TiO2]} ln[(nw)/(Σn + 1 + 3η)] − ln[(1 − η)/(Σn + 1 + 3η)] + ln[TiO2]}
| (4) |
Simply eqn (4):
ΔG = −kBT{2![[thin space (1/6-em)]](https://www.rsc.org/images/entities/char_2009.gif) ln(nH + 2η) + ln(nCl + η) + ln(nSO + η) + 2 ln(nH + 2η) + ln(nCl + η) + ln(nSO + η) + 2![[thin space (1/6-em)]](https://www.rsc.org/images/entities/char_2009.gif) ln(nw) − ln(1 − η) − 5 ln(nw) − ln(1 − η) − 5![[thin space (1/6-em)]](https://www.rsc.org/images/entities/char_2009.gif) ln(Σn + 1 + 3η) + ln[TiO2]} ln(Σn + 1 + 3η) + ln[TiO2]}
| (5) |
ET = −kBT![[thin space (1/6-em)]](https://www.rsc.org/images/entities/char_2009.gif) ln[TiO2] ln[TiO2]
| (6) |
The value of ET included two aspects, on the one hand, it represents the energy of TiO2+ ion migration and aggregation related to the reaction temperature (the molecular average kinetic equation  ) and the distance between the Ti–Ti bond (concentration of titanium); on the other hand, it is related to the temperature and intergranular distance grain migration and aggregation energy.40
We assumed that the chemical reaction can be completely converted to titanium redistribution energy. The nucleation and growth of titanium dioxide crystals were also considered to be the same process. The results showed that the particles corresponding to the polymerization of titanium dioxide exist in two states: (i) in addition to the Ti–O–Ti bonds, other bonds such as Ti–SO42− and Ti–Cl, were inherited from the TiO2+ cluster structures on the surface of the nucleus. In this state, the number of Ti particles was ns; and (ii) Ti atoms were surrounded by O atoms and existed inside the crystal nucleus, and the number of Ti particles in this state was labeled as ni.
| nTiO2 → (TiO2)ni + (TiO2)ns | (7) |
The agglomeration may be due to the surface adsorption of TiO2. The grain was treated as a processing object and may exist in two states, as shown below. (i) The surface of the particles deposited on the surface of the agglomerates was labeled as ms and (ii) the surface of the particles inside the agglomerates was labeled as mi.
| m(TiO2)ns → ((TiO2)ni)mi + ((TiO2)ns)ms | (8) |
We assumed that the number of particles and the corresponding energy distribution could be solved using the Boltzmann distribution.41
 | (9) |
After deformation, an equation similar to the Arrhenius equation was obtained as eqn (10):
E1 − E0 = −kBT![[thin space (1/6-em)]](https://www.rsc.org/images/entities/char_2009.gif) ln(Ψ1/Ψ0) → E1 − E0 = −kBT ln(Ψ1/Ψ0) → E1 − E0 = −kBT![[thin space (1/6-em)]](https://www.rsc.org/images/entities/char_2009.gif) ln(n1/n0) ln(n1/n0)
| (10) |
Grain generation satisfied the following relationships (eqn (11)–(13)):
| n = ni + ns | (11) |
| niEni + nsEns = nETn | (12) |
Eni − Ens = −kBT![[thin space (1/6-em)]](https://www.rsc.org/images/entities/char_2009.gif) ln(nins−1) = Δn ln(nins−1) = Δn
| (13) |
 | (14) |
 | (15) |
After grain formation, the agglomeration process could be regarded as the grain growth and agglomeration competition, and the following relationships (eqn (16)–(18)) should be satisfied.
| m = mi + ms | (16) |
| miEmi + msEms = m(nsEns + ETm) | (17) |
Emi − Ems = −kBT![[thin space (1/6-em)]](https://www.rsc.org/images/entities/char_2009.gif) ln(mims−1) = Δm ln(mims−1) = Δm
| (18) |
So the Emi and Ems was deformed to:
 | (19) |
 | (20) |
Combine eqn (11)–(15) to eqn (19) and (20):
 | (21) |
 | (22) |
Finally:
 | (23) |
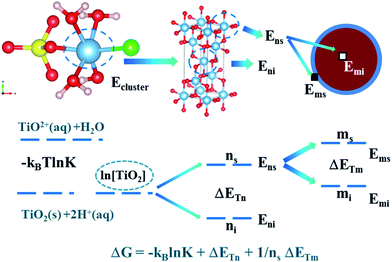
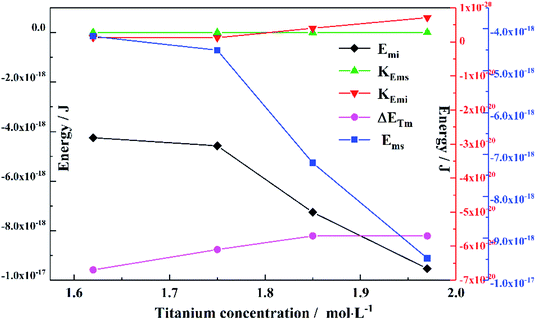
Therefore, the relationship between these different parts of energy is shown in Fig. 5. Based on the Boltzmann distribution and Arrhenius equation, the mathematical equations of the hydrolysis process can be established. It can be described as eqn (24):
ΔG = −kBT![[thin space (1/6-em)]](https://www.rsc.org/images/entities/char_2009.gif) ln ln![[thin space (1/6-em)]](https://www.rsc.org/images/entities/char_2009.gif) K + ΔETn + ns−1ΔETm K + ΔETn + ns−1ΔETm
| (24) |
Then, eqn (24) was substituted into eqn (5) to obtain an integrated and reasonable equation:
 | (25) |
In this calculation process, the nucleation and growth process was considered based on an anatase-type metatitanic acid model so that the cell size could be from A and C, the lattice size was a and c, and the volume and surface area were abstracted as the amount of titanium, then:
| n = 4A2C/(a2c) | (26) |
Further, the structure of anatase TiO2 was very regular, thus the structure in which the titanium oxide was stacked could be approximated. For a regular arrangement of planes, the calculation of the number of surface particles was:
| ni = (A − a/2)2(C − c/4)/(4(a/2)2(c/4)) | (27) |
| ns = n − ni | (28) |
In addition, the spherical particles were calculated using the metatitanic acid agglomerate particle size (D50), thus:
| m = 1/6πD503/A2C | (29) |
Similar to the calculation of m, the calculation of ms and mi was:
| mi = 1/6π[(D50 − A)2(D50 − C)]3/(A2C) | (30) |
| ms = m − mi | (31) |
3.3 Grain size fitting of metatitanic acid based on experimental results
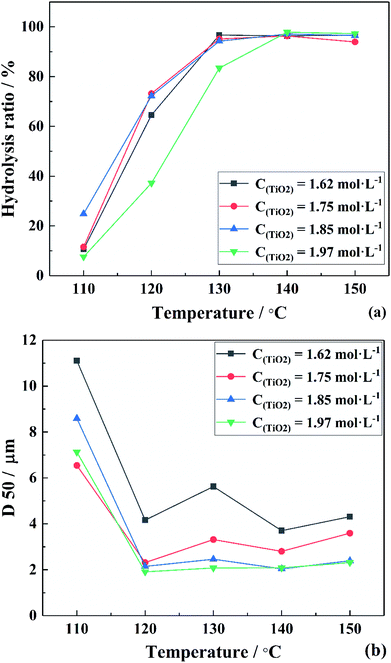
To verify the above formulas, the experimental conditions were consistent with the structural model. As the reaction temperature increased, the hydrolysis ratio increased and D50 decreased, as shown in Fig. 6.20 The particle size distributions appeared unimodal at 110–130 °C and peak width was fixed at 150 °C, as shown in Fig. 7. The titanium concentration also had a significant effect on the aggregated particle size and the size distribution. Moreover, the XRD pattern confirmed that all the samples were anatase phase TiO2 (ref. 43) (Fig. 8(a)). The influence of hydrolysis parameters such as titanium concentration and reaction temperature could be ignored in the XRD patterns. It was apparently seen from the SEM images that the metatitanic acid particles aggregated to form a spherical shape, which proves the rationality that we derived all the above formulas by considering all the particles as spherical, as shown in Fig. 8(b). The series of related calculation results is shown in Tables S1 and S2.†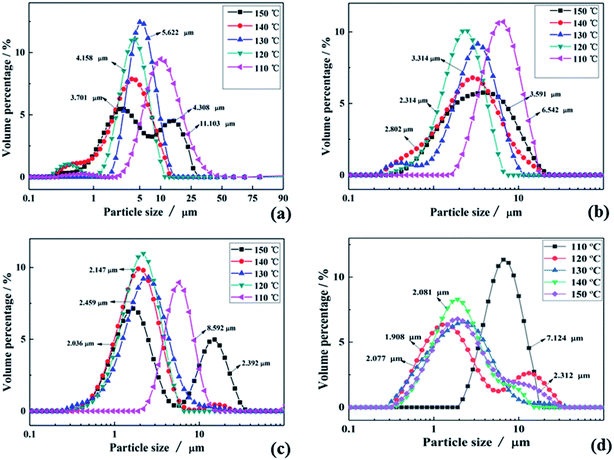 | ||
| Fig. 7 Particle size distributions in the temperature range of 110–150 °C for (a) C(TiO2) = 1.62 mol L−1, (b) C(TiO2) = 1.75 mol L−1, (c) C(TiO2) = 1.85 mol L−1 and (d) C(TiO2) = 1.97 mol L−1. | ||
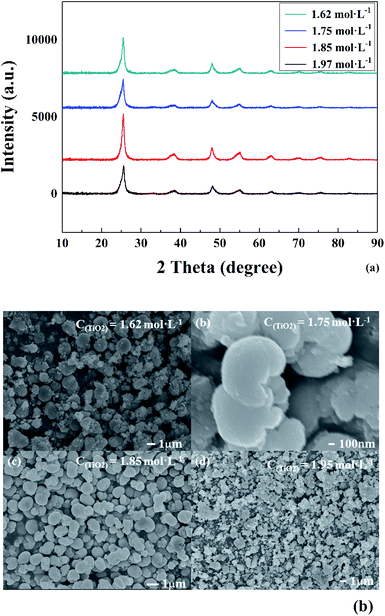 | ||
| Fig. 8 (a) XRD spectra and (b) morphology of metatitanic acid in different titanium concentrations (1.62–1.97 mol L−1). | ||
As can be seen from Table S1,† when the value of ns was relatively large, the influence of the  species was ignored. In the actual calculation, the
  species was considered as a part of y in the equation to calculate the value of Ems and Emi. Thus, the original unit of mol L−1 was replaced with a new calculation. To eliminate this, the value of K was introduced, which has a function similar to ΔGθ, yielding:
 | (32) |
Let ΔG = 0, eqn (32) transformed into the form of y = ax + b to solve the value of Ems and K shown in eqn (33):
 | (33) |
As mentioned above, both Emi and Ems are related to the reaction temperature and titanium concentration. However, to fit the function, Emi and Ems were only related to the titanium concentration.
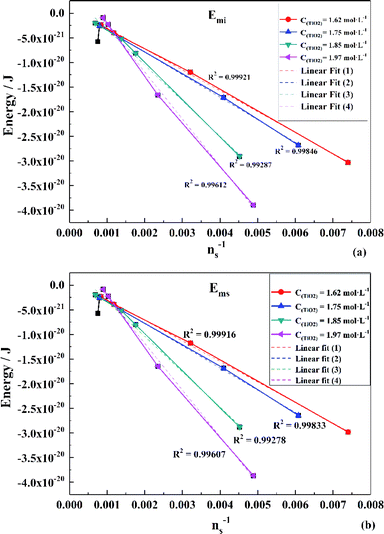
To obtain the values of Emi and Ems, the experimental results were linearly analyzed, as shown in Fig. 9. From the fitting results (Fig. 10), it was found that the value of Δm gradually decreased as the titanium concentration increased. This indicates that the reaction driving force decreased and the possibility of agglomeration was reduced also. As a result, the aggregation particle size decreased.43 Besides, the magnitude of ns−1ΔETm compared to the other parameters was small enough to be ignored (Tables S1 and S2†). Therefore, we only considered the item of ΔETn according to eqn (24). According to the above fitting process, the relationships among reaction temperature, titanium concentration and particle size were well explained. However, the relationship was hard to apply to predict the particle size of metatitanic acid from the original structure of the TiO2+ solution and hydrolysis temperature. Therefore, the (0,0) point was introduced to eliminate the K item in this calculation and the corrected value of Emi was obtained.
The fitting results of Emi and Ems over the point (0,0) is shown in Fig. 11. The relationship is consistent with that in Fig. 10. Thus, eqn (33) was simplified as:
 | (34) |
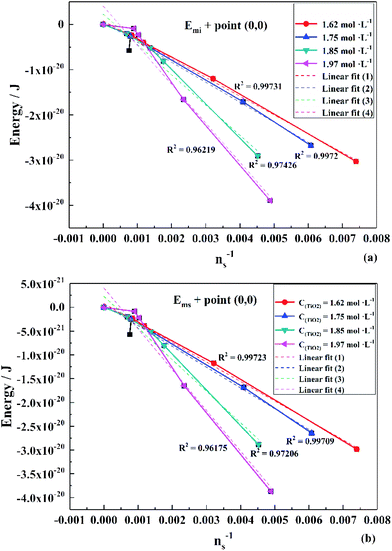 | ||
| Fig. 11 Linear fit of (a) Emi and (b) Ems over the point (0,0) in different titanium concentrations (1.62–1.97 mol L−1). | ||
Emi is related to the steady-state conditions under which the reaction occurred. When there was no hydrolysis reaction, the corresponding values of Emi and Ems were zero.
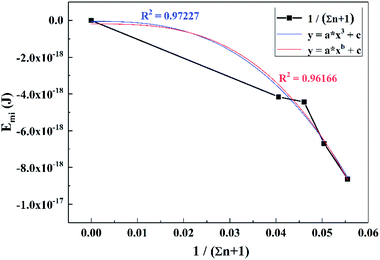
To obtain the relationship between Emi and titanium concentration, CTi was converted into (1/Σn + 1), which simplified the calculation process and the results were fitted to the function of y = axb + c, as shown in Fig. 12. The expressions of Emi−Ti are displayed as eqn (35):
| Emi = −2.305 × 10⁻¹⁴(1/Σn + 1)2.7 − 4.851 × 10⁻²⁰ | (35) |
For the convenience of calculation, the number of times was adjusted from 2.7 to 3, and thus a similar function with a higher degree of fit was obtained, expressed as:
| Emi = −4.949 × 10⁻¹⁴(1/Σn + 1)3 − 1.898 × 10⁻¹⁹ | (36) |
After calculation, the range of K value was 7.770 × 10⁻²²–4.062 × 10⁻²¹ and that of the ns value was 102–103. In contrast, the c/ns value (−1.898 × 10⁻¹⁹/102–103) was of the same magnitude as the K item and they could cancel each other approximately. Finally, eqn (36) became:
 | (37) |
If the volume was transformed into a sphere and all items could be converted to an expression related to grain size, r (0.2 nm represents the length of the Ti–O bond), then eqn (37) could be further simplified:
 | (38) |
By solving the r value, the equilibrium grain size required for the hydrolysis reaction could be obtained if the titanium concentration was 0–2 mol L−1. Besides, according to the theory molecular models, the basic conditions for using this formula should be the molar ratio of Cl−/Ti > 2, SO42−/Ti > 2 and H+/Ti > 3. The established analytical model can be used under all of the above conditions.
4. Conclusions
A low concentration of titanyl sulfuric–chloric mixture acid (SCMA) system was first proposed to treat the titanium slag perovskite phase. Since the particle size of metatitanic acid is an important intermediate for the whole production process, a series of hydrolysis procedures was investigated as follows to control the particle size of metatitanic acid in this new system:(a) The predicted initial structure of Ti(OH)(SO4)(Cl)(H2O)3 was obtained by comparing the theoretical and experimental Raman spectra after calculation and optimization by DFT. Also, the hydrolysis reaction can be described as follows (b) and (c).
(b) Based on the Boltzmann distribution and Arrhenius equation, the mathematical equations of the hydrolysis process were established, which can be described as ΔG = −kBT![[thin space (1/6-em)]](https://www.rsc.org/images/entities/char_2009.gif) ln
ln![[thin space (1/6-em)]](https://www.rsc.org/images/entities/char_2009.gif) K + ΔETn + ns−1ΔETm.
K + ΔETn + ns−1ΔETm.
(c) According the experimental data, an equation of  was developed to illustrate the relationships among grain size, particle size, temperature, hydrolysis ratio and titanium concentration.
Therefore, after determining the hydrolysis parameters, the grain size could be roughly estimated to provide a theoretical basis for the hydrolysis process in the sulfuric–chloric mixture acid system, which should be helpful for further industrial production.
Conflicts of interest
There are no conflicts to declare.Acknowledgements
The authors gratefully support from the projects endorsed by the National Key R&D Program of China (2018YFC1900500), Key Research Program of Frontier Sciences of Chinese Academy of Sciences (Grant No. QYZDJ-SSW-JSC021), National Natural Science Foundation of China (51774260, 51804289, 51904286, 21908231) and CAS Interdisciplinary Innovation Team. The authors would like to thank Beijing Key Laboratory of Ionic Liquids Clean Process, Key Laboratory of Green Process and Engineering, State Key Laboratory of Multiphase Complex Systems, Institute of Process Engineering, Chinese Academy of Sciences for providing the computational resources and materials studio (version 6.1, MS DMol3 Parallel).References
- I. Szilágyi, E. Königsberger and P. M. May, Characterization of Chemical Speciation of Titanyl Sulfate Solutions for Production of Titanium Dioxide Precipitates, Inorg. Chem., 2009, 48, 2200–2204 CrossRef PubMed.
- B. Grzmil, D. Grela, B. Kic and M. Podsiady, Effects of processing parameters on hydrolysis of TiOSO4, Pol. J. Chem. Technol., 2009, 11(3), 15–21 Search PubMed.
- N. El-Hazek, T. A. Lasheen, R. El-Sheikh and S. A. Zaki, Hydrometallurgical criteria for TiO2 leaching from Rosetta ilmenite by hydrochloric acid, Hydrometallurgy, 2007, 87, 45–50 CrossRef CAS.
- Z. Zhu, W. Zhang and C. Y. Cheng, A literature review of titanium solvent extraction in chloride media, Hydrometallurgy, 2011, 105, 304–313 CrossRef CAS.
- B. Grzmil, D. Grela and B. Kic, Hydrolysis of titanium sulphate compounds, Chem. Pap., 2008, 62, 18–25 CAS.
- B. Grzmil, D. Grela and B. Kic, Effects of processing parameters on hydrolysis of TiOSO4, Pol. J. Chem. Technol., 2009, 11(3), 15–21 Search PubMed.
- L. Zheng, B. Liang, L. Lü, L. Jia and C. Li, Effect of impurities on the hydrolysis of low-concentration titanyl sulfate solutions, Res. Chem. Intermed., 2014, 41, 5423–5438 CrossRef.
- C. X. Tian, Concentration of TiOSO4 on Rutile White via Short Sulfate Process, Adv. Mater. Res., 2014, 968, 40–43 CAS.
- F. Baillon, E. Provost and W. Fürst, Study of titanium(IV) speciation in sulphuric acid solutions by FT-Raman spectrometry, J. Mol. Liq., 2008, 143, 8–12 CrossRef CAS.
- C. Tian, S. Huang and Y. Yang, Anatase TiO2 white pigment production from unenriched industrial titanyl sulfate solution via short sulfate process, Dyes Pigm., 2013, 96, 609–613 CrossRef CAS.
- C. Charbonneau, R. Gauvin and G. P. Demopoulos, Nucleation and growth of self-assembled nanofibre-structured rutile (TiO2) particles via controlled forced hydrolysis of titanium tetrachloride solution, J. Cryst. Growth, 2009, 312, 86–94 CrossRef CAS.
- R. C. Chen, Hydrolysis process of TiCl4, Hydrometallurgy of China, vol. 71, 1999 Search PubMed.
- W. Zhang, C. Ou and Z. Yuan, Precipitation and growth behaviour of metatitanic acid particles from titanium sulfate solution, Powder Technol., 2017, 315, 31–36 CrossRef CAS.
- S. Serajzadeh, A mathematical model for prediction of austenite phase transformation, Mater. Lett., 2004, 58, 1597–1601 CrossRef CAS.
- C. X. Tian, S. H. Huang and Y. Yang, Influences of Hydrolysis Temperature and Hydrolysis Time on Titanium White Pigment via Short Sulfate Process, Adv. Mater. Res., 2012, 602–604, 1255–1260 Search PubMed.
- J. H. Lee and Y. S. Yang, Effect of hydrolysis conditions on morphology and phase content in the crystalline TiO2 nanoparticles synthesized from aqueous TiCl4 solution by precipitation, Mater. Chem. Phys., 2005, 93, 237–242 CrossRef CAS.
- W.-J. Li, E.-W. Shi, W.-Z. Zhong and Z.-W. Yin, Growth mechanism and growth habit of oxide crystals, J. Cryst. Growth, 1999, 203, 186–196 CrossRef CAS.
- M. Pu and B.-F. Zhang, Theoretical study on the microstructures of hydrotalcite lamellae with Mg/Al ratio of two, Mater. Lett., 2005, 59, 3343–3347 CrossRef CAS.
- M. Grätzel and F. P. Rotzinger, Raman spectroscopic evidence for the existence of titanyl (TiO2+) in acidic aqueous solutions, Inorg. Chem., 1985, 24, 2320–2321 CrossRef.
- W. Wang, D. Chen, J. Chu, J. Li, T. Xue, L. Wang, D. Wang and T. Qi, Influence and hydrolysis kinetics in titanyl sulfate solution from the sodium hydroxide molten salt method, J. Cryst. Growth, 2013, 381, 153–159 CrossRef CAS.
- W. Wang, Y. Liu, T. Xue, J. Li, D. Chen and T. Qi, Mechanism and kinetics of titanium hydrolysis in concentrated titanyl sulfate solution based on infrared and Raman spectra, Chem. Eng. Sci., 2015, 134, 196–204 CrossRef CAS.
- S. He, H. Sun, D. g. Tan and T. Peng, Recovery of Titanium Compounds from Ti-enriched Product of Alkali Melting Ti-bearing Blast Furnace Slag by Dilute Sulfuric Acid Leaching, Procedia Environ. Sci., 2016, 31, 977–984 CrossRef.
- L. s. Li and Z. t. Sui, Physical Chemistry Behavior of Enrichment Selectivity of TiO2 in Perovskite, Acta Phys.-Chim. Sin., 2001, 17, 845–849 CAS.
- J. D. Kubicki, Self-Consistent Reaction Field Calculations of Aqueous Al3+, Fe3+, and Si4+ Calculated Aqueous-Phase Deprotonation Energies Correlated with Experimental ln(Ka) and pKa, J. Phys. Chem. A, 2001, 105, 8756–8762 CrossRef CAS.
- H. A. De Abren, L. Guimarães and H. A. Duarte, Density-Functional Theory Study of Iron(III) Hydrolysis in Aqueous Solution, J. Phys. Chem. A, 2006, 110, 7713–7718 CrossRef PubMed.
- H. A. Gilg and N. Gast, Determination of titanium content in pyrope by Raman spectroscopy, J. Raman Spectrosc., 2016, 47, 486–491 CrossRef CAS.
- F. L. R. e. Silva, A. A. A. Filho, M. B. da Silva, K. Balzuweit, J.-L. Bantignies, E. W. S. Caetano, R. L. Moreira, V. N. Freire and A. Righi, Polarized Raman, FTIR, and DFT study of Na2Ti3O7 microcrystals, J. Raman Spectrosc., 2018, 49, 538–548 CrossRef.
- K. Momma and F. Izumi, VESTA 3 for three-dimensional visualization of crystal, volumetric and morphology data, J. Appl. Crystallogr., 2011, 44, 1272–1276 CrossRef CAS.
- L. Yahui, A TiO2 pigment production method by sulfuric–chloric mixture acid decomposing titanium slags, Chinese patent, CN107963656A, 2018 Search PubMed.
- L. You and X. Song, A study of low Young's modulus Ti–Nb–Zr alloys using d electrons alloy theory, Scr. Mater., 2012, 67, 57–60 CrossRef CAS.
- A. Kornherr, A. Tortschanoff, E. Portuondo-Campa, F. van Mourik, M. Chergui and G. Zifferer, Modelling of aqueous solvation of eosin Y at the rutile TiO2 (110)/water interface, Chem. Phys. Lett., 2006, 430, 375–379 CrossRef CAS.
- S. C. McKenzie, E. Epifanovsky, G. M. J. Barca, A. T. B. Gilbert and P. M. W. Gill, Efficient Method for Calculating Effective Core Potential Integrals, J. Phys. Chem. A, 2018, 122, 3066–3075 CrossRef CAS PubMed.
- M. Mohamad, B. Ul Haq, R. Ahmed, A. Shaari, N. Ali and R. Hussain, A density functional study of structural, electronic and optical properties of titanium dioxide: characterization of rutile, anatase and brookite polymorphs, Mater. Sci. Semicond. Process., 2015, 31, 405–414 CrossRef CAS.
- M. Tian, Y. Liu, W. Wang, W. Zhao, D. Chen, L. Wang, H. Zhao, F. Meng, Y. Zhen, Z. Hu and T. Qi, Mechanism of synthesis of anatase TiO2 pigment from low concentration of titanyl sulfuric–chloric acid solution under hydrothermal hydrolysis, J. Chin. Chem. Soc., 2019, 1–11 Search PubMed.
- J. Guo, X. Deng, C. Song, Y. Lu, S. Qu, Y. Dang and Z. X. Wang, Differences between the elimination of early and late transition metals: DFT mechanistic insights into the titanium-catalyzed synthesis of pyrroles from alkynes and diazenes, Chem. Sci., 2017, 8, 2413–2425 RSC.
- H. A. De Abren, L. Guimarães and H. A. Duarte, Density Functional Theory Study of Iron(III) Hydrolysis in Aqueous Solution, J. Phys. Chem., 2006, 110, 7713–7718 CrossRef PubMed.
- Y. Liu, D. Shao, W. Wang, L. Yi, D. Chen, H. Zhao, J. Wu, T. Qi and C. Cao, Preparation of rutile TiO2 by hydrolysis of TiOCl2 solution: experiment and theory, RSC Adv., 2016, 6, 59541–59549 RSC.
- A. C. Gulafroz Meraj, Hydrogen bonded hydrated Hydronium and Zündel ion complexes, J. Mol. Liq., 2014, 190, 1–5 CrossRef.
- F. Civan, Temperature Effect on Power for Particle Detachment from Pore Wall Described by an Arrhenius-Type Equation, Transp. Porous Media, 2006, 67, 329–334 CrossRef.
- M. P. R. Frech, Application of the Compensated Arrhenius Formalism to Dielectric Relaxation, J. Phys. Chem. B, 2009, 113, 16118–16123 CrossRef PubMed.
- A. Brandenburger and K. Steverson, Axioms for the Boltzmann Distribution, Found. Phys., 2019, 49, 444–456 CrossRef PubMed.
- R. H. R. Castro and B. Wang, The Hidden Effect of Interface Energies in the Polymorphic Stability of Nanocrystalline Titanium Dioxide, J. Am. Ceram. Soc., 2011, 94, 918–924 CrossRef CAS.
- S. Sathyamoorthy, G. D. Moggridge and M. J. Hounslow, Controlling Particle Size During Anatase Precipitation, AIChE J., 2001, 47, 2012–2024 CrossRef CAS.
Footnote |
| † Electronic supplementary information (ESI) available. See DOI: 10.1039/c9ra08503c |
| This journal is © The Royal Society of Chemistry 2020 |

