 Open Access Article
Controlling the electric permittivity of honeycomb-like core–shell Ni/CuSiO3 composite nanospheres to enhance microwave absorption properties†
Rambabu Kuchi‡
abc,
Taha Latif‡a,
Sung Woo Leea,
Viet Dongquoca,
Phuoc Cao Van a,
Dongsoo Kimbc and
Jong-Ryul Jeong
 *a
*a
aDepartment of Materials Science and Engineering, Graduate School of Energy Science and Technology, Chungnam National University, Daejeon 34134, South Korea. E-mail: jrjeong@cnu.ac.kr; Fax: +82-42-822-5850; Tel: +82-42-821-6633
bPowder & Ceramics Division, Korea Institute of Materials Science, Changwon, Gyeongnam 51508, South Korea
cConvergence Research Center for Development of Mineral Resources, Korea Institute of Geoscience and Mineral Resources, Daejeon 34132, South Korea
First published on 7th January 2020
Abstract
Controlling impedance matching and enhancing absorption properties are crucial for developing next-generation microwave absorbing materials. Herein, we report the facile preparation of honeycomb-like core–shell nickel/copper silicate (Ni/CuSiO3) composite nanospheres with controlled shell (CuSiO3) thickness to control impedance matching and enhance absorption properties. The nanospheres with a shell thickness of about 30 nm had greatly improved microwave absorption performance. They exhibited a strong reflection loss of −39.5 dB (9.6 GHz) at the absorber thickness of 2.5 mm, with a wide effective absorbing bandwidth of 4.8 GHz (7.8–12.6 GHz). This remarkable microwave absorption performance is attributed to a novel structure that enhanced interfacial polarization and controlled shell thickness, resulting in good impedance matching of electromagnetic properties (ε, μ) and magnetic loss. Our permittivity-controlled core–shell Ni/CuSiO3 composite nanospheres could be used to fabricate novel high-performance microwave absorbers.
1 Introduction
Extensive research has been conducted on the design and fabrication of highly effective electromagnetic (EM) wave absorbers to suppress unwanted EM wave reflections. These absorbers are of great interest for electric and electronic devices, and in military and industrial applications.1–5 Ferromagnetic materials are the most promising candidates for EM absorbers because of their high EM loss efficiency.1–3 Notably, nickel (Ni)-based absorbers are easy to prepare and display high permeability in the GHz range.6–9 However, severe eddy current loss in the GHz range caused by high conductivity results in impedance mismatch between the material and air space, which decreases microwave absorption performance. Eddy current loss can also decrease the permeability, in which case there is a deterioration of the matching between the permittivity (ε) and permeability (μ).9,10 Additionally, oxidation and corrosion occur when Ni is used at high temperatures and in corrosive environments. These shortcomings can be overcome using inorganic/nonmagnetic coating materials. Core–shell composite microstructures can also improve microwave absorption performance by controlling the impedance mismatch.4,11,12Various types of core–shell composite microstructures have been reported based on Ni as the core material and different shell materials including polymers, C, SnO2, TiO2, SiO2, ZnO, ZnS, CuO, and graphene composites.9,13–20 Zhao et al. reported ZnS-wrapped Ni spheres that exhibited a reflection loss (RL) of −42.4 dB with high effective bandwidth.17 Deng et al. prepared ZnO nanorod-coated Ni spheres and reported an RL of −30.2 dB.20 Zhao et al. reported Ni@TiO2 and Ni@SiO2 core–shell composites and found that the SiO2 shell had better microwave absorption properties and anti-oxidation capability than pure Ni or Ni@TiO2.9 These reports concluded that the coating material plays a decisive role in obtaining good EM wave absorption properties through impedance matching, cooperation between the EM parameters (ε, μ), core and shell synergistic effects, and interfacial polarizations.
Copper silicate (CuSiO3) has been used as a shell material for magnetic core materials because of its good dielectric and anti-oxidation properties, ease of preparation, and low cost.21,22 Core–shell composites having CuSiO3 as the shell have been used as microwave absorbers due to the enhanced polarization obtained with the highly dielectric CuSiO3 shell and a magnetic core.21–25 The combination of CuSiO3 as the shell with a Ni magnetic core would be advantageous because more interfaces could be created, along with enhanced polarization. Furthermore, a design with a variable shell thickness would facilitate impedance matching between the EM properties (ε and μ) of the core–shell nanospheres because the shell thickness has a strong influence on ε and μ. Notably, the ε value can be easily tuned by controlling the shell (CuSiO3) thickness of Ni/CuSiO3 composite nanospheres. No integrated CuSiO3 and Ni core–shell microstructures have been reported to date.
Herein, we report the facile synthesis of honeycomb-like core–shell Ni/CuSiO3 composite nanospheres. The shell thickness was readily controlled by varying the concentration of Ni spheres in the intermediate step of the sol–gel (Stöber) method used in their preparation. The Ni/CuSiO3 composite nanospheres with a 30 nm-thick shell exhibited enhanced EM absorption properties, including strong RL and wide effective absorption bandwidth. This behavior is attributed to the novel honeycomb-like structure, well-controlled ε value that resulted in higher microwave attenuation, and good impedance matching. These core–shell Ni/CuSiO3 nanospheres with an adjustable shell thickness have great potential as high-performance EM wave absorbers.
2 Experimental
Materials
Nickel(II) chloride hexahydrate (NiCl2·6H2O), copper nitrate trihydrate (Cu(NO3)2·3H2O), sodium hypophosphate (NaH2PO2), tetraethyl orthosilicate (TEOS), sodium hydroxide (NaOH), sodium acetate (NaAc), sodium citrate, and glycerol were purchased from Sigma-Aldrich and used as received.Preparation of Ni nanospheres, Ni/SiO2 nanospheres, and honeycomb-like core–shell Ni/CuSiO3 composite nanospheres
Nickel spheres were synthesized using a hydrothermal method. Briefly, 0.6 g of NiCl2·6H2O was dissolved in a mixture of glycerol (15 mL) and deionized (DI) water (5 mL). To this mixture was added 1.5 g of NaAc and 0.1 g of sodium citrate; the solution was stirred until homogeneous. Meanwhile, another solution was prepared by dispersing NaOH (0.8 g) and NaH2PO2 (0.6 g) in DI water (10 mL). Then, the two solutions were combined and transferred into an autoclave for heat treatment at 140 °C for 15 h. The resultant gray-colored product was separated from the reaction solution using a permanent magnet and washed with ethanol and DI water. The powdered product (Ni) was obtained after vacuum drying at 60 °C. These Ni spheres were then used to prepare Ni/SiO2 spheres according to the sol–gel procedure reported elsewhere.22 The Ni spheres (0.5 g) were dispersed in an ethanol/DI water mixture (8![[thin space (1/6-em)]](https://www.rsc.org/images/entities/char_2009.gif) :
:![[thin space (1/6-em)]](https://www.rsc.org/images/entities/char_2009.gif) 2 volume ratio), followed by addition of ammonia solution (2 mL). Then, 0.6 mL of TEOS was added dropwise to the solution, which was then stirred for about 10 h. The obtained products were washed with DI water and ethanol three times by magnetic decantation and dried in a vacuum oven. These Ni/SiO2 spheres were treated hydrothermally to obtain the final honeycomb-like Ni/CuSiO3 core–shell composites, as previously described.22 Typically, 0.03 g of Ni/SiO2 spheres was dissolved in 30 mL of DI water by ultrasonication. Under ultrasonication, 1.5 mL of ammonia solution and 1.5 mL of 0.1 M aqueous solution of Cu(NO3)2·3H2O were added to the solution. The mixed solution was transferred to an autoclave for hydrothermal treatment at 120 °C for about 12 h. The final products were obtained after washing three times with ethanol and DI water using magnetic decantation and dried in a vacuum oven.
2 volume ratio), followed by addition of ammonia solution (2 mL). Then, 0.6 mL of TEOS was added dropwise to the solution, which was then stirred for about 10 h. The obtained products were washed with DI water and ethanol three times by magnetic decantation and dried in a vacuum oven. These Ni/SiO2 spheres were treated hydrothermally to obtain the final honeycomb-like Ni/CuSiO3 core–shell composites, as previously described.22 Typically, 0.03 g of Ni/SiO2 spheres was dissolved in 30 mL of DI water by ultrasonication. Under ultrasonication, 1.5 mL of ammonia solution and 1.5 mL of 0.1 M aqueous solution of Cu(NO3)2·3H2O were added to the solution. The mixed solution was transferred to an autoclave for hydrothermal treatment at 120 °C for about 12 h. The final products were obtained after washing three times with ethanol and DI water using magnetic decantation and dried in a vacuum oven.
Characterization
The size and morphology of the nanospheres were observed by field-emission scanning electron microscopy (FE-SEM; S-4800; Hitachi, Japan), transmission electron microscopy (TEM; Tecnai G2 F30; FEI, USA), high-resolution TEM (HRTEM), and bright-field high-angle annular dark-field scanning transmission electron microscopy (BF/HAADF-STEM). The elemental composition was determined using energy-dispersive X-ray spectroscopy (EDS). The crystal structure and phases were both studied by X-ray diffraction (XRD; D8 Advance; Bruker, Germany) and Micro diffraction using two-dimensional detectors (XRD; Discover; Bruker, Germany). Magnetization (M–H) curves were obtained using a vibrating sample magnetometer (VSM; Lakeshore 7304; Lakeshore Cryotronics, Inc., USA). The EM properties were studied using a network analyzer (N5245A; Agilent, USA) in the microwave range (2–18 GHz) for evaluation of RL. A toroidal sample (diameter (φ)outer: 6.95 mm; (φ)inner: 3.05 mm) was prepared by blending powders (30 wt%) with paraffin wax. The RL of a composite absorber can be calculated from using eqn (1) and (2):2
RL = 20![[thin space (1/6-em)]](https://www.rsc.org/images/entities/char_2009.gif) log|(Zin − Z0)/(Zin + Z0)| log|(Zin − Z0)/(Zin + Z0)|
| (1) |
 | (2) |
3 Results and discussion
The synthesis of the core–shell Ni/CuSiO3 composite nanospheres is illustrated in Fig. 1. The Ni nanospheres prepared by the hydrothermal treatment appeared as walnut-like spheres with rough surfaces. These are obtained by the reduction of Ni2+ ions in alkaline medium with sodium hypophosphite (NaH2PO2) at 140 °C for 15 h. By considering the ecological, economical and handling factors, NaH2PO2 is better reducing agent than the hydrazine (N2H4) which was commonly used in preparation of Ni particles.26 Thus, in this work we select NaH2PO2 for the reduction purpose of Ni2+ ions. At first, Ni2+ ions formed from the dissociation of NiCl2 in water and glycerol mixed solvent medium then it will reduced to metallic Ni with reducing agent (NaH2PO2) at strong alkali medium. This process has been represented as follows by eqn (3).| Ni2+ + 2OH− + 2H2PO2 → Ni + 2HPO2− + 2H2O | (3) |
 | ||
| Fig. 1 Schematic illustration of the synthesis of the core–shell nickel/copper silicate (Ni/CuSiO3) composite nanospheres. | ||
Alkali medium (pH ∼ 10) was created from the NaOH and Na-citrate and will be regulated and maintained by the presence of NaAc, which acts as stabilizing buffer. The heating temperature (140 °C) and alkali medium favor to accelerating the kinetics for the homogeneous nucleation of Ni. Then the Ni spheres are obtained through the self-assembly of Ni particles into a walnut-like fashion at reaction temperature of 140 °C, keeping for 15 h. They were coated with SiO2 using the Stöber sol–gel process. The SiO2 coating protected the Ni core from air oxidation and modified the surface by minimizing the curvature thereof.18,24 The Ni/SiO2 spheres were treated hydrothermally in basic medium and with a copper salt to form CuSiO3 shells by the reaction of silicate anions from SiO2 in the alkaline solution with the copper ions from dissolved Cu(NO3)2·3H2O.
The morphology and size of the products at each stage are shown in Fig. 2. Fig. 2(a–c) shows that the walnut-like-shaped Ni nanospheres were about 350 nm in diameter and had curved surfaces. The Ni/SiO2 nanospheres displayed a uniform SiO2 coating (about 30 nm-thick) with smoother surface morphology (Fig. 2(d–f)) than the Ni nanospheres. The BF/HAADF-STEM images and elemental maps revealed that the Ni spheres were completely covered with an SiO2 layer (Fig. S1†). The thickness of this layer could be regulated by simply varying the Ni concentration. For example, 0.3, 0.5, and 0.6 g of Ni gave 50-, 30-, and 20 nm-thick SiO2 layers, respectively (Fig. S2†). The final composite nanospheres had a core–shell structure (Fig. 2(g–i)). The inset SEM image (Fig. 2(g)) and TEM image (Fig. 2(h and i)) shows that the honeycomb-like CuSiO3 layer was composed of many CuSiO3 flakes, which aggregate in a honeycomb-like fashion. The resulting honeycomb-like core–shell Ni/CuSiO3 composite nanospheres had diameters equal to those of the Ni/SiO2 nanospheres (about 380 nm).
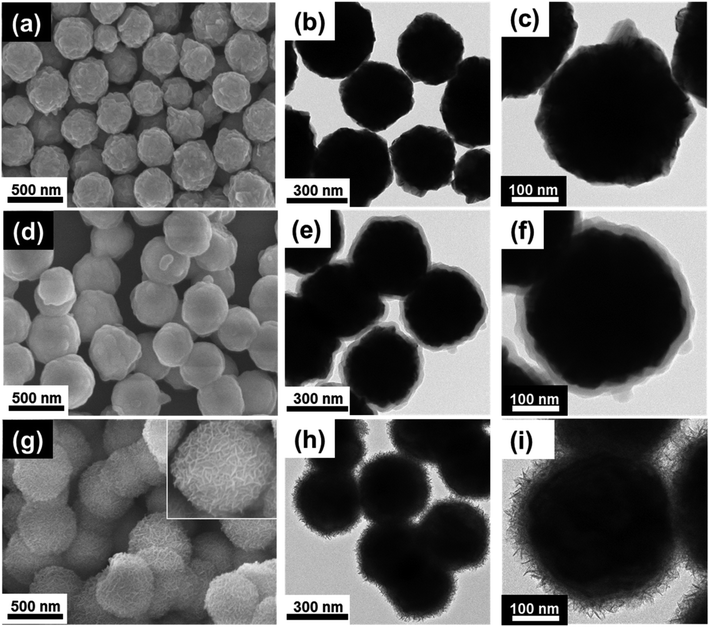 | ||
| Fig. 2 Scanning electron microscopy (SEM) and transmission electron microscopy (TEM) images. (a–c) Ni nanospheres, (d–f) Ni/SiO2 nanospheres, and (g–i) Ni/CuSiO3 composite nanospheres. | ||
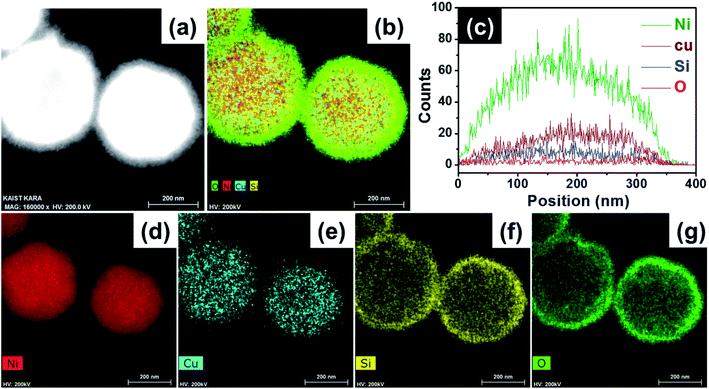
The BF/HAADF-STEM images of the Ni/CuSiO3 composite nanospheres further confirmed the microstructure and elemental distribution. The composite nanospheres had a core–shell structure (Fig. 3(a)); the elemental composition is shown in Fig. 3(b). The line-EDS spectra revealed the presence of all four elements (Fig. 3(c)). Individual elemental maps (Fig. 3(d–h)) revealed that the Ni was in the core (Fig. 3(d)), while Cu, Si, and O were mainly in the shell. Moreover, the composition of the shell was in sharp contrast to that of the CuSiO3 formed by a combination of Cu, Si, and O.
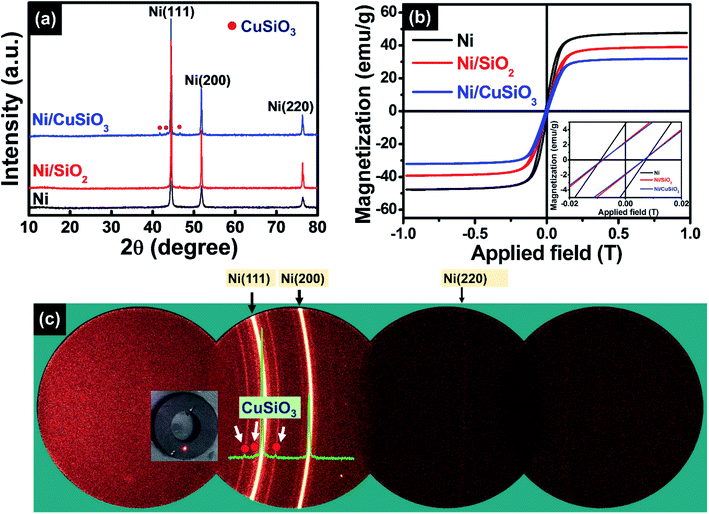
The XRD diffraction peaks of the three products were in good agreement with the face-centered cubic (FCC) phase of Ni (marked by circle symbol in Fig. 4); they were centered at 2θ = 44.7°, 52.0°, and 77.6° (JCPDS#04-0850).15 The final product exhibited additional peaks; the peaks marked by circles indexed to CuSiO3 (PDF#32-0346).22,25 However, Ni/SiO2 core–shell nanospheres shows XRD peaks for only Ni, and absence for SiO2. Whereas, STEM image and elemental mapping of Ni/SiO2 core–shell nanospheres (Fig. S1†) indicated that the silicon, and oxygen atoms are present in shell. It is noted that there is no evidence for crystalline SiO2 in XRD but SiO2 existing in the Ni/SiO2 core–shell nanospheres as in amorphous state. The same behavior was also observed in our previous works.22 Fig. 4(b) shows the two-dimensional XRD pattern of the final composite nanospheres. The intense lines of high contrast correspond to the Ni phase, while the less intense lines correspond to crystalline CuSiO3. Therefore, the XRD results confirmed the presence of both Ni and CuSiO3 in the composite structure. Hysteresis curves demonstrated that all three samples had ferromagnetic characteristics (Fig. 4(c)). The saturated magnetization (Ms) values of Ni, Ni/SiO2, and Ni/CuSiO3 were 48, 37, and 30 emu g−1, respectively. Lower Ms values were measured for Ni/SiO2 and Ni/CuSiO3 because of the non-magnetic shell layers in their core–shell structures.27,28 This feature enhanced EM absorption.
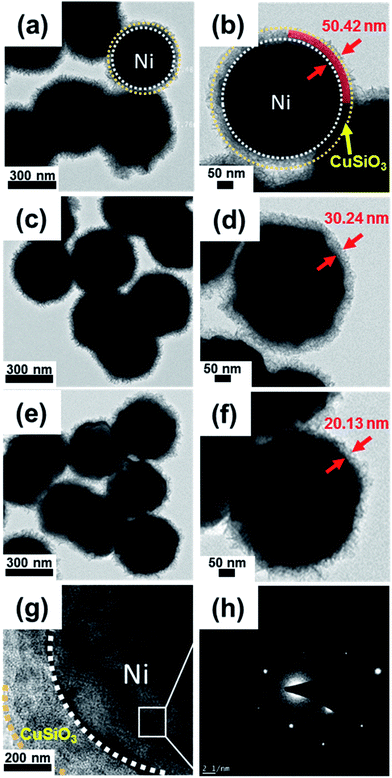
Fig. 5(a–f) displays TEM images of the prepared Ni/CuSiO3 composite nanospheres with shell thicknesses of 50, 30, and 20 nm; these materials are denoted as NCS-1, NCS-2, and NCS-3, respectively. The SiO2 layer thicknesses of the precursor Ni/SiO2 nanospheres are shown in Fig. S2.† The HRTEM images of the composite nanospheres (Fig. 5(g)) revealed that the core and shell were highly crystalline. The selected area electron diffraction image (Fig. 5(h)) taken from the square area in Fig. 5(g) indicated that the Ni was highly crystalline.
Electromagnetic parameters (εr, μr) are crucial to assess EM absorption properties. This is because the real parts (ε′, μ′) and imaginary parts (ε′′, μ′′) of the permittivity and permeability represent the storage and loss ability of EM energy, respectively.21,29 Fig. 6 illustrates how the EM properties were influenced by the shell thickness of the composite nanospheres. Fig. 6(g) shows the permittivity (εr) of Ni nanospheres is lower than its composites. It has been increased and tuned via the shell thickness. As the shell thickness increase the ε′ value increased. On the other hand, the permeability (μr) values are not in big difference for these samples. Hence, controlling of εr is favor to reach the good matching between the electromagnetic parameters. Fig. 6(a, c and e) clearly shows that εr decreased with decreasing shell thickness; the thickness was highest for NCS-1 and lowest for NCS-3. While the real part of the permittivity (ε′) decreased with increasing frequency and suddenly declined at high frequency, ε′′ increased slowly, and then abruptly at about 12–18 GHz. Despite the increasing trend in ε′′, there were strong fluctuations related to strong interfacial polarizations in the composite nanospheres. These polarizations are due to high current lag at the interface, which increases ε′′.15,25 The dipole and enhanced interfacial polarizations account for the dielectric loss.2,15 The dipole polarizations derive from defects in the core and shell materials, whereas interfacial polarizations result from charge accumulation at the interfaces due to the presence of very different materials (Ni and CuSiO3) in the composite nanospheres and are verified from cole–cole plot (Fig. S3†).21,30,31 Fig. 6(b, d and f) reveals that the trends in μr and εr were opposite. The μ′ value steadily decreased with increasing frequency, except for a slight fluctuation in the 16–18 GHz region. The μ′′ displayed peaks at low frequency correspond to natural resonance of the Ni nanospheres, and the peaks at high frequency correspond to exchange resonance or eddy current loss.15,32 The coating of the Ni with a dielectric material (CuSiO3) could have been responsible for the eddy current loss.18,33 The dielectric loss (tan![[thin space (1/6-em)]](https://www.rsc.org/images/entities/char_2009.gif) δe = ε′′/ε′) was slightly higher than the magnetic loss (tan
δe = ε′′/ε′) was slightly higher than the magnetic loss (tan![[thin space (1/6-em)]](https://www.rsc.org/images/entities/char_2009.gif) δm = μ′′/μ′) due to enhanced polarization; this indicated that dielectric loss was the dominant loss mechanism in the Ni/CuSiO3 composite nanospheres (Fig. S3†).
δm = μ′′/μ′) due to enhanced polarization; this indicated that dielectric loss was the dominant loss mechanism in the Ni/CuSiO3 composite nanospheres (Fig. S3†).
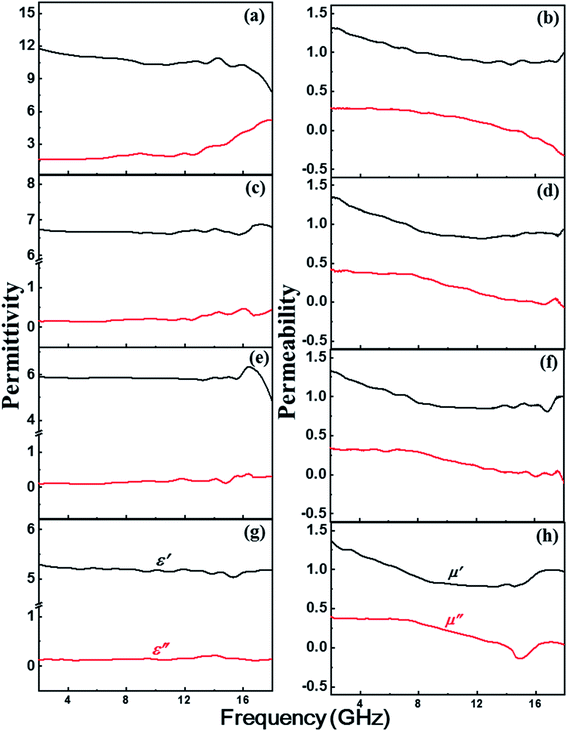 | ||
| Fig. 6 Electromagnetic properties of (a and b) NCS-1, (c and d) NCS-2, (e and f) NCS-3, and (g and h) Ni nanospheres. | ||
The microwave absorption performance of the absorbers can be obtained from analysis of the RL curves.29,31–34 Ni show very poor performance than Ni@SiO2 core–shell nanospheres which has the RL of −18 dB at 8.3 GHz (d = 2.5 mm) (Fig. S4†). This is mainly arise from the dielectric contribution of SiO2 layer in core–shell nanospheres. Since the CuSiO3 shell is more efficient than simple SiO2 layer on Ni and has been introduced to further enhance the microwave absorption properties of Ni composites. The NCS-1, NCS-2, and NCS-3 absorbers exhibited significantly enhanced microwave absorption from lower to higher frequencies (Fig. 7(a–f)). The greatest RLs were −23.5 dB at 11.3 GHz (d = 3 mm), −39.5 dB at 9.6 GHz (d = 2.5 mm), and −22.3 dB at 8.1 GHz (d = 3 mm) for NCS-1, NCS-2, and NCS-3, respectively. These results indicate that the microwave absorption properties can be easily tailored by controlling the shell thickness of the prepared composite nanospheres. The NCS-2 absorber had the highest RL and the widest effective absorbing bandwidth (RL below −10 dB), of about 4.8 GHz (7.8 to 12.6 GHz), at the thickness of 2.5 mm. Table 1 compares the enhanced microwave absorption performance (stronger RL and wider effective bandwidth) of the present composite nanospheres with that of other reported Ni-based composites.9,17,20,34–39 The superior performance of the prepared absorbers suggests that the honeycomb-like core–shell structure contributed significantly to the microwave absorption. Dielectric loss, magnetic loss, shell thickness, and geometry affected performance. The present composite nanospheres displayed higher, and tunable, performance at lower filler weight and with thinner thickness. Such tunable microwave absorption properties are desirable in many applications.
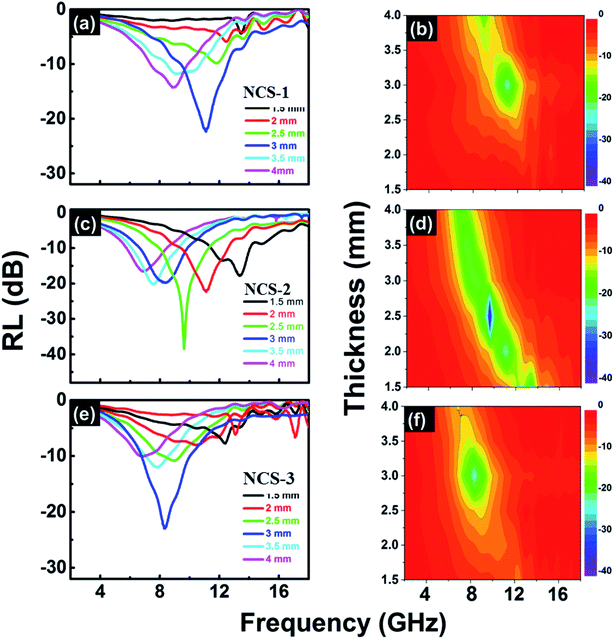 | ||
| Fig. 7 Reflection loss (RL) as a function of frequency for different thicknesses of (a and b) NCS-1, (c and d) NCS-2, and (e and f) NCS-3. | ||
| Sample | Max. RL (dB) | Thickness (mm) | Filler weight (%) | Effective bandwidth (<−10 dB) (GHz) | Ref. |
|---|---|---|---|---|---|
| Ni/SnO2 | −18.6 | 7 | 70 | 1.5 | 33 |
| Ni/polyaniline | −35 | 5 | 50 | 0.3 | 34 |
| PS/PPy/Ni | −20 | 2 | 50 | 4.6 | 35 |
| Ni/carbon | −32 | 2 | 40 | 4.3 | 36 |
| Ni/graphene | −13 | 2 | 20 | 2.6 | 37 |
| Ni/ZnS | −42.4 | 2.2 | 40 | 4.2 | 17 |
| Ni/ZnO | −30.2 | 2.2 | 40 | 2.5 | 20 |
| Ni/SiO2 | −40 | 1.5 | 70 | 3.5 | 9 |
| Ni/TiO2 | −35.4 | 4 | 70 | 1.0 | 9 |
| Ni/CuSiO3 | −39.5 | 2.5 | 30 | 4.8 | This work |
The superior microwave absorption performance of our new absorbers resulted from the good microwave impedance matching by the honeycomb-like core–shell Ni/CuSiO3 composite nanospheres, and strong microwave attenuation. The impedance matching coefficient (η) for the composites is given by eqn (4):40
 | (4) |
The η of the Ni/CuSiO3 composite nanospheres was constant over the entire frequency range, which indicated good impedance matching (Fig. 8(b)). This was due to the balance of EM parameters in the composite nanospheres. The microwave attenuation constant (α) was calculated using eqn (5):31,33
 | (5) |
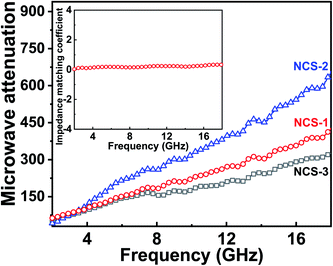 | ||
| Fig. 8 Microwave attenuation constant for NCS-1, NCS-2, and NCS-3; inset shows the impedance matching coefficient for NCS-2. | ||
NCS-2 have reached the higher microwave attenuation constant (α) value than other two composites and NCS-3 attains the lowest value. The higher value of the attenuation constant observed for NCS-2 was due to good impedance matching (Fig. 8(b)); its excellent attenuation indicated good microwave absorption. Therefore, the Ni/CuSiO3 composite nanospheres provided strong RL (−39.5 dB) and wide effective bandwidth (4.8 GHz) with reduced thickness. These advantages offer new opportunities for Ni/CuSiO3 composite nanospheres as tunable, high-performance microwave absorbers.
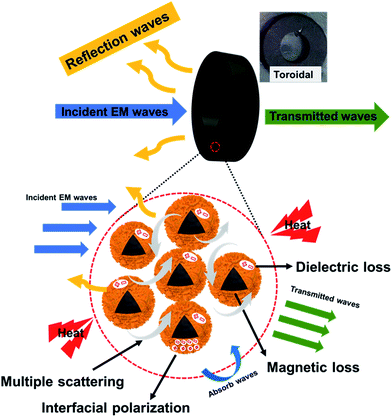
The high performance of the composite nanospheres was clearly associated with the unique honeycomb-like core–shell structure. This type of structure can provide multiple scatterings/reflections from the interspaces between the core and shell, resulting in a longer pathway for the EM wave in the absorber, and a higher rate of heat dissipation.2,15 The many interfaces of the honeycomb structure, and the thin flakes constituting the shell, increase the path length. Additionally, interfacial polarizations associated with the relaxation process are enhanced in the core–shell structures, which have highly curved surfaces at the interfaces.21,41 The Ni/CuSiO3 composite nanospheres having enhanced interfacial polarizations strongly attenuated microwave energy. Moreover, they also exhibited magnetic loss from the ferromagnetic Ni. Fig. 9 shows the probable microwave absorption mechanism for the Ni/CuSiO3 composite nanospheres. These can be considered as high-performance microwave absorption nanomaterials having the advantages of tunable and strong RL, wide absorbing bandwidth, and novel structural characteristics.
4 Conclusions
Novel honeycomb-like core–shell Ni/CuSiO3 composite nanospheres displayed strong microwave absorption performance because of the novel structure of a Ni core and a honeycomb shell composed of small CuSiO3 flakes. The CuSiO3 shell thickness was tuned using different thicknesses of the precursor SiO2 layer (Ni/SiO2) formed by adjusting the Ni concentration in the sol–gel preparative process. However, the composite nanospheres with a 30 nm-thick shell displayed particularly strong microwave absorption properties, i.e., a strong RL of −39.5 dB (9.6 GHz) and a wide effective absorption bandwidth of about 4.8 GHz. Notably, the novel structure effectively dissipated microwave energy because of the combination of high dielectric loss, high magnetic loss, and enhanced interfacial polarizations. The abundant interfaces between the Ni core and honeycomb-like CuSiO3 shell ensured efficient multiple scattering/reflection. Thus, the novel design of the structure and tunability of the shell thickness are expected to assist development of other high-performance microwave absorbers.Conflicts of interest
The authors declare no conflict of interest.Acknowledgements
This work is supported by the National Research Foundation of Korea (NRF) grant funded by the Korean government (No. 2019R1H1A2079946). This work was supported by a National Research Council of Science and Technology (NST) grant by the Korea government (MSIT) (No. CRC-15-06-KIGAM).References
- S. Wei, X. Wang, B. Zhang, M. Yu, Y. Zheng, Y. Wang and J. Liu, Chem. Eng. J., 2017, 314, 477–487 CrossRef CAS.
- R. Kuchi, M. Sharma, S. W. Lee, D. Kim, N. Jung and J. Jeong, Prog. Nat. Sci.: Mater. Int., 2019, 29, 88–93 CrossRef CAS.
- Z. Chen, C. Xu, C. Ma, W. Ren and H.-M. Cheng, Adv. Mater., 2013, 25, 1296–1300 CrossRef CAS PubMed.
- N. Chen, J. Jiang, C. Xu, Y. Yuan and L. Zhen, RSC Adv., 2016, 6, 107653–107658 RSC.
- Q. Liu, Q. Cao, H. Bi, C. Liang, K. Yuan, W. She, Y. Yang and R. Che, Adv. Mater., 2016, 28, 486–490 CrossRef CAS PubMed.
- B. Zhao, B. Fan, G. Shao, B. Wang, X. Pian, W. Li and R. Zhang, Appl. Surf. Sci., 2014, 307, 293–300 CrossRef CAS.
- T. Liu, P. H. Zhou, J. L. Xie and L. J. Deng, J. Appl. Phys., 2012, 111, 093905 CrossRef.
- C. Wang, X. Han, P. Xu, J. Wang, Y. Du and X. Wang, J. Phys. Chem. C, 2010, 114, 3196–3203 CrossRef CAS.
- B. Zhao, G. Shao, B. Fan, W. Zhao and R. Zhang, Phys. Chem. Chem. Phys., 2015, 17, 2531–2539 RSC.
- X. F. Zhang, P. F. Guan and X. L. Dong, Appl. Phys. Lett., 2010, 97, 033107 CrossRef.
- R. Han, X. Han, L. Qiao, T. Wang and F. Li, Mater. Chem. Phys., 2011, 128, 317–322 CrossRef CAS.
- R. Han, X. Han, L. Qiao, T. Wang and F. Li, Phys. B, 2011, 406, 1932–1935 CrossRef CAS.
- P. Xu, X. Han, C. Wang, D. Zhou, Z. Lv, A. Wen, X. Wang and B. Zhang, J. Phys. Chem. B, 2008, 112, 10443–10448 CrossRef CAS PubMed.
- N. Wu, X. Liu, C. Zhao, C. Cui and A. Xia, J. Alloys Compd., 2016, 656, 628–634 CrossRef CAS.
- B. Zhao, X. Guo, W. Zhao, J. Deng, G. Shao, B. Fan, Z. Bai and R. Zhang, ACS Appl. Mater. Interfaces, 2016, 8, 28917–28925 CrossRef CAS PubMed.
- B. Zhao, G. Shao, B. Fan, W. Guo, Y. Xie and R. Zhang, J. Magn. Magn. Mater., 2015, 382, 78–83 CrossRef CAS.
- B. Zhao, G. Shao, B. Fan, W. Zhao, Y. Chen and R. Zhang, RSC Adv., 2015, 5, 9806–9814 RSC.
- B. Zhao, G. Shao, B. Fan, W. Zhao and R. Zhang, Phys. Chem. Chem. Phys., 2015, 17, 6044–6052 RSC.
- W. Xu, G. Wang and P. Yin, Carbon, 2018, 139, 759–767 CrossRef CAS.
- J. Deng, Q. Wang, Y. Zhou, B. Zhao and R. Zhang, RSC Adv., 2017, 7, 9294–9302 RSC.
- J. Xu, J. Liu, R. Che, C. Liang, M. Cao, Y. Li and Z. Liu, Nanoscale, 2014, 6, 5782–5790 RSC.
- A. K. Das, R. Kuchi, P. C. Van, Y. Sohn and J. Jeong, RSC Adv., 2018, 8, 31037–31047 RSC.
- M. Zhang, T. Miao, J. Zheng, J. Xu, A. M. Asiri and H. M. Marwani, Microporous Mesoporous Mater., 2019, 286, 207–213 CrossRef CAS.
- Y. Zhang, M. Zhang, J. Yang, L. Ding, J. Zheng and J. Xu, J. Alloys Compd., 2017, 695, 3256–3266 CrossRef CAS.
- J. Liu, J. Cheng, R. Che, J. Xu, M. Liu and Z. Liu, ACS Appl. Mater. Interfaces, 2013, 5, 2503–2509 CrossRef CAS PubMed.
- R. Eluri and B. Paul, Mater. Lett., 2012, 76, 36–39 CrossRef CAS.
- D. Sun, Q. Zou, R. Wang, Y. Wang, W. Jiang and F. Li, Nanoscale, 2014, 6, 6557–6562 RSC.
- J. Livingston, J. Appl. Phys., 1987, 52, 2544–2548 CrossRef.
- R. Kuchi, H. M. Nguyen, V. Dongquoc, P. C. Van, S. Surabhi, S.-G. Yoon, D. Kim and J.-R. Jeong, Phys. Status Solidi A, 2018, 215, 1700989 CrossRef.
- X. Xia, A. D. Mazzeo, Z. Zhong and G. J. Weng, J. Appl. Phys., 2017, 122, 025104 CrossRef.
- N. Li, X. Xie, H. Lu, B. Fan, X. Wang, B. Zhao, R. Zhang and R. Yang, Ceram. Int., 2019, 45, 22880–22888 CrossRef CAS.
- R. Kuchi, V. Dongquoc, S. Surabhi, D. Kim, S.-G. Yoon, S.-Y. Park, J. Choi and J.-R. Jeong, Phys. Status Solidi A, 2018, 215, 1701032 CrossRef.
- B. Wang, J. Zhang, T. Wang, L. Qiao and F. Li, J. Alloys Compd., 2013, 567, 21–25 CrossRef CAS.
- R. Kuchi, V. Dongquoc, D. Kim, S.-G. Yoon, S.-Y. Park and J.-R. Jeong, Met. Mater. Int., 2017, 23, 405–411 CrossRef CAS.
- B. Zhao, G. Shao, B. Fan, W. Li, X. Pian and R. Zhang, Mater. Lett., 2014, 121, 118–121 CrossRef CAS.
- X. L. Dong, X. F. Zhang, H. Huang and F. Zuo, Appl. Phys. Lett., 2008, 92, 013127 CrossRef.
- W. Li, T. Qiu, L. Wang, S. Ren, J. Zhang, L. He and X. Li, ACS Appl. Mater. Interfaces, 2013, 5, 883–891 CrossRef CAS PubMed.
- X. F. Zhang, X. L. Dong, H. Huang, Y. Y. Liu, W. N. Wang, X. G. Zhu, B. Lv, J. P. Lei and C. G. Lee, Appl. Phys. Lett., 2006, 89, 053115 CrossRef.
- Y. Cao, Q. Su, R. Che, G. Du and B. Xu, Synth. Met., 2012, 162, 968–973 CrossRef CAS.
- Z. Zhonglun, J. Zhijiang, D. Yuping, G. Shuchao and G. Jingbo, J. Mater. Sci.: Mater. Electron., 2013, 24, 968–973 CrossRef.
- K. Singh, A. Ohlan, A. K. Bakhshi and S. K. Dhawan, Mater. Chem. Phys., 2010, 119, 201–207 CrossRef CAS.
Footnotes |
| † Electronic supplementary information (ESI) available. See DOI: 10.1039/c9ra08513k |
| ‡ These authors contributed equally to this work. |
| This journal is © The Royal Society of Chemistry 2020 |

