 Open Access Article
Synthesis of controlled-size silver nanoparticles for the administration of methotrexate drug and its activity in colon and lung cancer cells†
M. Rozalen *a,
M. Sánchez-Poloa,
M. Fernández-Peralesa,
T. J. Widmannb and
J. Rivera-Utrillaa
aDepartment of Inorganic Chemistry, Faculty of Science, University of Granada, 18071 Granada, Spain. E-mail: marisarozalen@ugr.es
bDepartment of Genomic Medicine, GENYO, Centre for Genomics & Oncology (Pfizer - University of Granada & Andalusian Regional Government), PTS Granada, Avda. de La Ilustración 114, Granada 18016, Spain
First published on 12th March 2020
Abstract
A controlled synthesis of methotrexate (MTX) silver nanoparticles (AgNPs-MTX) using borohydride and citrate as reduction and reduction/capping agents, respectively, was performed in order to obtain AgNPs-MTX conjugates with a narrow size distribution. Their characterization showed polydispersed spherical shape nanoparticles with a mean size around 13 nm and distribution range between 7–21 nm. The presence of MTX was confirmed by FTIR and EDX analysis. Spectroscopic determinations suggest the chemisorption of MTX through a carboxylic group (–COOH) onto AgNPs via the exchange with a citrate molecule. Drug loading capacities calculated for AgNPs synthesized using different amounts of MTX were 28, 31 and 40%. In vitro drug release tests depicted similar release profiles for all conjugated amounts releasing between 77 to 85% of the initial MTX loaded into the AgNPs. With respect to free MTX, the addition of the nanocarrier delayed its release and also changed its pharmacokinetics. Free MTX is released after 3 hours following a first order kinetic model, whereas in the presence of AgNPs, a fast initial release is observed during the first 5 hours, followed by a plateau after 24 hours. In this case, AgNPs-MTX fitted a Higuchi model, where its solubilization is controlled by a diffusion process. Results obtained from flow cytometry of different cell lines treated with AgNPs-MTX demonstrated the combined anticancer effect of both reagents, decreasing the percentage of living cells in a colon cancer cell line (HTC-116) down to 40% after 48 hours of exposure. This effect was weaker but still significant for a lung cancer cell line (A-549). Finally, a zebrafish assay with AgNPs-MTX did not show any significant cytotoxic effect, confirming thereby the reduction of systemic drug toxicity achieved by coupling MTX to AgNPs. This observed toxicity reduction in the zebrafish model implies also a probable improvement of the usage of AgNPs-MTX in chemotherapy against human cancers.
1. Introduction
The emergence of nanotechnology has had a deep impact on clinical therapeutics in the last two decades. Compared with conventional chemotherapeutic agents, nanoscale drug carriers have been demonstrated to possess the capacity to improve treatment efficacy while avoiding toxicity in healthy cells due to features such as high accumulation in tumors via the enhanced permeability and retention (EPR) effect and active cellular uptake.1–3Among numerous drug delivery systems, silver nanoparticles (AgNPs) have been used as a novel platform for various therapeutic purposes. AgNPs exhibit small size and large surface area as well as antimicrobial activity, which is beneficial for maintaining formulation sterility for extended periods of time.3 In addition, they also present anticancer effects in different human cancer cell lines, including lung fibroblast (IMR-90) and glioblastoma cells (U295),4 endothelial5 and MDA-MB-231 breast cancer cells.6
Methotrexate (MTX), a chemotherapeutic folic acid analog, is an anionic anticancer drug well known for its effectiveness in the treatment of certain cancers such as breast, head and neck cancer, leukemia, lymphoma, lung cancer and osteosarcoma.7,8 However, the very short plasma half-life and high efflux rate of MTX compared to the influx rate requires a high administration dose, as well as overcoming drug resistance,9 causing many restrictions on its clinical application.
MTX therapy optimization had been proposed using polyethylene glycol-coated silver nanoparticles10 and AgNPs embedded in graphene oxide (GO)11 as promising delivery systems that can improve anticancer efficacy and decrease MTX side effects. Cytotoxicity was also tested against breast cancer MCF-7 and hepatoblastoma HepG2 cells11 pointing out that the conjugation GO-MTX avoids ROS (Reactive Oxygen Species) generated by AgNPs alone, causing cellular apoptosis as evidenced by an apoptosis assay (Annexin V/Flow cytometer). (Muhammad et al., 2016)10 included PEG (Poly Ethylene Glycol) in the formulation, because it is capable of reducing the opsonization process in which nanoparticles are directed to the liver by the help of macrophages. They tested the cytotoxicity in the MCF-7 breast cancer cell line revealing its anticancer activity.
Despite the fact that numerous studies have been investigating the effect of the colloidal surface properties under various environmental conditions on the stability or the aggregation potential of various nanoparticles, there is little information available with regard to AgNPs. Toxicological studies by ref. 12 in aquatic plant duckweed (Spirodela polyrhiza) found out that particle size and surface charge of AgNPs have a significant impact on the response against microorganisms. Moreover, the development of physiologically realistic synthetic microvascular networks (SMNs) have been employed to investigate the effect of size or surface chemistry alone allowing rapid screening of cancer drug delivery systems.13,14 Recently the results obtained by Khor et al.15 demonstrate that carboxylic acid groups decorated nanoparticles bind relatively weakly to HUVEcs (human umbilical vein endothelial cells) and as such, larger-sized particles (70–130 nm) are strongly affected by the drag force leading to removal from cell surface.
For this reason, in this study we have decided to use the co-reduction method employing two different reductants (NaBH4 and trisodium citrate (TSC)), which offers a better control of nucleation and growth of nanoparticles.16,17 The dual thermal treatment (between 60–90 °C) enhances fast nucleation followed by a controlled growth at approximately the same rate, resulting in relatively monodispersed nanoparticles.18 Also a variation of the pH of the reaction medium helps tuning the morphology of particles from quasi-spherical to nearly spherical shape.19 Moreover, previous studies have demonstrated their antimicrobial nature to be size20 and shape dependent,21 with smaller nanoparticles displaying a better antimicrobial activity.18 Even though triangular nanoparticles appeared to be more effective for microbial killing, spherical ones are considered to be the best-suited for practical applications.22–24
With this background, the main objective of the present study was to synthesize and characterize discrete and controlled size methotrexate silver nanoparticles (AgNPs-MTX), using as reduction agent the combination of borohydride and citrate, in order to be used as nanocarriers of MTX. After material characterization, their anticancer activity was tested studying in vitro cytotoxicity on lung and colon cancer cell lines. In order to test their biocompatibility, a zebrafish assay was used as in vivo model. Moreover, we have added new datasets on controlled MTX release and fitted them with a kinetic model with the aim to understand how to maintain MTX concentration in blood or in target tissues.
2. Materials and methods
2.1. Materials
The reagents: silver nitrate (AgNO3), trisodium citrate dehydrate (TSC), sodium borohydride (NaBH4), and methotrexate (MTX) were of analytical grade and used without further purification.2.2. Synthesis of silver nanoparticles (AgNPs) and methotrexate silver nanoparticles (AgNPs-MTX)
Silver nanoparticles have been synthesized following a chemical reduction method, using sodium borohydride as primary reductant and trisodium citrate as secondary reductant as well as stabilizing agent. In order to obtain monodispersed spherical nanoparticles with a narrow size distribution, we have followed the procedure described in ref. 18. The temperature during the reduction process was set up at 60 and 90 °C and final pH was fixed around 10.5. Subsequently, the related/corresponding conjugates using methotrexate were obtained.![[thin space (1/6-em)]](https://www.rsc.org/images/entities/char_2009.gif) 000 rpm during 15 min and kept at −80 °C for 48 hours for further freeze-drying.
000 rpm during 15 min and kept at −80 °C for 48 hours for further freeze-drying.![[thin space (1/6-em)]](https://www.rsc.org/images/entities/char_2009.gif) 000 rpm during 15 min and kept at −80 °C for 48 hours for further freeze-drying.
000 rpm during 15 min and kept at −80 °C for 48 hours for further freeze-drying.In order to determine an optimal ratio for AgNPs and MTX, different concentrations of AgNO3, MTX, TSC, and NaBH4 were tested and are showed in Table 1.
| AgNO3 (mmol) | MTX (mmol) | NaBH4 (mmol) | TCS (mmol) | Ratio | ||||
|---|---|---|---|---|---|---|---|---|
| AgNO3 | MTX | TCS | NaBH4 | pH | ||||
| 0.01 | — | 0.225 | 0.09 | 1 | — | 9 | 22.5 | 10.5 |
| 0.01 | 0.0020 | 0.225 | 0.09 | 1 | 0.2 | 9 | 22.5 | 11.38 |
| 0.01 | 0.0030 | 0.225 | 0.09 | 1 | 0.3 | 9 | 22.5 | 11.36 |
| 0.01 | 0.0040 | 0.225 | 0.09 | 1 | 0.4 | 9 | 22.5 | 11.36 |
2.3. Characterization of AgNPs and AgNPs-MTX
UV-visible spectroscopy was performed with a VWR UV-1600PC UV/Vis spectrophotometer. Samples were analyzed in the 400–900 nm spectral range. The XRD pattern of the samples were recorded by a Bruker D8 Discover Diffractometer (Kα Cu) with a PILATUS3R 100K-A detector and equipped with a Cu Kα (λ = 1.5406 Å) radiation filter. The chemical structure and functional groups of the AgNPs-MTX were analyzed by Fourier Transform Infrared Spectroscopy (FT-IR, JASCO FT/IR 6300 spectrometer) and recorded in absorbance mode in the 4000–400 cm−1 range with a spectral resolution of 4 cm−1 from the average of 100 spectra. Samples were prepared in KBr pressed pellets. Light scattering analysis was conducted using a ZETASIZER (Nano ZS; ZEN3600, Malvern) at 25 °C, with a He–Ne laser operating at a wavelength of 633 nm. The intensity size distributions were obtained from analysis of the correlation functions using the Multiple Narrow Modes algorithm in the instrument software. The samples (AgNPs, AgNPs 200, 300 and 400) were diluted 1![[thin space (1/6-em)]](https://www.rsc.org/images/entities/char_2009.gif) :
:![[thin space (1/6-em)]](https://www.rsc.org/images/entities/char_2009.gif) 20 in distilled water to eliminate the primary charge effect and ultrasound during 10 min to avoid agglomeration. A sample volume of 2 mL was used in 10 mm-diameter disposable cuvettes. At least 3 repeat measurements on each sample were taken to check for result repeatability. The assembly and morphology of AgNPs and AgNPs-MTX were studied by high-resolution transmission electron microscopy (HRTEM) images, obtained using a FEI Titan, operated at 300 kV. SAED patterns were collected using a 10 μm aperture allowing collection of diffraction data from a circular area. Compositional maps of selected areas were acquired in scanning transmission electron microscopy (STEM) mode using a Super X EDX detector (FEI), formed by four windowless SSD detectors. STEM images were collected with a high angle annular dark field (HAADF) detector.
20 in distilled water to eliminate the primary charge effect and ultrasound during 10 min to avoid agglomeration. A sample volume of 2 mL was used in 10 mm-diameter disposable cuvettes. At least 3 repeat measurements on each sample were taken to check for result repeatability. The assembly and morphology of AgNPs and AgNPs-MTX were studied by high-resolution transmission electron microscopy (HRTEM) images, obtained using a FEI Titan, operated at 300 kV. SAED patterns were collected using a 10 μm aperture allowing collection of diffraction data from a circular area. Compositional maps of selected areas were acquired in scanning transmission electron microscopy (STEM) mode using a Super X EDX detector (FEI), formed by four windowless SSD detectors. STEM images were collected with a high angle annular dark field (HAADF) detector.
2.4. Stability test
1 mL of silver colloid solution was mixed with 2 mL of PBS buffer (pH 7.4), DMEM, Milli-Q water containing 10% FBS, DMEM containing 10% FBS, PBS containing 10% FBS. After the incubation at 37 °C for 1, 6, 12 and 24 hours the changes of the maximum absorption wavelength were determined by UV-vis spectroscopy.2.5. In vitro drug release and drug encapsulation efficiency
The release profiles of AgNPs-MTX were studied by dialysis with PBS (10 mmol L−1, pH = 7.4) as release media. 10 mg of nanoparticles were placed into a dialysis membrane bag (MWCO = 8000–14![[thin space (1/6-em)]](https://www.rsc.org/images/entities/char_2009.gif) 000) with 2 mL of PBS and closed with clips. The bags were immersed in 78 mL of PBS. The system was shaken at a speed of 150 rpm at 37 °C. At desired time intervals, 3 mL of sample was withdrawn, MTX concentration measured by UV-Vis spectroscopy at λmax = 304 nm, and poured back into the solution. As a control experiment, the release of free MTX from the dialysis bag was also measured.
000) with 2 mL of PBS and closed with clips. The bags were immersed in 78 mL of PBS. The system was shaken at a speed of 150 rpm at 37 °C. At desired time intervals, 3 mL of sample was withdrawn, MTX concentration measured by UV-Vis spectroscopy at λmax = 304 nm, and poured back into the solution. As a control experiment, the release of free MTX from the dialysis bag was also measured.
Once the experiments were finished, we opened the dialysis bags and added 5 mg of proteinase K enzyme, a protease that cleaves MTX amine bonds, and incubated during 20 min at 37 °C. The nanoparticles were then separated from the free MTX by centrifugation (15![[thin space (1/6-em)]](https://www.rsc.org/images/entities/char_2009.gif) 000 rpm) and the absorbance of the supernatant was measured at 304 nm. A similar drug release quantification strategy was reported in ref. 25.
000 rpm) and the absorbance of the supernatant was measured at 304 nm. A similar drug release quantification strategy was reported in ref. 25.
2.6. Cell viability assays
In vitro cell viabilities of colorectal cancer (HTC-116) (ECACC no. 91091005 (lot no. 05K025) and human lung carcinoma (A-549) (ATCC no. CCL-185 (lot no. 3624224) cell lines, from the CIC cell bank of the University of Granada, were determined through flow cytometry using a simultaneous double-staining procedure with fluorescein diacetate (FDA) and propidium iodide (PI) in the presence of free MTX, AgNPs and AgNPs-MTX.40![[thin space (1/6-em)]](https://www.rsc.org/images/entities/char_2009.gif) 000 cells were separately incubated and distributed in 12-well plates for further 24 h incubation at 37 °C in a humid atmosphere enriched with 5% CO2. The medium was removed, and fresh medium was added together with free MTX (at concentrations of 45.4, 454, 909, 2272 and 4544 μg mL−1), AgNPs and AgNPs-MTX (38, 76, 152, 253, 380 and 760 μg mL−1). After 12, 24, and 48 hours of treatment 100 μL per well of propidium iodide solution (100 μg mL−1) was added and incubated for 10 min at 28 °C in darkness. Afterwards, 100 μL per well of fluorescein diacetate (100 ng mL−1) was added and incubated under the same aforementioned conditions. Finally, the cells were recovered by centrifugation at 1500 rpm for 10 min and the precipitate was washed with PBS. Flow cytometric analyses were performed with a FACS Vantage™ flow cytometer (Becton Dickinson). The percentage of viability was calculated in comparison to the control culture. The IC50 was calculated using linear-regression analysis from the Kc values at the employed concentrations using the software GraphPad Prism 6.
000 cells were separately incubated and distributed in 12-well plates for further 24 h incubation at 37 °C in a humid atmosphere enriched with 5% CO2. The medium was removed, and fresh medium was added together with free MTX (at concentrations of 45.4, 454, 909, 2272 and 4544 μg mL−1), AgNPs and AgNPs-MTX (38, 76, 152, 253, 380 and 760 μg mL−1). After 12, 24, and 48 hours of treatment 100 μL per well of propidium iodide solution (100 μg mL−1) was added and incubated for 10 min at 28 °C in darkness. Afterwards, 100 μL per well of fluorescein diacetate (100 ng mL−1) was added and incubated under the same aforementioned conditions. Finally, the cells were recovered by centrifugation at 1500 rpm for 10 min and the precipitate was washed with PBS. Flow cytometric analyses were performed with a FACS Vantage™ flow cytometer (Becton Dickinson). The percentage of viability was calculated in comparison to the control culture. The IC50 was calculated using linear-regression analysis from the Kc values at the employed concentrations using the software GraphPad Prism 6.
2.7. Confocal microscopy
The cellular imaging of AgNPs and AgNPs-MTX was recorded by using an inverted laser scanning confocal microscope (Leica DMI6000) equipped with an Argon optical system. Samples were imaged in reflectance mode at λexc = 561 nm. Cells morphology were analyzed by recording differential interference contrast (DIC) snapshot in a transmission mode.2.8. In vivo study/zebrafish assay
Zebrafish assays were done in collaboration with researchers from GENYO (Pfizer-University of Granada-Junta de Andalucía Centre for Genomics and Oncological Research). Zebrafish embryos were collected from the zebrafish aquarium of CIC-UGR (Scientific Instrumentation Center of the University of Granada) and staged according to standard procedures. For toxicity studies, 10 healthy embryos at shield stage (gastrulation, 6–7 hours post fertilization, hpf) were transferred to each well of a 24-well plate along with 1 mL of zebrafish E3 medium. Different concentrations of free MTX (10, 15, 30, 50 and 100 μg mL−1), AgNPs and AgNPs-MTX 400 (100, 50 and 25 μg mL−1) were added to the wells and embryos were incubated for 72 hours at 28.5 °C. All tests were repeated three times (60 embryos per concentration). Using a stereomicroscope, morphological changes, heart rate measurements, and mortality of the embryos were annotated after 24, 48 and 72 hpf (hours post fertilization). Mortality rate was expressed as the total number of dead embryos after 72 hpf. Heart rate was recorded using a stopwatch by direct observation under the microscope. Moreover, morphological changes such as pericardial edema or morphological defects, such as bent and twisted notochord, reduced number of somites, abnormal yolk extension or delayed growth were recorded at every stage.2.9. Statistical analysis
Statistical analysis was performed by using the Graph Pad Prim v.6 software. The one-way analysis of variance (ANOVA) statistical method was used to evaluate the significance of the experimental data. A value of p < 0.05 was considered statistically significant.3. Results and discussion
3.1. Characterization of AgNPs and AgNPs-MTX
Optical properties of AgNPs and AgNPs-MTX conjugates were measured by UV-Vis adsorption and are showed in Fig. 1. The position of the plasmon resonance peak at 394 nm confirms the formation of spherical AgNPs.26 A bathochromic shift of the plasmon band is observed when MTX is added (404, 403 and 405 nm) due to the environmental changes around the silver nanoparticles when MTX replace citrate molecules.27 Furthermore, two bands were observed at 258 and 305 nm that correspond to the MTX absorption bands, which are conjugated to the AgNPs (Fig. 1a and b). Color changes are also observed: AgNPs presented a bright yellow color that turns darker as added MTX concentration increases (Fig. 1b).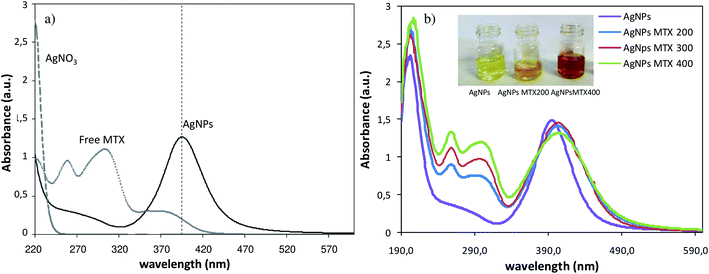 | ||
| Fig. 1 (a) Comparative UV-Vis absorption spectra of free MTX, AgNO3 and AgNPs (b) comparative UV-Vis absorption spectra of AgNPs and AgNPs-MTX with different concentrations of MTX. | ||
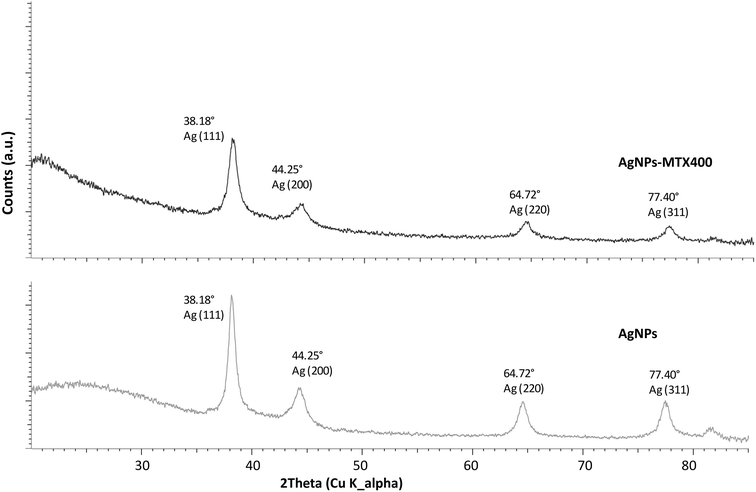
AgNPs and AgNPs-MTX (200, 300, and 400) samples revealed the same typical XRD pattern characterized by 4 diffraction peaks located at 38.48, 44.25, 64.72 and 77.40° (Fig. 2) corresponding to the (111), (200), (220), and (311) crystal planes of Ag (Ag XRD ref no. 01-087-0719), respectively. The XRD pattern suggested the formation of crystalline Ag with a face-centered cubic (fcc) structure.28
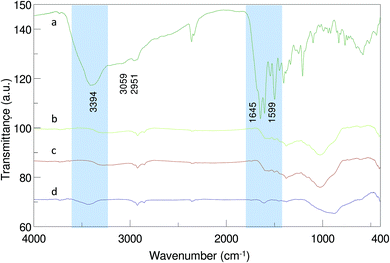
FTIR spectra of free MTX and AgNPs-MTX 200, 300, and 400 are illustrated in Fig. 3. The peak at 3394 cm−1 indicates the presence of a –NH group. Absorptions at 3059 and 2951 cm−1 point out to the existence of carboxylic acid for free MTX (Fig. 3a). Peaks in the region of 1500–1700 cm−1 can be attributed to C–N or NH2 vibrations, while peaks at 1490 and 1209 cm−1 represent the stretching vibration of the C–C or C–H bonds.29 In contrast with free MTX, the FTIR spectrum of AgNPs-MTX conjugates exhibits few characteristics peaks as a consequence of the interaction between AgNPs and MTX. The presence of peaks at 1507 and 1398 cm−1, assigned to the stretching mode of the amide II C–N of MTX and the in-plane bending of O–H in carboxyl groups, indicated the successful loading of MTX into the silver nanoparticles.29
Dynamic light scattering (DLS) measurements were used to determine the particle size of the synthesized AgNPs in aqueous solution. As it is shown in Table 2, AgNPs showed an average size of 11.2 nm, and it increased as MTX was present. As the amount of MTX increases from AgNPs-MTX 200 to AgNPs-MTX 400 Z-potential became more negative, from −23.8 to −31.7 ± 2.0 mV (Table 2). Moreover, the values of polydispersity index (PDI) decreased, pointing out the efficiency of MTX as a capping material, stabilizing the nanoparticles by providing intensive negative charges that keep all the particles away from each other.
| Sample | DLS diameter (nm) | PDI | HRTEM diameter (nm) | Z-Potential (mV) | λabs (nm) |
|---|---|---|---|---|---|
| AgNPs | 14.7 ± 2.7 | 0.155 | 11.13 ± 2.3 | −20.8 | 394 |
| AgNPs-MTX 200 | 17.3 ± 7.9 | 0.360 | 12.5 ± 2.8 | −23.1 | 404 |
| AgNPs-MTX 300 | 18.0 ± 4.7 | 0.228 | 14.6 ± 6.8 | −30.0 | 403 |
| AgNPs-MTX 400 | 21.9 ± 8.7 | 0.155 | 15.2 ± 3.9 | −31.7 | 405 |
The morphology of synthesized AgNPs and AgNPs-MTX was inspected by HRTEM analysis. Images confirmed the formation of spherical and highly dispersed nanoparticles, as showed in Fig. 4. The average size and distribution were calculated based on the diameter measurement of 200 nanoparticles, obtaining an average size close to the values obtained with DLS (Table 2). For instance, Fig. 4a and b showed the histograms obtained for AgNPs and AgNPs-MTX 400. The average size calculated for AgNPs was 11.13 ± 2.27 nm with a distribution range between 6 and 19 nm, and as the amount of MTX increases the average size also increases from 12.5 to 15.2 nm: even tough differences in size are not significant, polydispersity index and Z-potential measurements confirmed the improvement of AgNPs-MTX 400.
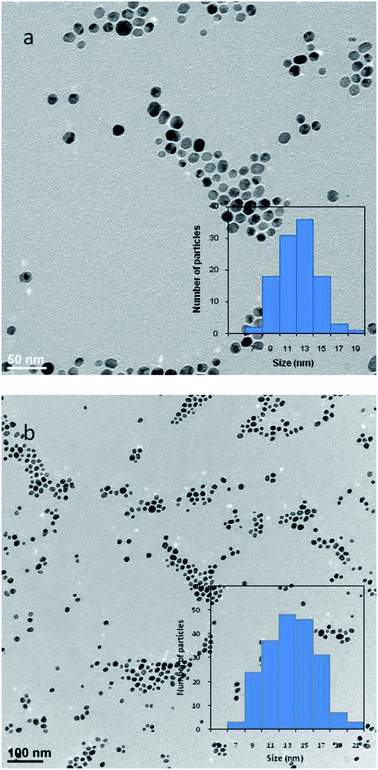 | ||
| Fig. 4 Particle size distribution histogram obtained by HRTEM images measurements for: (a) AgNPs and (b) AgNPs-MTX 400. | ||
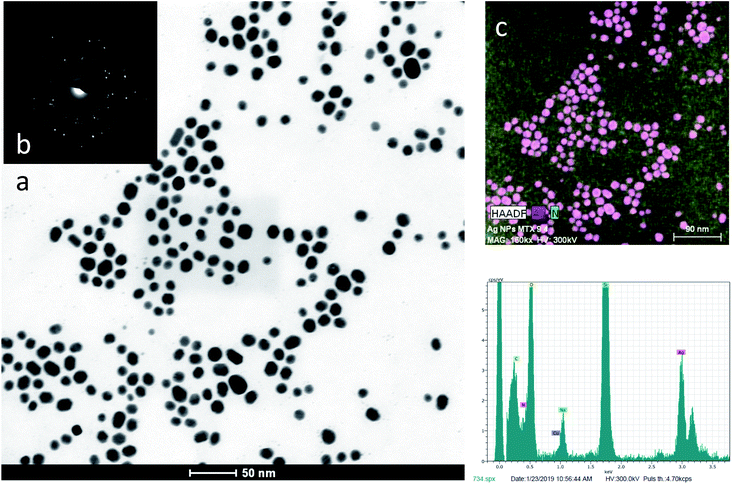
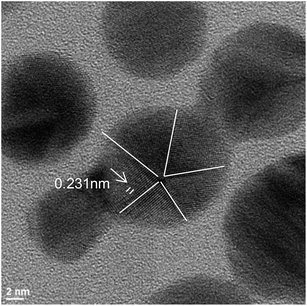
EDX analysis (Fig. 5d) showed the presence of silver and nitrogen, as an indicator of the presence of MTX. The chemical element mapping analysis (Fig. 5c) showed the distribution of elements for a representative group of AgNPs-MTX nanoparticles, pointing out a homogeneous distribution of Ag and N in the sample with predominance of a silver crystalline phase, confirmed by SAED image (Fig. 5b). Nitrogen was not distributed in layers but along the sample (Fig. 5c), which suggested the formation of AgNPs-MTX conjugates. Moreover, the lattice fringe images (Fig. 6) showed that some AgNPs and conjugates with MTX are made up of five domains, which also confirms the polycrystalline nature of the particles. The average inter-planar distance determined from the HRTEM image is 0.231 nm corresponding to the (111) lattice.
In order to provide evidence for the chemisorption of MTX on the surface of AgNPs, we obtained the XP spectra of MTX in a pure solid form as well as of MTX adsorbed on AgNPs. The surface scan spectra showed the presence of Ag, C, O, and N atoms according to their binding energies. For solid MTX, in the C 1s region, four peaks are identified at: (i) 284.3 eV associated with sp2 hybridization of C![[double bond, length as m-dash]](https://www.rsc.org/images/entities/char_e001.gif) C, (ii) 285.4 eV corresponding with sp3 hybridization of C–C and C–N, (iii) 286.6 eV associated with C–O in hydroxyl groups, and (iv) 288.4 eV corresponding with –COOH in carboxylic groups. The most prominent signal in the XPS spectrum is the Ag 3d consisting of two spin–orbit components at 368.8 (Ag 3d5/2) and 374.8 (Ag 3d3/2) eV and separated by 6.0 eV (Fig. 7). Moreover, the deconvolution of Ag (3d) doublet revealed an asymmetric peak shape. These two characteristics indicate that Ag exists in the metallic form. Energy loss features at 371.9 and 378.0 eV are observed at the higher binding energy side of each spin–orbit component for Ag 3d metal. These results are in good agreement with the XRD characterization. XPS high-resolution scan for the C 1s core level (Fig. 7) showed the presence of four different peaks: the main peak centered at 285.56 eV was attributed to C–C (sp3), while the peaks at 286.3, 288.0, and 288.8 eV were attributed to C–O, C
C, (ii) 285.4 eV corresponding with sp3 hybridization of C–C and C–N, (iii) 286.6 eV associated with C–O in hydroxyl groups, and (iv) 288.4 eV corresponding with –COOH in carboxylic groups. The most prominent signal in the XPS spectrum is the Ag 3d consisting of two spin–orbit components at 368.8 (Ag 3d5/2) and 374.8 (Ag 3d3/2) eV and separated by 6.0 eV (Fig. 7). Moreover, the deconvolution of Ag (3d) doublet revealed an asymmetric peak shape. These two characteristics indicate that Ag exists in the metallic form. Energy loss features at 371.9 and 378.0 eV are observed at the higher binding energy side of each spin–orbit component for Ag 3d metal. These results are in good agreement with the XRD characterization. XPS high-resolution scan for the C 1s core level (Fig. 7) showed the presence of four different peaks: the main peak centered at 285.56 eV was attributed to C–C (sp3), while the peaks at 286.3, 288.0, and 288.8 eV were attributed to C–O, C![[double bond, length as m-dash]](https://www.rsc.org/images/entities/char_e001.gif) O, and C–O–Ag, respectively. The doublet for O 1s at 531.7 and 533.3 eV was assigned to oxygen atoms in the ring carbonyl (
O, and C–O–Ag, respectively. The doublet for O 1s at 531.7 and 533.3 eV was assigned to oxygen atoms in the ring carbonyl (![[double bond splayed left]](https://www.rsc.org/images/entities/char_e009.gif) C
C![[double bond, length as m-dash]](https://www.rsc.org/images/entities/char_e001.gif) O) and the carboxyl moieties, respectively. These results are in good agreement with the study of Chen et al.27 for gold nanoparticles suggesting that MTX can be directly bound onto AgNPs through a carboxylic group (–COOH) via the exchange with a citrate molecule. Covalent bonding of therapeutic agents on nanocarriers is usually favored because the bond strength makes the NPs drug conjugates highly stable and therefore is most likely to be disrupted only under harsh environments inside lysosomes.30 MTX-conjugated NPs are believed to be taken up to a higher amount into cells by the human folate receptor than free MTX.27
O) and the carboxyl moieties, respectively. These results are in good agreement with the study of Chen et al.27 for gold nanoparticles suggesting that MTX can be directly bound onto AgNPs through a carboxylic group (–COOH) via the exchange with a citrate molecule. Covalent bonding of therapeutic agents on nanocarriers is usually favored because the bond strength makes the NPs drug conjugates highly stable and therefore is most likely to be disrupted only under harsh environments inside lysosomes.30 MTX-conjugated NPs are believed to be taken up to a higher amount into cells by the human folate receptor than free MTX.27
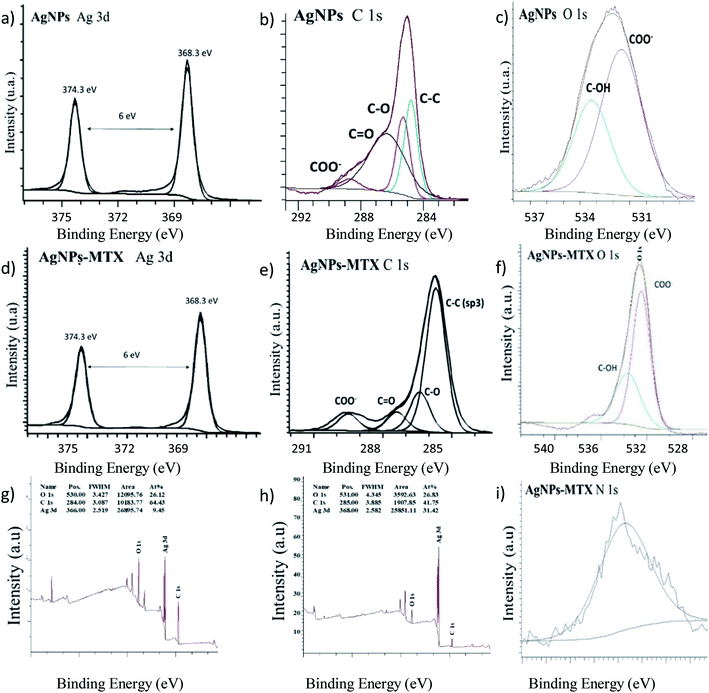 | ||
| Fig. 7 XPS spectra of AgNPs (g) widescan; (a) Ag 3d; (b) C 1s, and (c) O 1s regions. XPS spectra of the AgNPs-MTX 400 (h) widescan; (d) Ag 3d; (e) C 1s; (f) O 1s, and (i) N 1s regions. | ||
3.2. Drug loading capacity and in vitro drug release
Drug loading capacities calculated for synthesized silver nanoparticles are 28.3, 31.48, and 40.4% w/w for AgNPs-MTX 200, AgNPs-MTX 300 and AgNPs-MTX 400, respectively. Typical in vitro release profiles were investigated and illustrated in Fig. 8 for free MTX (control experiment) and AgNPs-MTX. The control experiment showed a complete MTX diffusion across the dialysis membrane within 180 min (Fig. 8a). Nonetheless, as it was expected, when MTX is conjugated with AgNPs the system exhibited a slower release compared with the control (Fig. 8b).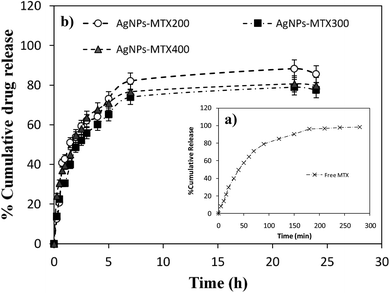 | ||
| Fig. 8 (a) Release profile of free MTX. (b) Release profiles for MTX from silver nanoparticles prepared using different initial MTX/Ag ratios and named as AgNPs-MTX 200, 300, and 400. | ||
Fig. 8b depicts similar release profiles for the synthesized AgNPs-MTX conjugates, releasing between 77 to 85% of the initially MTX loaded on the silver nanoparticles, after 24 hours. A rapid and short release of MTX is observed during the first 5 hours, followed by a stable plateau profile. Such sustained two-step release behavior could maintain the drug level within a therapeutic window.31 Regarding the initial MTX concentration added, there are no significant differences between drug release profiles.
3.3. Kinetic modeling
The mechanism of MTX release was studied applying different kinetic models, in order to fit the experimental cumulative drug release data (Table 3). The release of free MTX fitted a first-order model represented by the following equation:
 | (1) |
| Model | First order | Higuchi | Korsmeyer–Peppas | ||||
|---|---|---|---|---|---|---|---|
| Parameters | r2 | KH (h−1) | r2 | KH (h−0.5) | r2 | KH (h−n) | Value “n” |
| Free MTX | 0.988 | 0.909 | 0.976 | 69.18 | 0.980 | 0.145 | 0.954 |
| AgNPs-MTX 200 | 0.908 | 0.315 | 0.932 | 35.62 | 0.950 | 0.159 | 0.751 |
| AgNPs-MTX 300 | 0.964 | 0.260 | 0.982 | 31.32 | 0.960 | 0.167 | 0.719 |
| AgNPs-MTX 400 | 0.945 | 0.295 | 0.966 | 37.15 | 0.907 | 0.267 | 0.707 |
The presence of AgNPs as nanocarriers modified MTX pharmacokinetics, as expected, fitting better to a Higuchi model (eqn (2)), expressed by the following simplified equation:
| Q = KHt1/2 | (2) |
The values of the Higuchi rate constant obtained were KH = 35.62 h−0.5 (r2 = 0.932), 31.32 h−0.5 (r2 = 0.982) and 37.15 h−0.5 (r2 = 0.966) for AgNPs-MTX 200, 300, and 400, respectively. This model describes drug release as a diffusion process based on Fick's law, which depends on the square root of time (Table 3). According to the results obtained, we selected the sample AgNPs-MTX 400 to carry out the in vitro anticancer activity tests.
3.4. Stability test
We investigated the short term stability (around 24 hours) in different media and long term storage stability (one month) of prepared silver nanoparticles conjugated with different amounts of methotrexate, in the darkness and refrigerated at 4 °C. According with the position of the maximum absorption wavelength of solutions showed in Fig. S1 (ESI†) none of the samples showed significant difference after one month.Particles not stable when diluted by only phosphate buffered solution (PBS), while in the presence of fetal bovine serum (FBS) they were stable at least for 24 hours without the addition of DMEM. This means AgNPs and AgNPs-MTX synthetized are sensitive to high salts contents, but FBS can stabilize nanoparticles and keep their dispersity. Moreover, after one month of storage at 4 °C, AgNPs-MTX 400 maintain better long-term stability than AgNPs-MTX 300 and 200. The maximum absorption wavelength remain unaltered, while black precipitation appeared in AgNPs after 3 weeks of preservation.
3.5. In vitro anticancer activity
The cytotoxic activity of free MTX, AgNPs, and AgNPs-MTX was tested against colorectal cancer (HTC-116) and human lung carcinoma (A-549) cell lines. Dose response curves for free MTX (Fig. 9) showed IC50 values of 2.3, 0.37, and 0.15 mM after 12, 24, and 48 hours for HTC-116 cell line (Fig. 9a). Results obtained for lung cancer (A-549) (Fig. 9b) did not show any effect at the concentrations studied after 12 or 24 hours, however after 48 hours the IC50 calculated is 0.10 mM, reflecting a lower sensitivity and slower response time for this cell line.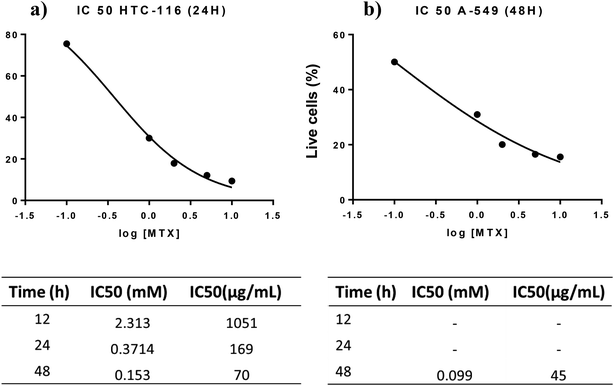 | ||
| Fig. 9 (a) Free MTX dose response curve calculated for HTC-116 cell line. (b) Free MTX dose response curve calculated for A-549 cell line. | ||
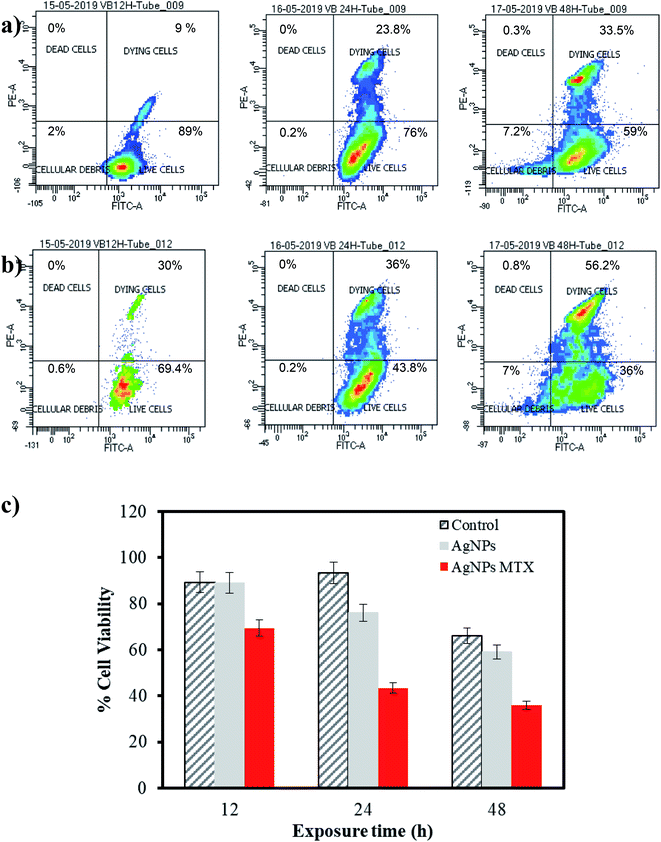
AgNPs showed dose-dependent anti-proliferative effects against HTC-116 cells, in accordance with other studies,6 which is also time-dependent (Fig. 10c). Calculated IC50 decreases from 186 to 63 μg mL−1 after 12 and 48 hours of exposure, respectively. Moreover, a synergistic effect comparing the results for AgNPs and AgNPs-MTX conjugates is clearly observed in Fig. 10a and b, where percentage of living cells drastically dropped. These results are confirmed with calculated IC50 decreasing from 88 to 23 μg mL−1 (Table 4) after 12 and 48 hours of exposure. Compared with the free MTX, the AgNPs-MTX present a clear advantage, showing a faster effect with half dose; IC50 dropped from 45 to 23 μg mL−1 after 48 h of exposure.
| Nanoparticles | IC50 (μg mL−1) | ||
|---|---|---|---|
| 12 h | 24 h | 48 h | |
| AgNPs | 186 | 98 | 63 |
| AgNPs-MTX 400 | 88 | 38 | 23 |
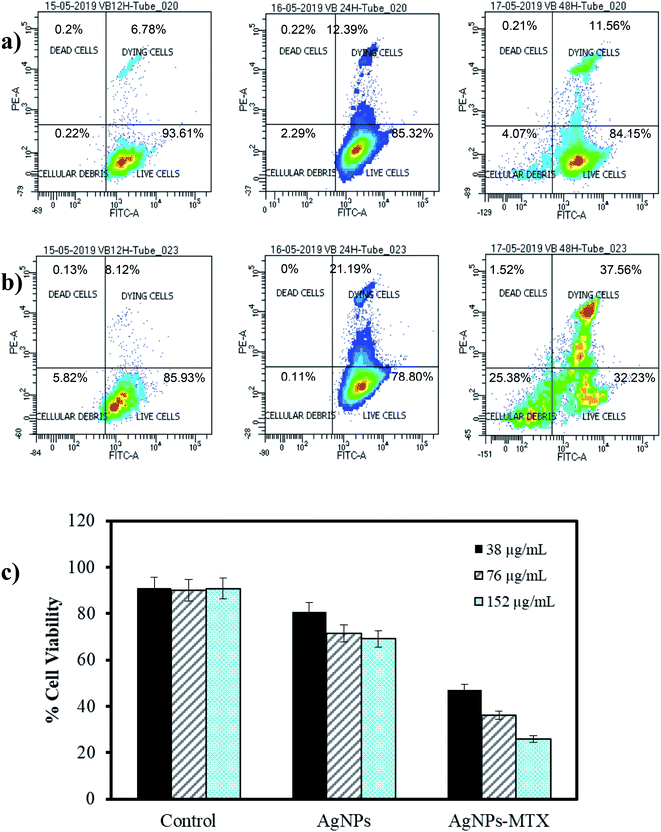
Interestingly, results obtained for A-549 cell line showed a lighter dose–response effect. The synergistic effect is not observed and even for the highest dose tested, AgNPs did not show a significant effect decreasing the percentage live cells from 93 to 84% after 12 and 48 hours of exposure, respectively (Fig. 11a). Nevertheless, AgNPs-MTX showed a significant cytotoxic activity decreasing the percentage of live cells from 69 to 36% after 12 and 48 hours of exposure.
Finally, similar concentrations of AgNPs-MTX, when compared with AgNPs, after 48 hours of exposure showed that the antiproliferative effect is strengthened with increase in the concentration, as stated in Fig. 11c.
Considering that the percentage of MTX on AgNPs varies between 20 and 40% and their IC50 decreases more than an order of magnitude compared with free MTX, it is clear that effective doses of AgNPs-MTX are lower than those corresponding to free MTX doses for lung and colon cancer cell lines, although the effect is more pronounced for the colon cancer cell line (HTC-116).
3.6. Cellular imaging of HTC-116 and A-549 lines with AgNPs and MTX
The cellular uptake of AgNPsMTX conjugates was confirmed using confocal microscopy. Images were taken after incubating cells with AgNPs and AgNPsMTX at selected concentrations, based on the flow cytometry results. Representative results are shown in Fig. 12 and 13 for HTC-116 and A-549 cell lines respectively.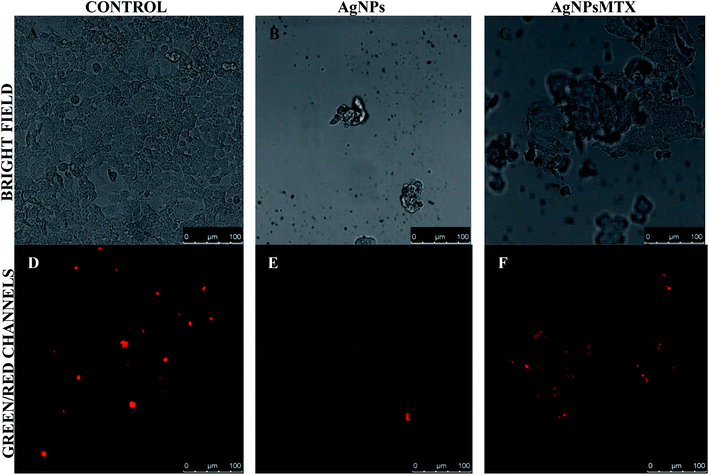 | ||
| Fig. 12 Representative bright field and fluorescence images of HTC-116 cells incubated for 48 h with AgNPs (b and e) and AgNPs-MTX (c and f) compared with a control (a and c). | ||
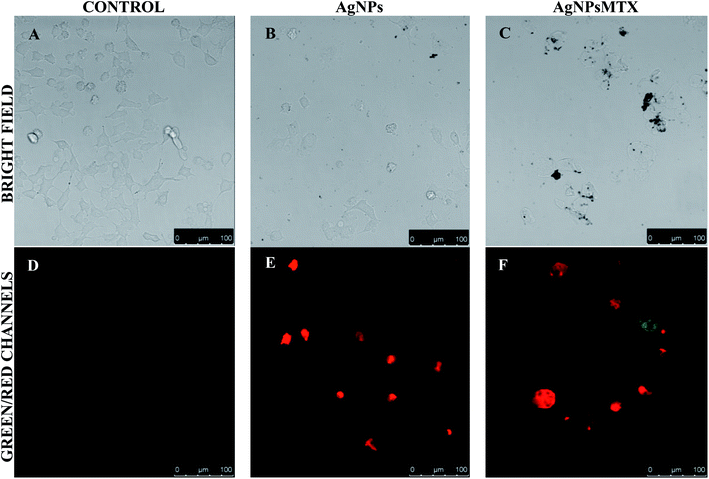 | ||
| Fig. 13 Representative bright field and fluorescence images of A-549 cells incubated for 48 h with AgNPs (b and e) and AgNPs-MTX (c and f) compared with a control (a and c). | ||
As expected, control cells showed high confluency after 48 h incubation for colon cancer line (HTC116) (Fig. 12a). Cells treated with AgNPs showed a significant amount of red fluorescence, increasing when treated with AgNPs-MTX conjugates. These results support the conjugated effect of MTX and AgNPs observed by flow cytometry.
However, for lung cancer cell line (A-549) images showed similar effects for AgNPs and AgNPs-MTX conjugates (Fig. 13). This could be related to the presence of folate receptors in line HTC-116 on the contrary than line A-549, supporting the specific uptake of folate-conjugated AgNPs-MTX by folate receptor positive tumor cells.
3.7. Zebrafish assay
Reported results relating to the toxicity assessment of MTX in zebrafish demonstrated that high doses (0.2–1.5 mM = 91–681 μg mL−1) cause disruption of the folate pathway, leading to developmental defects in early zebrafish stages.32,33 Our results showed a dose dependent toxicity of MTX in embryos after constant exposure (from 6 hpf onwards) to lower MTX concentrations ranging from 10 to 30 μg mL−1, increasing embryonic mortality rate from 13 to 20% at 24 hpf. Moreover, phenotypic changes as yolk defects and less somites were observed ((Fig. 14I–L), compared with wild type embryos in (Fig. 14A–D)) . Up to 30% of the embryos presented pericardial edema. After 48 hpf, the hatching rate decreased from 70 to 56%, as MTX concentration increased from 10 to 30 μg mL−1. Around 10% of the embryos presented yolk defects, less somites and degeneration of body parts, as bent or shortened tails. No significant heart edema was noticed any more after 48 hpf, but a few embryos presented a lower heart beat rate (between 3 and 6%).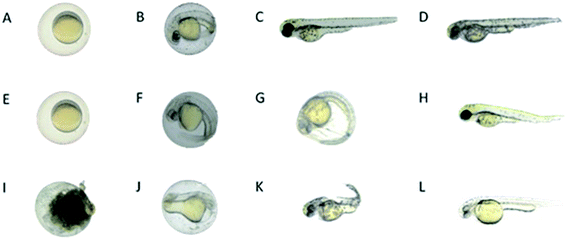 | ||
| Fig. 14 Microscopic images of control zebrafish embryos, zebrafish embryos treated with AgNPs-MTX, and zebrafish embryos treated with free MTX at different developmental stages (6 hpf, 24 hpf, 48 hpf, and 72 hpf, stages according to ref. 34). (A–D) Wild type control embryos showed normal embryonic development: (A) embryo enclosed in chorion at 6 hpf, (B) embryo enclosed in chorion at 24 hpf, (C and D) hatched larvae at 48 and 72 hpf. (E–H) Some embryos treated with AgNPs-MTX (AgNps alone images not shown) presented very mild toxicity phenotypes: (E and F) embryos with light heart edema at 24 hpf, (G) delay in hatching at 48 hpf, and (H) delayed growth and bent tail. (I–L) A higher percentage of embryos treated with free MTX showed more severe effects as: (I) chorion with cloudy appearance resembling dead embryos at 24 hpf, (J) delayed growth and morphological defects after 24 hpf, (K) larvae with twisted tail at 48 hpf, and (L) delayed growth and bent tail/notochord at 72 hpf. | ||
Between 66 and 80% of the embryos hatched after 72 h and no significant phenotypic changes were observed, besides a growth delay in around 10%. Consequently, later stages of embryos were found to be more resistant to MTX treatment. Although MTX concentrations tested in this study did not show a pronounced toxicity, Sun et al. showed that zebrafish embryos exposed to a 1.5 mM (681 μg mL−1) MTX during 6–10 hpf failed to form a normal cardiovascular system. MTX induced such malformations by inhibiting the dihydrofolate reductase (DHFR), an enzyme that is critical for nucleotide synthesis and methylation, both of which play essential roles in embryonic development.33
AgNPs-treated embryos did not show dose-dependent toxicity under laboratory conditions, with an overall mortality lower than 4% after 24, 48, and 72 hpf. However, a few embryos exhibited some phenotypic changes characterized by bent and twisted tails, pericardial edema and delayed growth at the first stage observed (24 hpf). Also, a mild transient pericardial edema is noted in up to a 66% of the embryos for 100 μg mL−1 AgNPs, but disappeared after 48 and 72 hpf, where the hatching rate reached almost 100% of the embryos (images not shown, as phenotypeare similar to those of AgNPs-MTX treated embryos).
Finally, the AgNPs-MTX conjugates studied (200, 300, and 400) (Fig. 14E–H) showed a dose-dependent mortality rate reaching a 16% after 24 hours for higher concentrations (100 μg mL−1). As it was noted in early stages (24 hpf) for AgNPs alone, light pericardial edema reached up to 80% of the embryos for 100 μg mL−1 AgNPs-MTX 400, but it disappeared at 48 hours, allowing a hatching rate between 90 and 100% after 72 hours. As observed in Fig. 15, the mortality rate (in %) in free MTX (10 and 30 μg mL−1) treated zebrafish embryos is notably higher than the mortality rate in AgNPs or AgNPs-MTX conjugate treated embryos, pointing out the reduced toxicity of MTX attached to nanocarriers.
As shown in Fig. 15, heart rate of embryos at 72 hpf was unaffected by AgNPs and AgNPs-MTX treatments. On the other hand, the comparative mortality percentage for different concentrations of MTX and 100 μg mL−1 of AgNPs and AgNPs-MTX 400 showed no toxicity for AgNPs and AgNPs-MTX equivalent doses tested on cancer cells.
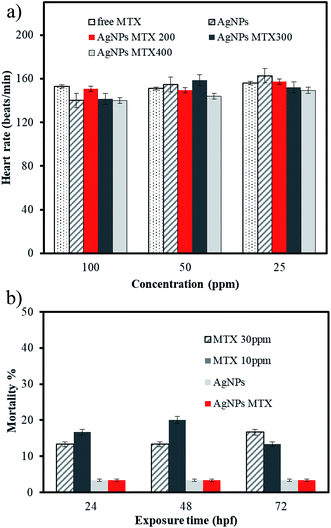 | ||
| Fig. 15 (A) Average heart beat rate of embryos at 72 hpf. (B) Comparative mortality (in percent) for different concentrations of MTX and 100 μg mL−1 of AgNPs and AgNPs-MTX 400. | ||
On the contrary, a remarkable toxic effect of free MTX, 30 μg mL−1, is observed for the development of zebrafish (as reported in the literature33). AgNPs alone showed a mild effect inducing delayed growth and weak morphological defects. However, when methotrexate is conjugated to AgNPs, there is no general cytotoxic effect in zebrafish, AgNPs-MTX rather show similar side effects as AgNPs alone. AgNPs-MTX, however, are effective against colon and lung cancer cells, as shown in the cytotoxicity assay. Taken together, these results point towards a strong reduction of systemic drug toxicity of MTX when conjugated to silver nanoparticles and therefore an expected improvement in the outcomes of AgNP-MTX when used in chemotherapy.
4. Conclusions
Polydisperse AgNPs-MTX of controlled size have been successfully synthesized by controlling temperature and pH, and using as reducing agents borohydride and citrate.Polydispersed spherical shape silver nanoparticles with a mean size around 13 nm and a distribution range between 7 and 21 nm were obtained. HRTEM mapping showed a homogeneous distribution of Ag and N (as an indicator of the presence of MTX) with prevalence of a silver nanocrystalline phase (determined by SAED images), which suggested the formation of an Ag-MTX conjugate. Spectroscopic determinations indicated the chemisorption of MTX through a carboxylic group (–COOH) onto AgNPs via exchange with a citrate molecule.
Drug loading capacities calculated for synthesized AgNPs using different amounts of MTX were 28, 31, and 40%. In vitro drug release tests depicted similar release profiles for all drug-conjugated AgNPs releasing between 77 and 85% of the initial MTX loaded onto AgNPs. The implementation of a kinetic model pointed out that the free MTX dataset fitted a first order model, whereas the AgNPs-MTX dataset fitted a simplified Higuchi model, in which MTX release is controlled by diffusion, with drug release being slowed down when compared to free MTX.
Anticancer activity testing in colon and lung cancer cells suggested the effectiveness of drug-conjugated AgNPs: conjugation is enhancing the therapeutic effect of MTX and it is at the same time decreasing the effective doses of MTX required for achieving this effect.
Finally, an in vivo zebrafish assay did not show a remarkable toxicity or malformation induction by AgNPs-MTX, providing a rationale for further progress on the therapeutic use of AgNPs-MTX nanoparticles. MTX is used in chemotherapy in human cancers, such as acute lymphocytic leukemia, osteosarcoma, non-Hodgkin lymphoma, head and neck cancer and breast cancer.35 However, its therapeutic window is very narrow and its toxicity is high. AgNPs-MTX with their higher efficiency against cancerous cells could help to decrease the required drug intake, direct the therapy more specifically to cancerous cells and reduce overall MTX toxicity to healthy body cells.
Ethical statement
All animal procedures were performed in accordance with the Guidelines for Care and Use of Laboratory Animals of Granada University and experiments were approved by the Animal Ethics Committee. The approval was registered by the Department of Agriculture and Fishing of the local Andalusian Government.Conflicts of interest
There are no conflicts to declare.Acknowledgements
The authors are grateful for the financial support of the Ministry of Science and Innovation (CTQ2016-80978-C2-1-R). We also thank Dr Nieves Rodríguez Cabezas and Dr Jaime Lazuen Alcón (from the CIC-UGR) for helpful advice during cytotoxicity assays design. The authors are further grateful for being able to do the in vivo tests on zebrafish embryos (0–5 dpf) provided by the animal house of the CIC-UGR. The animal house has all necessary permissions for zebrafish maintenance. Finally, we thank Dr Jorge Fernández-Sánchez, from Inorganic Chemistry Department at UGR, for technical and scientific advice during DLS and Z-meter measurements.References
- H. Koo, M. S. Huh, I.-C. Sun, S. H. Yuk, K. Choi and K. Kim, et al., In vivo targeted delivery of nanoparticles for theranosis, Acc. Chem. Res., 2011, 44(10), 1018–1028 CrossRef CAS PubMed.
- H. Maeda, J. Wu, T. Sawa, Y. Matsumura and K. Hori, Tumor vascular permeability and the EPR effect in macromolecular therapeutics: a review, J. Controlled Release, 2000, 65(1), 271–284 CrossRef CAS PubMed.
- M. Rai, A. Yadav and A. Gade, Silver nanoparticles as a new generation of antimicrobials, Biotechnol. Adv., 2009, 27(1), 76–83 CrossRef CAS PubMed.
- P. V. AshaRani, G. Low Kah Mun, M. P. Hande and S. Valiyaveettil, Cytotoxicity and Genotoxicity of Silver Nanoparticles in Human Cells, ACS Nano, 2009, 3(2), 279–290 CrossRef CAS PubMed.
- K. Kalishwaralal, S. BarathManiKanth, S. R. K. Pandian, V. Deepak and S. Gurunathan, Silver nano—a trove for retinal therapies, J. Controlled Release, 2010, 145(2), 76–90 CrossRef CAS PubMed.
- S. Gurunathan, K.-J. Lee, K. Kalishwaralal, S. Sheikpranbabu, R. Vaidyanathan and S. H. Eom, Antiangiogenic properties of silver nanoparticles, Biomaterials, 2009, 30(31), 6341–6350 CrossRef CAS PubMed.
- A. Kim, J.-E. Lee, W.-S. Jang, S.-J. Lee, S. Park and H. J. Kang, et al., A combination of methotrexate and irradiation promotes cell death in NK/T-cell lymphoma cells via down-regulation of NF-κB signaling, Leuk. Res., 2012, 36(3), 350–357 CrossRef CAS PubMed.
- Z. Pan, G. Yang, H. He, G. Zhao, T. Yuan and Li Yu, et al., Concurrent radiotherapy and intrathecal methotrexate for treating leptomeningeal metastasis from solid tumors with adverse prognostic factors: a prospective and single-arm study, Int. J. Cancer, 2016, 139(8), 1864–1872 CrossRef CAS PubMed.
- Y. Pan, N. G. Sahoo and L. Li, The application of graphene oxide in drug delivery, Expet Opin. Drug Deliv., 2012, 9(11), 1365–1376 CrossRef CAS PubMed.
- Z. Muhammad, A. Raza, S. Ghafoor, A. Naeem, S. S. Naz and S. Riaz, et al., PEG capped methotrexate silver nanoparticles for efficient anticancer activity and biocompatibility, Eur. J. Pharm. Sci., 2016, 91, 251–255 CrossRef CAS PubMed.
- R. K. Thapa, J. H. Kim, J.-H. Jeong, B. S. Shin, H.-G. Choi and C. S. Yong, et al., Silver nanoparticle-embedded graphene oxide-methotrexate for targeted cancer treatment, Colloids Surf., B, 2017, 153, 95–103 CrossRef CAS PubMed.
- H.-S. Jiang, M. Li, F.-Y. Chang, W. Li and L.-Y. Yin, Physiological analysis of silver nanoparticles and AgNO3 toxicity to Spirodela polyrhiza, Environ. Toxicol. Chem., 2012, 31(8), 1880–1886 CrossRef CAS PubMed.
- B. Prabhakarpandian, M.-C. Shen, J. B. Nichols, C. J. Garson, I. R. Mills and M. M. Matar, et al., Synthetic tumor networks for screening drug delivery systems, J. Contr. Release, 2015, 201, 49–55 CrossRef CAS PubMed.
- Y. Tang, F. Soroush, J. B. Sheffield, B. Wang, B. Prabhakarpandian and M. F. Kiani, A Biomimetic Microfluidic Tumor Microenvironment Platform Mimicking the EPR Effect for Rapid Screening of Drug Delivery Systems, Sci. Rep., 2017, 7(1), 9359 CrossRef PubMed.
- S. Y. Khor, M. N. Vu, E. H. Pilkington, A. P. R. Johnston, M. R. Whittaker and J. F. Quinn, et al., Elucidating the Influences of Size, Surface Chemistry, and Dynamic Flow on Cellular Association of Nanoparticles Made by Polymerization-Induced Self-Assembly, Small, 2018, 14(34), 1801702 CrossRef PubMed.
- X. Dong, X. Ji, H. Wu, L. Zhao, J. Li and W. Yang, Shape Control of Silver Nanoparticles by Stepwise Citrate Reduction, J. Phys. Chem. C, 2009, 113(16), 6573–6576 CrossRef CAS.
- R. Ma, C. Levard, S. M. Marinakos, Y. Cheng, J. Liu and F. M. Michel, et al., Size-Controlled Dissolution of Organic-Coated Silver Nanoparticles, Environ. Sci. Technol., 2012, 46(2), 752–759 CrossRef CAS PubMed.
- S. Agnihotri, S. Mukherji and S. Mukherji, Size-controlled silver nanoparticles synthesized over the range 5–100 nm using the same protocol and their antibacterial efficacy, RSC Adv., 2014, 4(8), 3974–3983 RSC.
- Y. Ma and Y. Qu, A simple approach towards uniform spherical Ag-like nanoparticles, Nanoscale, 2012, 4(10), 3036–3039 RSC.
- J. R. Morones, J. L. Elechiguerra, A. Camacho, K. Holt, J. B. Kouri and J. T. Ramírez, et al., The bactericidal effect of silver nanoparticles, Nanotechnology, 2005, 16(10), 2346–2353 CrossRef CAS PubMed.
- S. Pal, Y. K. Tak and J. M. Song, Does the antibacterial activity of silver nanoparticles depend on the shape of the nanoparticle? A study of the Gram-negative bacterium Escherichia coli, Appl. Environ. Microbiol., 2007, 73(6), 1712–1720 CrossRef CAS PubMed.
- S. Agnihotri, S. Mukherji and S. Mukherji, Immobilized silver nanoparticles enhance contact killing and show highest efficacy: elucidation of the mechanism of bactericidal action of silver, Nanoscale, 2013, 5(16), 7328–7340 RSC.
- S. Agnihotri, S. Mukherji and S. Mukherji, Antimicrobial chitosan–PVA hydrogel as a nanoreactor and immobilizing matrix for silver nanoparticles, Appl. Nanosci., 2012, 2(3), 179–188 CrossRef CAS.
- S. Mukherji, J. Ruparelia and S. Agnihotri Antimicrobial Activity of Silver and Copper Nanoparticles: Variation in Sensitivity Across Various Strains of Bacteria and Fungi, in Nano-Antimicrobials: Progress and Prospects, ed. N. Cioffi and M. Rai, Berlin, Heidelberg, Springer Berlin Heidelberg, 2012, pp. 225–251, DOI:10.1007/978-3-642-24428-5_8.
- K. Nathan, C. Sun, A. Fichtenholtz, J. Gunn, F. Chen and M. Zhang, Methotrexate-Immobilized Poly(ethylene glycol) Magnetic Nanoparticles for MR Imaging and Drug Delivery, Small, 2006, 2(6), 785–792 CrossRef PubMed.
- J. J. Mock, M. Barbic, D. R. Smith, D. A. Schultz and S. Schultz, Shape effects in plasmon resonance of individual colloidal silver nanoparticles, J. Chem. Phys., 2002, 116(15), 6755–6759 CrossRef CAS.
- Y.-H. Chen, C.-Y. Tsai, P.-Y. Huang, M.-Y. Chang, P.-C. Cheng and C.-H. Chou, et al., Methotrexate Conjugated to Gold Nanoparticles Inhibits Tumor Growth in a Syngeneic Lung Tumor Model, Mol. Pharm., 2007, 4(5), 713–722 CrossRef CAS PubMed.
- K. Shameli, M. Bin Ahmad, E. A. Jaffar Al-Mulla, N. A. Ibrahim, P. Shabanzadeh and A. Rustaiyan, et al., Green biosynthesis of silver nanoparticles using Callicarpa maingayi stem bark extraction, Molecules, 2012, 17(7), 8506–8517 CrossRef CAS PubMed.
- S. Ayyappan, N. Sundaraganesan, V. Aroulmoji, E. Murano and S. Sebastian, Molecular structure, vibrational spectra and DFT molecular orbital calculations (TD-DFT and NMR) of the antiproliferative drug methotrexate, Spectrochim. Acta, Part A, 2010, 77(1), 264–275 CrossRef CAS PubMed.
- H. Nosrati, M. Salehiabar, S. Davaran, H. Danafar and H. K. Manjili, Methotrexate-conjugated L-lysine coated iron oxide magnetic nanoparticles for inhibition of MCF-7 breast cancer cells, Drug Dev. Ind. Pharm., 2018, 44(6), 886–894 CrossRef CAS PubMed.
- Z.-L. Liu, D.-Y. Tian, S.-P. Li, X.-D. Li and T.-H. Lu, MTX/LDHs hybrids synthesized from reverse microemulsions: particle control and bioassay study, Int. J. Pharm., 2014, 473(1), 414–425 CrossRef CAS PubMed.
- M. S. Lee, J. R. Bonner, D. J. Bernard, E. L. Sanchez, E. T. Sause and R. Prentice, et al., Disruption of the folate pathway in zebrafish causes developmental defects, BMC Dev. Biol., 2012, 12(1), 12 CrossRef CAS.
- S. Sun, Y. Gui, Y. Wang, L. Qian, X. Liu and Q. Jiang, et al., Effects of methotrexate on the developments of heart and vessel in zebrafish, Acta Biochim. Biophys. Sin., 2009, 41(1), 86–96 CrossRef CAS.
- C. B. Kimmel, W. W. Ballard, S. R. Kimmel, B. Ullmann and T. F. Schilling, Stages of embryonic development of the zebrafish, Dev. Dynam., 1995, 203(3), 253–310 CrossRef CAS.
- J. Jolivet, K. H. Cowan, G. A. Curt, N. J. Clendeninn and B. A. Chabner, The Pharmacology and Clinical Use of Methotrexate, N. Engl. J. Med., 1983, 309(18), 1094–1104 CrossRef CAS PubMed.
Footnote |
| † Electronic supplementary information (ESI) available. See DOI: 10.1039/c9ra08657a |
| This journal is © The Royal Society of Chemistry 2020 |

