 Open Access Article
Enhanced thermal conductivity of nanocomposites with MOF-derived encapsulated magnetic oriented carbon nanotube-grafted graphene polyhedra†
Xu Lia,
Ya Lia,
Md Mofasserul Alamb,
Peng Chena,
Ru Xia a,
Bin Wu
 *a and
Jiasheng Qian*a
aKey Laboratory of Environment-Friendly Polymeric Materials of Anhui Province, College of Chemistry & Chemical Engineering, Anhui University, Hefei, 230601, P. R. China. E-mail: lwbin@ahu.edu.cn; qianjsh@ahu.edu.cn
bCAS Key Laboratory of Soft Matter Chemistry, Collaborative Innovation Centre of Chemistry for Energy Materials, School of Chemistry and Materials Science, University of Science and Technology of China, Hefei, 230026, P. R. China
First published on 21st January 2020
Abstract
It remains a challenge to develop highly polymer-based nanocomposite thermal interface materials, which can effectively remove heat developed during the miniaturization of electronic instruments. It has been reported that a large number of graphene-based nanocomposites exhibit excellent performance. However, it is still an issue to construct thermal conductive pathways by orientation arrangements with a low filler volume fraction. Herein, a high-thermal conductivity filler of magnetic carbon nanotube-grafted graphene polyhedra (Co@Co3O4-G) was exploited via the annealing of metal–organic frameworks (ZIF-67). Co@Co3O4-G can improve the thermal conductivity of nanocomposites obviously by forming oriented pathways for phonon transport in an external magnetic field. Therefore, the resulting nanocomposite displayed a high thermal conductivity of 2.11 W m−1 K−1 for only 8.7 vol%, which is 10 times higher than that of the pure epoxy resin. Core-shell magnetic cobalt oxide (Co@Co3O4) was encapsulated in situ in the nanoarchitecture to avoid falling off. Moreover, the equilibrium molecular dynamics (EMD) simulation verifies that Co@Co3O4-G had high thermal conductivity to effectively improve the heat dissipation of nanocomposites. This strategy provides an approach for developing high-performance thermal management materials and opens up the possibility for the pioneering applications of encapsulated magnetic-oriented thermal conductive fillers.
1. Introduction
Thermal management is crucial to the performance and lifetime of miniaturized, integrated and multi-functional electronic instruments.1 Thermal interface materials (TIMs) act as a heat transfer medium to fill the gap between the heat source and the heat sink to ensure the stable operation of the equipment.2 Polymer-based nanocomposites (TIMs) have been widely used in electronic components that need to dissipate a great amount of heat.3–5 It should be pointed out that the selection of high-thermal conductivity fillers is the key to enhancing the thermal conductivity of polymer nanocomposites. The graphene and carbon nanotubes (CNTs), such as thermal conductivity fillers, can effectively enhance the heat conductivity because of the high intrinsic thermal conductivity.6 However, developing high-thermal conductivity nanocomposites with high filler orientation and low filler addition is still a great challenge because of the construction of thermal conductive pathways and the existence of filler agglomeration. It is expected that the thermal conductive pathways are built via filler alignment under a low-volume fraction. Several procedures, including hot-pressing, ice-templates and layer-by-layer assembly, have been developed to build the well-ordered thermal conductive pathways in the nanocomposites,.3,5,7,8 Under the influence of gravity and thermal motion, it is difficult for the fillers to form orientation along the direction of heat conduction.9 Recently, it has been found that an attractive strategy can control the filler orientation via external magnetic fields.10,11 Although the fillers coated with magnetic materials exhibit an ultrahigh magnetic response that enables remote control over their orientation in the direction of heat transfer, the coating method may result in the decline of magnetic responsiveness, followed by the shedding of magnetic materials.9,12,13 Hence, the magnetic materials embedded in the nanostructure of fillers are proposed for obtaining the oriented thermal transfer pathways to effectively enhance the thermal conductivity.Metal–organic frameworks (MOFs) have been extensively used as self-sacrificial templates for building hierarchical carbon-based nanostructures.14,15 MOF-derived carbon-based composites often exhibit a large amount of graphitic carbon, which is considered to be able to conduct heat. Herein, we report a magnetic oriented thermal conductive filler, in which core–shell magnetic cobalt oxide (Co@Co3O4) embedding in situ formed CNT-grafted graphene polyhedra (Co@Co3O4-G) via directly annealing ZIF-67 (zeolitic imidazolate frameworks is a sub-class of MOFs) nanoparticles.16 The bifunctional filler has both the CNT and graphene structure and the magnetic response, which can achieve the purpose of obtaining a continuous oriented heat conductive pathway to effectively enhance the thermal conductivity. Meanwhile, the concomitant formation of Co@Co3O4 encapsulated in the nanostructure can keep the stability of magnetic orientation.
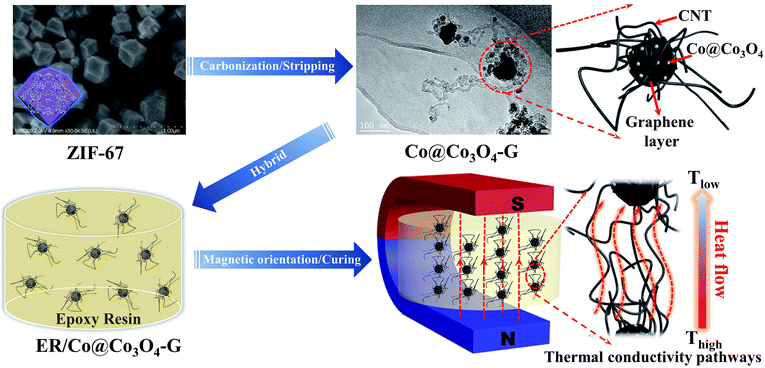
In this study, the thermal conductivity of Co@Co3O4-G filler nanocomposites with epoxy resin (ER/Co@Co3O4-G) was investigated by constructing the oriented thermal conductive pathway. The detailed fabrication process of ER/Co@Co3O4-G is illustrated in Fig. 1 and S1.† First, the nanosized ZIF-67 was obtained by controlling the experimental conditions. After that, Co@Co3O4-G was fabricated by the carbonization of ZIF-67 and stripping of N atoms. During the carbonization process, the CNT and graphene layers were formed by the catalysis of reduced Co nanoparticles. The product of ZIF-67 carbonization was denoted as Co–N/C. Following the stripping process, the core–shell structure of Co@Co3O4 was obtained, while the N atoms from the imidazole were removed. Finally, ER/Co@Co3O4-G with an oriented filler distribution was achieved via magnetic orientation and curing. ZIF-67 was deliberately chosen as the precursor because of the presence of cobalt elements, which can catalyse the production of graphene structures (including CNT and graphene layers around Co@Co3O4) during the carbonization process.17 Moreover, Co@Co3O4 nanoparticles embedded in the structure acted as magnetic response agents to achieve the orientation arrangement of the filler. Furthermore, the stripping process can effectively remove the N atoms to further improve the thermal conductivity.18 Moreover, the equilibrium molecular dynamics (EMD) simulation verified that Co@Co3O4-G had high thermal conductivity to effectively improve the heat dissipation of nanocomposites.
2. Experimental
2.1 Materials
Cobalt(II) acetate tetrahydrate (Co (CH3COO)2·4H2O), 2-methylimidazole (2-MI, C4H6N2), and methanol (CH3OH) were all of analytical grade and commercially obtained from domestic chemical reagents companies. The DOW Chemical Company supplied liquid epoxy resin. Deionized water was used throughout the experiments.2.2 Synthesis of ZIF-67
ZIF-67 was prepared according to the procedure reported in the literature.19 Typically, 2.16 g of Co(CH3COO)2·4H2O and 4.88 g of 2-methylimidazole were dissolved in 75 ml of methanol to form solutions A and B, respectively. The A solution was poured into the B solution with vigorous stirring and whisked continuously for further 10 min. Then, the solution was kept for 24 h at room temperature. The product was collected by centrifugation and washed with methanol three times. Finally, the product was obtained by vacuum drying at 70 °C for overnight.2.3 Synthesis of Co–N/C
First, 100 mg of ZIF-67 was transferred into a crucible and placed in a tube furnace under a H2/Ar (10% H2 with total) flow. The product was carbonized at 800 °C for 2 h at a heating rate of 5 °C min−1. After cooling naturally to room temperature, the black powders were obtained and used for further characterization.2.4 Preparation of Co@Co3O4-G
The as-obtained Co–N/C was further calcined at 400 °C under an O2/Ar (10% O2 with total) flow. The sample treated for 8 h was designated as Co@Co3O4-G.2.5 Preparation of ER/Co@Co3O4-G nanocomposites
The Co@Co3O4-G powder was mixed with epoxy resin by sonication for 20 min. After that, the curing agent and catalytic agent were added and mixed by stirring, with the weight ratio to be 1![[thin space (1/6-em)]](https://www.rsc.org/images/entities/char_2009.gif) :
:![[thin space (1/6-em)]](https://www.rsc.org/images/entities/char_2009.gif) 0.8
0.8![[thin space (1/6-em)]](https://www.rsc.org/images/entities/char_2009.gif) :
:![[thin space (1/6-em)]](https://www.rsc.org/images/entities/char_2009.gif) 0.01. The nanocomposites with different thermal conductivities were fabricated by controlling the content of Co@Co3O4-G. The nanocomposites were transferred to a glass mold and placed between parallel magnets for 30 min. Then, the sample was degassed in a vacuum oven at 50 °C for 2 h. Finally, the samples were thermally cured at 150 °C for 1 h. After cooling to room temperature, the samples were cut into pieces for thermal conductivity measurements.
0.01. The nanocomposites with different thermal conductivities were fabricated by controlling the content of Co@Co3O4-G. The nanocomposites were transferred to a glass mold and placed between parallel magnets for 30 min. Then, the sample was degassed in a vacuum oven at 50 °C for 2 h. Finally, the samples were thermally cured at 150 °C for 1 h. After cooling to room temperature, the samples were cut into pieces for thermal conductivity measurements.
2.6 Thermal conductivity of nanocomposites
The samples were cured and prepared in the cylindrical shape with 12.7 mm in diameter and 2.0 mm in thickness. The thermal conductivity (κ) of nanocomposites was calculated using the following formula (1):| κ = ρCpσ | (1) |
2.7 EMD simulation of the thermal conductivity
The equilibrium molecular dynamics simulation (EMD, i.e., Green–Kubo method)20 for calculating the thermal conductivity was performed using the open-source LAMMPS package. For a detailed calculation of heat flux, the readers can refer to the webpage of https://lammps.sandia.gov/doc/compute_heat_flux.html. The initial structure of junction between graphene and the CNT contained 3913 atoms in total (2973 atoms in the graphene sheet, and 940 atoms in the graphene tube). When the model was built, the distance between the CNT and graphene was 2.421 Å. With the increase in equilibrium time, graphene and the CNT bond with each other at the junction under the action of Tersoff potential parameters. Then, the initial structure was first relaxed for 50 ns at 300 K, for optimizing the junction of the graphene sheet and the carbon nanotube. Further, the relaxed structure was applied in another 50 ns for thermal conductivity calculations. In both the relaxation and calculation stages, the Tersoff potential was employed, which has been broadly employed in the thermal conductivity calculations of graphene.21 A time step of 0.5 fs was used with the Verlet algorithm to update the position and velocity of atoms in a simulation box with periodic boundary conditions in three dimensions. The NVT ensemble (constant number of atoms, volume and temperature) was switched on during the relaxation stage, while the NVE ensemble (constant number of atoms, volume and energy) was used in thermal conductivity calculations.2.8 Characterization
The X-ray diffraction (XRD) data were recorded on a D/max-TTR III Advance powder diffractometer operating at 40 kV and 40 mA with Cu Kα (λ = 1.54178 Å) radiation (2θ range, 3–80°). Raman spectra were recorded using a Jobin-yvon iHR550 spectrometer (Bensheim, Germany) equipped with a TE cooled charge-coupled device. The morphological analyses of different samples were performed using a Hitachi field emission scanning electron microscope (FESEM) SU8200 series. Transmission electron microscopy (TEM) was performed using a JEOL JEM2100F transmission electron microscope operating at 200 kV and equipped with an energy-dispersive X-ray spectrometer (EDS) and a Gatan annular dark-field (ADF) detector. The TEM sample of the nanocomposite was cut using a diamond knife on an ultramicrotome (Leica Microsystems, Germany) and mounted on copper grids. X-ray photoelectron spectroscopy (XPS) was performed using an ESCAlab220i-XL electron spectrometer from Thermo Scientific (VG Scientific) with 300 W Al Kα radiation. The thermal diffusivity of samples was determined via a laser flash technique (NETZSCH, LFA-467 HyperFlash, Germany) at room temperature. The magnetic properties were measured using a magnetic property measurement system (MPMS3, Quantum Design International, USA). The specific heat was tested by differential scanning calorimetry (DSC TA Instruments, Q2000). The density of Co@Co3O4-G was measured using an electron density balance of Changzhou Xing Yun Electronic Equipment Co., Ltd. The temperature distribution image of the composites was recorded via infrared thermography (FLIR T1040, FLIR Systems, Inc., USA). The frequency-dependent electrical conductivity was measured using a Novo-control Alpha-N high-resolution dielectric analyzer (GmbH Concept 40) with the frequency range of 102 to 106 Hz at room temperature.3. Results and discussion
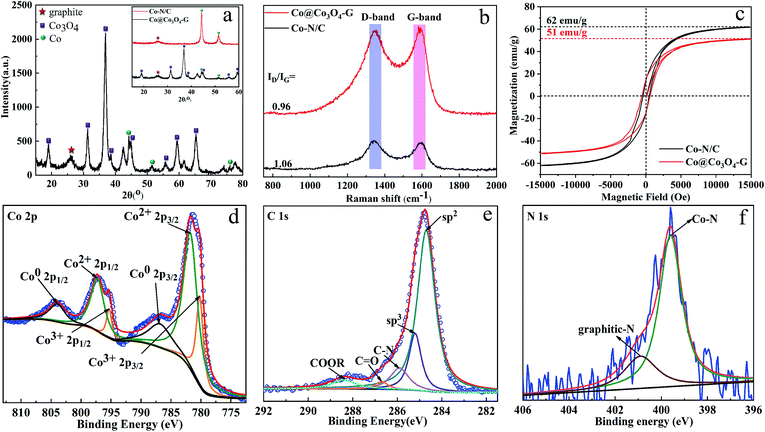
Co@Co3O4-G was prepared via the two-step transformation of ZIF-67, namely, carbonization and stripping (see in the ESI, Fig. S1†). The powder X-ray diffraction (XRD) pattern of ZIF-67 has been shown in Fig. S2† to confirm the crystalline integrity. The XRD patterns of Co–N/C and Co@Co3O4-G are shown in Fig. 2a. The broad diffraction peak at 26.0° was ascribed to graphene, and the peaks at 19.1°, 31.2°, 36.9°, 38.6°, 55.7°, 59.4° and 65.3° were assigned to Co3O4, with the peaks of at 44.3°, 51.5° and 77.5° belonging to Co0.19,22 More importantly, the oxygen treatment of Co–N/C not only effectively removed N atoms but also enhanced the degree of graphitization due to the removal of amorphous carbon (inset in the Fig. 2a).19 Meanwhile, the Raman spectra of Co–N/C and Co@Co3O4-G are shown in Fig. 2b. The characteristic peaks of the defective graphitic structures at 1346 cm−1 represent the D band, while the G band at 1585 cm−1 corresponds to the graphitic layer.23 The low ID/IG (the intensity ratio of D- and G-band) value suggested the generation of more graphitic layers, which indicated that the N atoms were stripped in the graphene structure during oxidation.23 For magnetic sensitivity, the magnetic hysteresis loops of Co–N/C and Co@Co3O4-G were further investigated, as shown in Fig. 2c. The saturation magnetization of Co@Co3O4-G was determined to be 51 emu g−1, which was lower than the 62 emu g−1 of Co–N/C. The decrease was caused by Co oxidation. However, for all these, Co@Co3O4-G still exhibited a type of ferromagnetic behaviour and magnetic response. Co@Co3O4-G dispersed in water can be separated from water by an external magnetic field within a short time, as shown in Fig. S3.†Furthermore, the presence of magnetic cobalt and graphitic carbon was also verified by XPS (Fig. 2d–f). The Co nanoparticles in Co–N/C inevitably suffered from oxidation because the Co nanoparticles were closer to the surface.24 As manifested in Fig. 2d, the presence of Co2+ 2p and Co3+ 2p peaks suggested that the magnetic material was Co3O4. After deconvolution, three symbolical peaks at 786.9 eV, 780.3 eV and 782.1 eV corresponded to Co0 2p3/2, Co3+ 2p3/2 and Co2+ 2p3/2, while those peaks at 804.1 eV, 795.3 eV and 798.0 eV corresponded to Co0 2p1/2, Co3+ 2p1/2 and Co2+ 2p1/2, respectively.24 The C 1s peak of typical graphitic carbon was mainly centred at 284.7 eV, which was attributable to sp2 hybridized carbon (Fig. 2e). The results further proved that carbon in the sample was in the form of graphite.25 Few N atoms could be detected in the full XPS spectrum (Fig. S4a and b†). The N 1s spectra of Co–N/C and Co@Co3O4-G are shown in Fig. 2f, S4c and d.† The N 1s spectra of Co–N/C could be deconvoluted into three types of peaks, which were attributed to pyridinic-N (398.4 eV), Co–N species (399.1 eV) and graphitic-N (401.2 eV).24 After oxidizing Co–N/C, however, deconvoluted N 1s of Co@Co3O4-G had only two peaks, namely, graphitic-N and Co–N species. The peak observed at 399.1 eV was related to the Co–N bond, which confirmed that the Co element was fixed in the structure.26 In addition, the removal of the N atom also indirectly manifested that the Co element could efficiently improve graphitization and promote the thermal conductivity.27 Therefore, these results confirmed the construction of graphitization structures by the core–shell structure of Co@Co3O4.
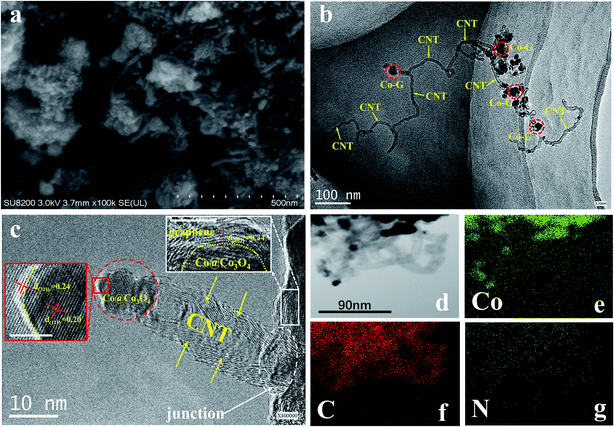
To understand the morphological evolution occurring during the annealing process, Fig. S5† and 3a illustrate the SEM images of the truncated cubic ZIF-67 and Co@Co3O4-G, respectively. Uniform nanosized ZIF-67 can be obtained by adjusting the experimental conditions. Nanosized ZIF-67 has proved to be more easily converted into a graphene structure.24 Therefore, it was observed that a large number of CNTs were uniformly distributed on the surface of graphene-coated Co@Co3O4 polyhedra (Co-G). To further reveal the structural relationship between Co-G and the CNT, the microstructure of Co@Co3O4-G was unveiled by TEM and HRTEM. A plenty of CNTs could be seen by TEM observation, inconsistent with the SEM result (Fig. S6a†). Moreover, Co-G were linked by CNTs, generating the beaded structure (Fig. 3b). The CNT with excellent connectivity between Co-G is highly important for constructing the continuous thermal conductive pathways. The HRTEM image in Fig. 3c further showed the in situ growth junction part between CNTs and Co-G. The CNT was pinned well on the graphene layer of Co-G, which was formed by the covalent bonds in the dotted oval.28 Co@Co3O4 was enwrapped with highly graphitic carbon, which was composed of multi-layered graphene. The crystal structure of Co-G was further analysed by the lattice fringes, in which an interspacing of 0.34 nm corresponded to the graphitic (002) plane. Meanwhile, the interspacing of 0.24 nm was consistent with the Co3O4 (311) plane of the outer layer, and the interspacing of 0.20 nm corresponded to the Co (111) plane of the inner core. During carbonization of ZIF-67, the Co ions were reduced to Co nanoparticles in the hydrogen, and the carbon atoms of 2-MI near Co could be catalysed to graphitic carbon structures (inset in the Fig. 3c).24 The TEM-EDS elemental mapping was employed to obtain the elemental distribution of C, N, Co, and O in Fig. 3d–g and S6b.† It was evident that Co@Co3O4 was wrapped in the graphene layer, which was beneficial to the magnetic orientation. The distribution of O atoms illustrated the fact that Co was oxidized. The N element was hard to be detected. Meanwhile, the EDS spectrum and weight/atoms percentage of various atoms in Co@Co3O4-G also reflected the elimination of N atoms and entry of O atoms (Fig. S6c and d†). The results were consistent with the observation from the XPS.
The preparation procedure of ER/Co@Co3O4-G nanocomposites was described in the experimental section. To get the oriented arrangement of filler in the nanocomposites, an external magnetic field was used to control the orientation of Co@Co3O4-G by placing the mould between two magnets. The XRD of pure ER (Fig. 4a) showed a broad diffraction peak curve reflected at ∼19°,29 indicating its amorphous structure. In the XRD pattern of ER/Co@Co3O4-G (Fig. 4c), the characteristic peaks of Co@Co3O4-G and ER were consistent with Fig. 4a and b. The weakened graphitic (002) peak was due to the encapsulation of ER in the nanocomposites. The TEM of ER/Co@Co3O4-G can give useful information about the arrangement of Co@Co3O4-G in the nanocomposites. In order to clearly show the orientation of filler, the TEM of the ultrathin section of ER/Co@Co3O4-G is produced in Fig. 4d, e and S7.† Fig. 4d shows that Co@Co3O4-G had been aligned under the external magnetic field. Fig. 4e and S7† exhibit the cross-sectional structure of CNTs, in which there were obvious hollow CNT structures and the CNT containing Co@Co3O4.
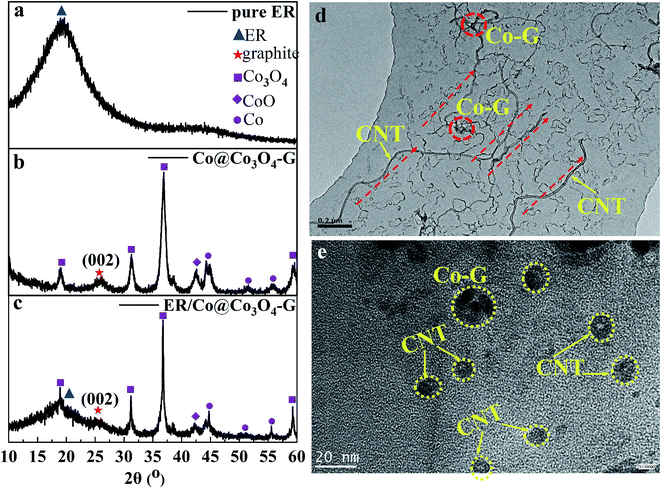 | ||
| Fig. 4 XRD patterns of pure ER (a). Co@Co3O4-G (b) and ER/Co@Co3O4-G with 8.7 vol% loading of Co@Co3O4-G (c). TEM (d) and HRTEM (e) images of ER/Co@Co3O4-G with 8.7 vol% loading of Co@Co3O4-G. | ||
In the current study, the nanostructure of covalently bonded CNT-graphene layers (G∩CNT) in Co@Co3O4-G played a significant role in the thermal conductivity of nanocomposites. The bottle-neck of affecting the thermal conductivity should attribute to the junction of G∩CNT. To better understand the thermal transfer mechanism of G∩CNT, the equilibrium molecular dynamics simulation (EMD) was performed with the open-source LAMMPS package. The thermal conductivity of G∩CNT and the junction was calculated using the Green–Kubo method:20
 | (2) |
In the EMD method, the thermal conductivity was obtained from the time integral of the heat flux auto-correlation function (HCACF) in formula (2). As can be seen from Fig. 5a and S8,† the model of G∩CNT was defect-free, and the periodic boundary conditions were adopted, so there was no phonon-defect scattering effect. Then, the attenuation of HCACF was caused by the non-harmonic phonon and phonon Umpklapp scattering interaction. Therefore, the thermal conductivities of G∩CNT and the junction were 696.84 and 673.44 W m−1 K−1, respectively. This result leads us to conclude that the thermal conductivity of G∩CNT can be optimized after sufficient relaxation time, which can make the junction to have a similar structure to graphene. To further explore the thermal conductivity at G∩CNT and the junction, the HCACF of G∩CNT and junction are shown in Fig. 5b and S9.† The oscillation of HCACF at the junction was more violent than that of G∩CNT, but they all showed a similar oscillation curve and a trend of attenuation to zero. Meanwhile, the phonon density of states (PDOS) of the junction containing 92 atoms and 46 atoms was determined by the Fourier transform of the velocity autocorrelation function and is shown in Fig. 5c.30 The phonon density of the 46 atoms was very similar to that of the 92 atoms, well matching for the vibrational and thermodynamically properties.
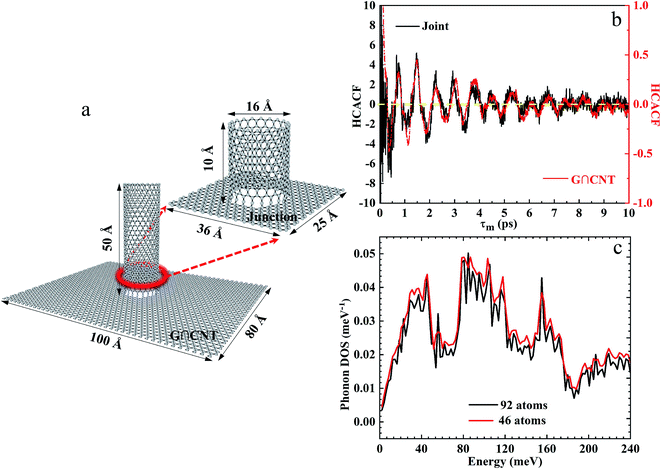 | ||
| Fig. 5 (a) Structure of G∩CNT and the junction. (b) Change in HCACF of G∩CNT and the junction with time. (c) PDOS of G∩CNT containing 92 atoms and 46 atoms. | ||
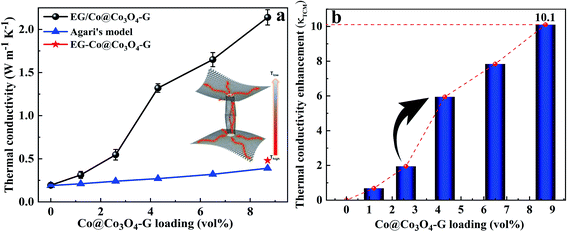
To investigate the potential application of thermal management materials, the thermal conductivities of the nanocomposites with different Co@Co3O4-G loadings were determined at room temperature, and the results are shown in Fig. 6a. It is clear that the thermal conductivity of nanocomposites had significant enhancement with the increase in fillers. The thermal conductivity value of nanocomposites with 8.7 vol% filler was 2.11 W m−1 K−1, which was ∼10 times higher than that of the pure ER. Meanwhile, the value was close to 5 times the thermal conductivity of the unoriented nanocomposites (ER-Co@Co3O4-G). The influence of magnetic field strength on the thermal conductivity was studied, because it can affect the formation of alignment of fillers. As shown in Fig. S10,† with the increase in magnetic field intensity, the filler formed continuous heat conduction pathways in the nanocomposites, which also obtained a high thermal conductivity. In addition, the thermal conductivity along and perpendicular to the magnetic field was measured in Fig. S11,† and the results indicate that the microstructure of filler has thermal anisotropy. Furthermore, the thermal conductivity enhancement (κTCE) was also an important parameter to describe the heat transfer of nanocomposites. The formula is shown as follows:
 | (3) |
In order to further explore the thermal conductivity performance of the nanocomposites, the thermal conductive models were applied to predict the theoretical values.31 The thermal conductivity pathway was tended to form by the interaction of Co@Co3O4-G in nanocomposites under the influence of the external magnetic field. Therefore, Agari's model was also proposed to assess the thermal conductivity of ER/Co@Co3O4-G.32,33
log![[thin space (1/6-em)]](https://www.rsc.org/images/entities/char_2009.gif) κc1 = VfC2 κc1 = VfC2![[thin space (1/6-em)]](https://www.rsc.org/images/entities/char_2009.gif) log log![[thin space (1/6-em)]](https://www.rsc.org/images/entities/char_2009.gif) κf + (1 − Vf)log κf + (1 − Vf)log![[thin space (1/6-em)]](https://www.rsc.org/images/entities/char_2009.gif) (κERC1) (κERC1)
| (4) |
 | (5) |
As it is evident from Fig. 6a, although the predicted values increased with the increase in content, it was apparently low than the experimental values of ER/Co@Co3O4-G. Based on these results, we concluded that magnetic orientation plays an important role in improving the thermal conductivity. Besides, the thermal conduction schematic of filler was proposed to understand the mechanism, as shown in Fig. 6a and S13.† The Co@Co3O4-G built an oriented nanostructure under the magnetic field, which provided a pathway for heat transfer to complete the rapid movement of heat.
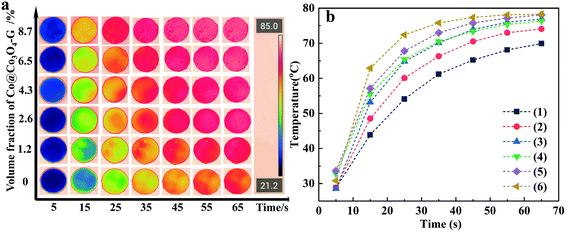
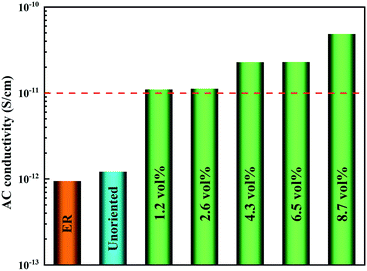
In order to demonstrate the application of nanocomposites in thermal management, the heat transport capability was investigated by the infrared thermal imager. The samples of nanocomposites with different loadings were placed on a heating plate. From Fig. 7a, the temperature of the samples gradually increased as a function of time. It was essential to highlight that the surface temperature of the nanocomposite with high loading was higher than that of the nanocomposite with low loading. Fig. 7b more clearly reflects the tendency of the surface temperature of the nanocomposites with different loadings and times. It was worth mentioning that the highest temperature of the nanocomposites can be closed to 80 °C after 65 seconds, while the temperature of other samples was relatively low. The above-mentioned results indicated that a strong thermal response could be achieved by a continuous heat conductive pathway. Considering the electrical insulation applications of nanocomposites, the electric conductivity of ER/Co@Co3O4-G with different loadings at 100 Hz was measured as shown in Fig. 8. The introduction of Co@Co3O4-G did not significantly improve the electrical conductivity of the nanocomposites, which should result from the weakening electron migration caused by the high electrical resistivity of Co3O4. Moreover, Fig. S14† shows the frequency-dependent electrical conductivity of nanocomposites with different loadings. The enhanced effect of the graphene structure was not reflected in the mobility of electrons, ultimately resulting in the low electrical conductivity at various frequencies. This result also illustrated that the electrical conductive pathway was not built in the nanocomposites, which had a great application potential in electronic devices.
4. Conclusions
In summary, thermal conductive nanocomposites with oriented Co@Co3O4-G fillers were successfully fabricated with the assistance of an external magnetic field. A novel filler of encapsulated magnetic core–shell Co@Co3O4 of CNT-grafted graphene polyhedra has been developed via annealing ZIF-67 in order to create high-efficiency thermal conductive pathways. The graphene structure and the magnetic orientation of the filler were beneficial to the heat transfer. As a result, the thermal conductivity of ER/Co@Co3O4-G with a loading of 8.7 vol% reached 2.11 W m−1 K−1, which was more than 10 times as high as that of the ER. In addition, ER/Co@Co3O4-G still possessed good electrical insulating properties. Furthermore, the EMD simulation proved that the structure can achieve uniform thermal conductivity. This work provided an advanced technique to design fillers in the thermal conductive nanocomposites and establish thermal management materials.Conflicts of interest
There are no conflicts to declare.Acknowledgements
The authors acknowledge the financial support from National Key R&D Program of China (No. 2017YFB0406204), National Natural Science Foundation of China (No. 51973002, 21606215, 21606001 and 21606217) and State Key Laboratory of Separation Membranes and Membrane Processes (Tianjin Polytechnic University, No. M2-201706).Notes and references
- H. Song, J. Liu, B. Liu, J. Wu, H. M. Cheng and F. Kang, Joule, 2018, 2, 442–463 CrossRef CAS.
- D. Suh, C. M. Moon, D. Kim and S. Baik, Adv. Mater., 2016, 28, 7220–7227 CrossRef CAS PubMed.
- N. Song, D. Jiao, S. Cui, X. Hou, P. Ding and L. Shi, ACS Appl. Mater. Interfaces, 2017, 9, 2924–2932 CrossRef CAS PubMed.
- J. Chen, X. Huang, B. Sun, Y. Wang, Y. Zhu and P. Jiang, ACS Appl. Mater. Interfaces, 2017, 9, 30909–30917 CrossRef CAS PubMed.
- G. Pan, Y. Yao, X. Zeng, J. Sun, J. Hu, R. Sun, J. B. Xu and C. P. Wong, ACS Appl. Mater. Interfaces, 2017, 9, 33001–33010 CrossRef CAS PubMed.
- A. A. Balandin, Nat. Mater., 2011, 10, 569–581 CrossRef CAS PubMed.
- Y. Yao, J. Sun, X. Zeng, R. Sun, J. B. Xu and C. P. Wong, Small, 2018, 14, e1704044 CrossRef PubMed.
- M. Liu, Z. Yang, H. Sun, C. Lai, X. Zhao, H. Peng and T. Liu, Nano Res., 2016, 9, 3735–3746 CrossRef CAS.
- R. M. Erb, R. Libanori, N. Rothfuchs and A. R. Studart, Science, 2012, 335, 199–204 CrossRef CAS PubMed.
- C. Du, M. Li, M. Cao, S. Feng, H. Guo and B. Li, Carbon, 2018, 126, 197–207 CrossRef CAS.
- J. Renteria, S. Legedza, R. Salgado, M. P. Balandin, S. Ramirez, M. Saadah, F. Kargar and A. A. Balandin, Mater. Des., 2015, 88, 214–221 CrossRef CAS.
- Z. Lin, Y. Liu, S. Raghavan, K. S. Moon, S. K. Sitaraman and C. P. Wong, ACS Appl. Mater. Interfaces, 2013, 5, 7633–7640 CrossRef CAS PubMed.
- C. Yuan, B. Duan, L. Li, B. Xie, M. Huang and X. Luo, ACS Appl. Mater. Interfaces, 2015, 7, 13000–13006 CrossRef CAS PubMed.
- S. Dang, Q.-L. Zhu and Q. Xu, Nat. Rev. Mater., 2017, 3, 17075 CrossRef.
- M. Zhong, L. Kong, N. Li, Y.-Y. Liu, J. Zhu and X. H. Bu, Coord. Chem. Rev., 2019, 388, 172–201 CrossRef CAS.
- A. P. Rahul Banerjee, B. Wang, C. Knobler, H. Furukawa, M. O'Keeffe and O. M. Yaghi, Science, 2008, 319, 939–943 CrossRef PubMed.
- J.-P. Tessonnier, M. Becker, W. Xia, F. Girgsdies, R. Blume, L. Yao, D. S. Su, M. Muhler and R. Schlögl, ChemCatChem, 2010, 2, 1559–1561 CrossRef CAS.
- B. Mortazavi, O. Rahaman, T. Rabczuk and L. F. C. Pereira, Carbon, 2016, 106, 1–8 CrossRef CAS.
- A. Aijaz, J. Masa, C. Rosler, W. Xia, P. Weide, A. J. Botz, R. A. Fischer, W. Schuhmann and M. Muhler, Angew. Chem., Int. Ed., 2016, 55, 4087–4091 CrossRef CAS PubMed.
- P. K. Schelling, S. R. Phillpot and P. Keblinski, Phys. Rev. B: Condens. Matter Mater. Phys., 2002, 65, 144306 CrossRef.
- L. Lindsay and D. A. Broido, Phys. Rev. B: Condens. Matter Mater. Phys., 2010, 81, 205441 CrossRef.
- H. Jin, J. Wang, D. Su, Z. Wei, Z. Pang and Y. Wang, J. Am. Chem. Soc., 2015, 137, 2688–2694 CrossRef CAS PubMed.
- F. Zheng, Y. Yang and Q. Chen, Nat. Commun., 2014, 5, 5261 CrossRef CAS PubMed.
- W. Zhang, X. F. Jiang, X. B. Wang, Y. V. Kaneti, Y. X. Chen, J. Liu, J. S. Jiang, Y. Yamauchi and M. Hu, Angew. Chem., Int. Ed., 2017, 56, 8435–8440 CrossRef CAS PubMed.
- S. W. Lee, N. Yabuuchi, B. M. Gallant, S. Chen, B. S. Kim, P. T. Hammond and Y. S. Horn, Nat. Nanotechnol., 2010, 5, 531–537 CrossRef CAS PubMed.
- Y. Hou, Z. Wen, S. Cui, S. Ci, S. Mao and J. Chen, Adv. Funct. Mater., 2015, 25, 872–882 CrossRef CAS.
- Z. Chen, R. Wu, Y. Liu, Y. Ha, Y. Guo, D. Sun, M. Liu and F. Fang, Adv. Mater., 2018, 30, 1802011 CrossRef PubMed.
- D. Su, M. Cortie and G. Wang, Adv. Energy Mater., 2017, 7, 1602014 CrossRef.
- W. Yao, M. Tebyetakerwa, X. H. Bian, W. L. Li, S. Y. Yang, A. J. Qin, M. F. Zhu, R. Hu, Z. M. Wang and B. Z. Tang, J. Mater. Chem. C, 2018, 6, 12849–12857 RSC.
- S. Shin, M. Kaviany, T. Desai and R. Bonner, Phys. Rev. B: Condens. Matter Mater. Phys., 2010, 82, 081302 CrossRef.
- Y. Su, J. J. Li and G. J. Weng, Carbon, 2018, 137, 222–233 CrossRef CAS.
- Y. Agari and T. Uno, J. Appl. Polym. Sci., 1986, 32, 5705–5712 CrossRef CAS.
- Y. Agari, A. Uno, M. Tanaka and S. Nagai, J. Appl. Polym. Sci., 1990, 40, 929–941 CrossRef CAS.
- Y. Agari, M. Tanaka and S. Nagai, J. Appl. Polym. Sci., 1987, 34, 1429 CrossRef CAS.
- Y. Agari, A. Uno and S. Nagai, J. Appl. Polym. Sci., 1993, 49, 1625–1634 CrossRef CAS.
Footnote |
| † Electronic supplementary information (ESI) available. See DOI: 10.1039/c9ra09199h |
| This journal is © The Royal Society of Chemistry 2020 |

