 Open Access Article
Comparison of porous carbons derived from sodium alginate and calcium alginate and their electrochemical properties†
Ming Li ,
Kuihua Han
 *,
Zhaocai Teng,
Jinxiao Li,
Meimei Wang and
Xian Li
School of Energy and Power Engineering, Shandong University, Jinan 250061, China. E-mail: hankh@163.com
First published on 10th January 2020
Abstract
Here, sodium alginate and calcium alginate which have the same carbon-forming component (alginic acid) and different regulation component (sodium/calcium) were used to prepare porous carbons, and comparisons were made of the microstructures and electrochemical properties of the obtained charcoals. The morphology was characterized by Scanning electron microscopy (SEM), and the results show that porous carbons can inherit plane or concave structures from their corresponding carbonized samples. The Horvath–Kawazoe (HK) method was used to analyze micropore size distributions, and the results show that, under the same mass ratio of potassium hydroxide to carbonized sample (KOH/C), the positions of extreme points on the two curves are similar, but the extreme values are different, and new extreme points appear at larger pore sizes with increases in the KOH/C ratio. The results of cyclic voltammetry (CV) and galvanostatic charge and discharge (GCD) tests show that the capacitance of sodium alginate-derived porous carbon is greater than that of porous carbon derived from calcium alginate when the KOH/C ratios are 2 and 4, and the size relationship is reversed when the KOH/C ratio is 3. The results of cycling performance tests show that the cycle numbers corresponding to the three stages on the two curves are similar under the same KOH/C ratio, but the cycle numbers at the same stage are significantly different under different KOH/C ratios.
Introduction
Carbonaceous porous materials with high specific surface areas, large pore volume, developed pore structures,1–3 high electrical conductivity and good thermochemical stability4–6 are considered to possess high potential for energy storage.7–9 Biomass used to prepare porous carbons has attracted extensive attention because of its richness, diversity and easy availability. Generally, biomass consists of cellulose, hemicellulose, lignin, inorganic salts, etc. Based on the formation mechanism of porous carbons, various components of biomass can be divided into carbon-forming components (for example, cellulose) and regulation components (for example, inorganic salts). Although regulation components are not converted into the products, they are capable of adjusting the composition and microstructures of charcoals. For instance, the specific surface areas can be increased by removing minerals from raw materials;10–12 adding certain compounds to the raw materials can introduce the target elements (such as N, P, S, etc.) into the charcoals;13–18 the microstructures can be changed by adjusting the composition of raw materials (such as adding calcium).19–22 These methods have been used to improve the capacitance performance. However, in general, biomass usually contains a variety of carbon-forming components and regulation components, the contents of which are different and their distributions are uneven,23–26 and then the detailed roles played by regulation components are still unclear. Figuring out the roles of regulation components is beneficial for microstructure directional control of carbon materials. Therefore, it is necessary to study the roles of common regulators such as sodium and calcium.The carbonized samples obtained by carbonization of precursors often need to be activated to improve their pore structures. Although the activation mechanism of different activation methods is different, based on the actual treatment effects, the activation treatments aim to develop pore structures by etching the surface of carbonized samples.27–33 Due to the excellent ability to create pores in carbon materials, KOH has been widely used to prepare high-performance porous carbons with ultra-high specific surface areas and large pore volumes.34,35 More importantly, there is a simple way to prepare charcoals with different pore structures by changing the mass ratios of KOH to carbon material. In general, a target sample is selected for detailed study based on a certain performance of carbon materials (for example, specific mass capacitance), but few studies have been conducted on the correlations of all products in terms of microstructures, electrochemical performance, etc.
Alginic acid, a natural polysaccharide in the cell wall of seaweed, is an excellent raw material for the preparation of charcoals.36,37 In order to compare the differences in the microstructures of charcoals derived from alginic acid under the effect of sodium or calcium, sodium alginate and calcium alginate were chosen as precursors, which have the same carbon-forming component (alginic acid) and different regulation components (sodium or calcium), and those components are evenly distributed in the precursor. Two carbonized samples were obtained by simple carbonization. Six porous carbons were prepared at three different KOH/C ratios and comparison of their microstructures and electrochemical performance were made. The microstructures of those obtained charcoals were investigated based on morphology and pore structure. SEM was used to characterize the morphology, and then differences of the two carbonized samples were compared, and similarities between the carbonized samples and their corresponding porous carbons were observed. The pore structures were characterized by nitrogen adsorption and desorption, HK method and Barrett Joyner and Halenda (BJH) method, and then the pore structures of different charcoals were compared and their variation with the KOH/C ratio were investigated. The electrochemical properties were characterized by CV, GCD, electrochemical impedance spectroscopy (EIS), rate performance and cycle performance, and then the relationship between the performance and microstructures was analysed.
Experimental
Materials
Sodium alginate (SA) and potassium hydroxide (KOH) were purchased from Tianjin Kermel Chemical Reagent Co., Ltd., China. Calcium alginate (CA) was purchased from J&K Scientific Co., Ltd., China. Hydrochloric acid (HCl) was obtained from Sinopharm Chemical Reagent Co., Ltd., China. Nickel foam (thickness of 1 mm), conductive graphite, polytetrafluoroethylene (PTFE) emulsion, glassy-fiber filter paper, and coin cell shell (2016-type) were purchased from Shanxi Battery Materials Co., Ltd, China. Chemical reagents used in this study were all of analytical grade. Deionized water was used throughout all preparation and treatment processes.Synthesis of porous carbons
Under nitrogen atmosphere, precursors were placed in a tubular furnace at 600 °C for 2 hours with a heating rate of 5 °C min−1 and then naturally cooled to room temperature. The carbonized products were extensively washed with 5 M HCl and then washed thoroughly with deionized water until neutral. After drying in an oven at 105 °C for 24 hours, two kinds of carbonized samples were obtained. The carbonized sample was immersed in saturated KOH solution for 12 hours, wherein the KOH/C ratios were 2![[thin space (1/6-em)]](https://www.rsc.org/images/entities/char_2009.gif) :
:![[thin space (1/6-em)]](https://www.rsc.org/images/entities/char_2009.gif) 1, 3
1, 3![[thin space (1/6-em)]](https://www.rsc.org/images/entities/char_2009.gif) :
:![[thin space (1/6-em)]](https://www.rsc.org/images/entities/char_2009.gif) 1 and 4
1 and 4![[thin space (1/6-em)]](https://www.rsc.org/images/entities/char_2009.gif) :
:![[thin space (1/6-em)]](https://www.rsc.org/images/entities/char_2009.gif) 1, respectively. The mixtures were placed in a muffle furnace at 800 °C for 2 hours with a heating rate of 5 °C min−1 and then naturally cooled to room temperature. The activated products were extensively washed with 5 M HCl and then washed thoroughly with deionized water until neutral. After drying in an oven at 105 °C for 24 hours, porous carbons were obtained. The carbonized samples were denoted as SA-C and CA-C, respectively, and their derived products were denoted as SA-AC-X and CA-AC-X (X = 2, 3 and 4), respectively.
1, respectively. The mixtures were placed in a muffle furnace at 800 °C for 2 hours with a heating rate of 5 °C min−1 and then naturally cooled to room temperature. The activated products were extensively washed with 5 M HCl and then washed thoroughly with deionized water until neutral. After drying in an oven at 105 °C for 24 hours, porous carbons were obtained. The carbonized samples were denoted as SA-C and CA-C, respectively, and their derived products were denoted as SA-AC-X and CA-AC-X (X = 2, 3 and 4), respectively.
Material characterization
The morphologies were analyzed by using an SUPRA 55 (Carl Zeiss AG, Germany) scanning electron microscope. Charcoals were degassed at 300 °C for 5 hours, and then their pore structures were investigated by nitrogen adsorption–desorption at 77.4 K using a JW-BK132F instrument (Beijing JWGB Sci & Tech Ltd., China). The specific surface areas (denoted as SBET) were calculated by the Brunauer–Emmett–Teller (BET) method with a P/P0 value between 0.10 and 0.25 with nitrogen adsorption data. The total pore volume (denoted as Vtotal) was determined by the amount of nitrogen absorbed at P/P0 = 0.993. The micropore surface areas (denoted as Smicro) and mesopore surface areas (denoted as Smeso) were estimated by the t-plot method with the carbon-black model, using the nitrogen adsorption data with P/P0 in the range of 0.2 to 0.5. The HK method was used to obtain the micropore size distribution, total micropore volume (denoted as Vmicro) and average micropore size (denoted as Dmicro) assuming a slit pore model with nitrogen adsorption data. The BJH method was used to obtain the mesopore size distribution and average mesopore size (denoted as Dmeso).Electrochemical characterization
The capacitive performance was tested on a two-electrode system. A homogeneous mixture of porous carbon, polytetrafluoroethylene (PTFE) and conductive graphite with a mass ratio of 8![[thin space (1/6-em)]](https://www.rsc.org/images/entities/char_2009.gif) :
:![[thin space (1/6-em)]](https://www.rsc.org/images/entities/char_2009.gif) 1
1![[thin space (1/6-em)]](https://www.rsc.org/images/entities/char_2009.gif) :
:![[thin space (1/6-em)]](https://www.rsc.org/images/entities/char_2009.gif) 1 was coated on one side of nickel foam pieces. Those pieces were pressed under 12 MPa for 1 min and dried in a vacuum at 110 °C for 12 h. The mass load of each electrode piece was about 10 mg with a thickness of about 0.1 mm. Two electrode pieces with similar mass loads were assembled in a two-electrode system with 6 M KOH as the electrolyte.
1 was coated on one side of nickel foam pieces. Those pieces were pressed under 12 MPa for 1 min and dried in a vacuum at 110 °C for 12 h. The mass load of each electrode piece was about 10 mg with a thickness of about 0.1 mm. Two electrode pieces with similar mass loads were assembled in a two-electrode system with 6 M KOH as the electrolyte.
The CV, GCD, and EIS were measured on an electrochemical station (CS310H, Wuhan Corrtest Instruments Corp., Ltd., China). The voltage window was set to be 0–1 V. The scan rate was in a range 20–200 mV s−1. GCD test was performed under a current density ranging from 0.1 to 50 A g−1. EIS were collected with frequencies ranging from 105 Hz to 10−3 Hz with an AC amplitude of 5 mV.
Results and discussion
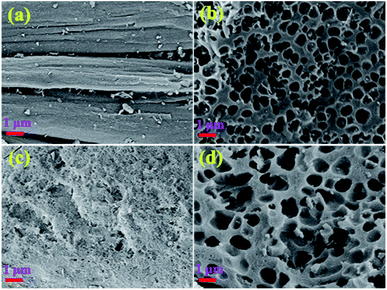
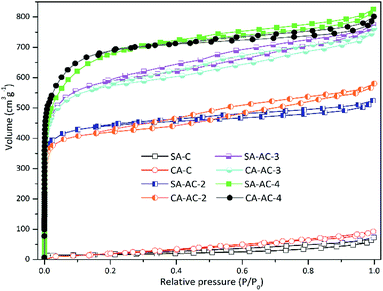
Fig. 1a and b show the SEM images of SA-C and CA-C prepared from SA and CA by simple carbonization under the same conditions, respectively. During the carbonization process, with the enrichment of carbon elements, a carbonized sample composed of many small particles was finally formed. It can be observed that the SA-C particles exhibit plane structure, while the CA-C particles exhibit plane and concave alternately distributed structure, which means that the carbon-forming component (alginic acid) was converted into two carbonized sample with different microstructures under the action of sodium or calcium. Fig. 1c and d show the SEM images of SA-AC-4 and CA-AC-4 prepared from SA-C and CA-C by KOH activation, respectively. During the immersion process, KOH will be attached to the surface of carbon particles, and then the pore structure of particles will be developed as the surface structure was etched. It can be observed that pores are distributed in the plane structure after SA-C activated by KOH, and the surface structure appears to be destroyed by repeated etching; pores are distributed in the plane and concave structures after CA-C activated by KOH, and the surface structure is still well preserved. The different structural characteristics of SA-AC-4 and CA-AC-4 should be caused by the different distributions of the activator on the surface of SA-C and CA-C particles. Besides, after comparing the morphologies, it can be found that porous carbons can inherit structures from their corresponding carbonized samples.Pore structures were characterized by nitrogen adsorption and desorption at 77.4 K. Fig. 2 shows the various stages of the nitrogen adsorption and desorption isotherm curves of the obtained charcoals. All these curves show linear monolayer–multilayer adsorption properties and hysteresis loops, and hysteresis loops are generally considered to be related to the capillary condensation process occurred in mesopores, indicating the presence of mesopores.38–41 Furthermore, it can be noticed that carbonized samples adsorb little nitrogen while porous carbons adsorb a large amount of nitrogen at low pressure, indicating that most of micropores should be created during the KOH activation process.
The different microstructures of carbonized samples cause different distributions of the activator on the surfaces of the carbon particles, which will lead to the formation of different pore structures. Table 1 shows the pore parameters of charcoals. The specific surface areas and total pore volumes increase as the KOH/C ratio increases. The specific surface areas of SA-C-X are larger than those of CA-C-X (X = 2, 3 and 4) at the same KOH/C ratio, and moreover, as the KOH/C ratio increases, the difference values between SA-AC-X and CA-AC-X (X = 2, 3 and 4) are gradually decreasing (69.6 > 22.8 > 22.5, m2 g−1), which indicates that the influence of microstructures of carbonized samples on increasing their specific surface areas during activation process gradually weakens as the KOH/C ratio increases. The total pore volume of SA-C-X is larger than that of CA-C-X (X = 3 and 4) at the same KOH/C ratio, and the difference value is increasing (0.02 < 0.04, cm3 g−1), which indicates that plane structures are more conducive to the pore volume increase than concave structures, and this result should be caused by the formation of micropores with larger pore sizes after repeated etching on the plane structure. As the KOH/C ratio increases, the average micropore sizes of SA-AC-X and CA-AC-X gradually increase; the average mesopore size of SA-AC-X increases first and then decreases, while the average mesopore size of CA-AC-X is gradually decreasing. Based on the pore size variations and the morphology changes shown in Fig. 1, it can be concluded that the generation process of pores in concave structures is more orderly than that in plane structures.
| Sample | SBET | Vtotal | Vmicro | Dmicro | Dmeso | Smicro | Smeso | Smeso/Smicro | Vmicro/Vtotal |
|---|---|---|---|---|---|---|---|---|---|
| m2 g−1 | cm3 g−1 | cm3 g−1 | nm | nm | m2 g−1 | m2 g−1 | |||
| SA-C | 54.9 | 0.11 | 0.023 | 0.38 | 9.60 | 7.5 | 47.4 | 6.32 | 0.2 |
| CA-C | 91.4 | 0.14 | 0.031 | 0.39 | 5.10 | 20.5 | 70.9 | 3.46 | 0.2 |
| SA-AC-2 | 1426.5 | 0.81 | 0.664 | 0.58 | 4.03 | 1284.3 | 142.2 | 0.11 | 0.8 |
| CA-AC-2 | 1356.9 | 0.90 | 0.631 | 0.58 | 4.94 | 1070.8 | 286.1 | 0.27 | 0.7 |
| SA-AC-3 | 1830.0 | 1.20 | 0.886 | 0.61 | 4.45 | 1485.7 | 344.3 | 0.23 | 0.7 |
| CA-AC-3 | 1807.2 | 1.18 | 0.844 | 0.60 | 4.82 | 1458.4 | 348.8 | 0.24 | 0.7 |
| SA-AC-4 | 2226.3 | 1.28 | 0.999 | 0.62 | 3.36 | 1866.5 | 359.8 | 0.19 | 0.8 |
| CA-AC-4 | 2203.8 | 1.24 | 1.032 | 0.61 | 3.71 | 1965.1 | 238.7 | 0.12 | 0.8 |
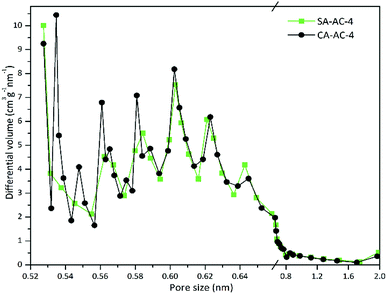
The micropores are mainly created by the etching of the activator, and the surface structures of carbon particles determine the activator's attachment state, which means that the microstructures of the carbonized sample is an important factor determining the micropore size distribution. Fig. 3 and S1† show the micropore size distributions determined by HK method using the adsorption data based on a slit pore model.
It can be observed that the changing trends of the micropore size distributions of SA-AC-X and CA-AC-X (X = 2, 3 and 4) at the same KOH/C ratio are similar, and micropores are mainly distributed below 0.8 nm. Obviously, the positions of extreme points on the micropore size distribution curves are similar, but their corresponding extreme values are different, which should be attributed to the different microstructures of carbonized samples. Besides, new extreme points appear in the curves at larger pore size positions as the KOH/C ratio increases, which may be due to the fact that increasing the KOH/C ratio can cause smaller micropores to transform into larger micropores. Fig. S2† shows the mesopore size distributions determined by BJH method using adsorption data. It can be observed that mesopore size distributions with the KOH/C ratios of 2 and 3 differ a lot, which may be due to the different microstructures of the carbonized samples and lower etching levels, while the trends of mesopore size distributions with the KOH/C ratio of 4 are similar, which indicates that the influence of microstructures of carbonized samples on the mesopore size distributions gradually weakens as the KOH/C ratio increases.
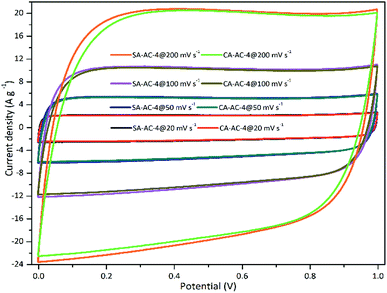
In order to evaluate the capacitive performance, two-electrode symmetrical supercapacitor cells were constructed and measured using 6 M KOH as the electrolyte. Fig. 4 and S3† show the CV curves at various scan rates. These CV curves show rectangular shapes from 0 to 1 V over the test range of scan rates, suggesting that an ideal electrical double layer effect of these tested supercapacitor cells, and small shape distortions can be observed as the scan rate increased from 20 to 200 mV s−1, demonstrating strong charge transporting ability of these charcoals.42–45 The smaller the rectangular shape distortion, the higher the charge transporting ability. Therefore, the magnitude relationship of the charge transporting abilities is: SA-AC-2 > CA-AC-2, SA-AC-3 ≈ CA-AC-3 and SA-AC-4 > CA-AC-4. The larger the area enclosed by the curve, the larger the charge capacity.
Therefore, the magnitude relationship of the charge capacity is: SA-AC-2 > CA-AC-2, SA-AC-3 < CA-AC-3 and SA-AC-4 > CA-AC-4.
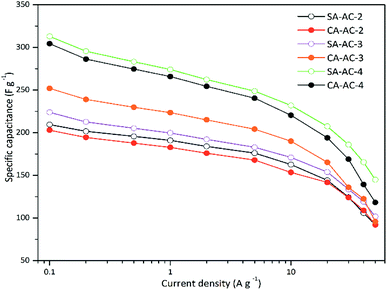
Fig. S4† shows the GCD curves carbons at various current densities. These curves are symmetrical, indicating that every electrode has a good electric double layer effect. The specific capacitances were calculated from the GCD discharge curves by the method as described in previous ref. 46 and 47. The capacitance was shown in Table S1† and SA-AC-4 has the largest capacitance (312.9 F g−1 @ 1 A g−1). It can be noticed that at the same current density, as the KOH/C ratio increases, the specific capacitance increases, which is mainly caused by the increase of effective specific surface areas. When the KOH/C ratios are 2 and 4, the specific capacitance of SA-AC-X is larger than that of CA-AC-X, and when the KOH/C ratio is 3, the specific capacitance of SA-AC-X is less than that of CA-AC-X, which is mainly caused by their different pore size distributions.
Fig. 5 shows the rate performance curves. Overall, the trends of these curves are similar. When the current density is less than 10 A g−1, the specific capacitance exhibits a similar and slower decay as the current density increases; when the current density is larger than 10 A g−1, the specific capacitance exhibits a rapid decay as the current density increases. In addition, it can be noticed that when the KOH/C ratios are 2 and 3, there is no significant difference in the rate performance of SA-AC-X and CA-AC-X, while when the KOH/C ratio is 4, the rate performance of SA-AC-X is slightly better than that of CA-AC-X.
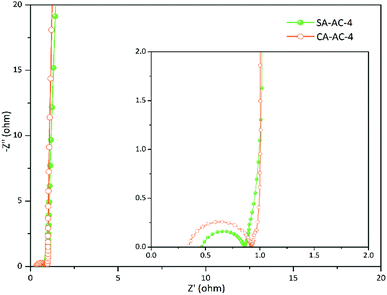
Fig. 6 and S5† show the Nyquist plots for charcoals. These curves are vertical at low frequencies, indicating ideal capacitive properties of these supercapacitor cells. There are no semi-circles in the Nyquist curves of SA-AC-X and CA-AC-X (X = 2 and 3), indicating that the charge transfer rates in these charcoals are very fast, while there are semi-circles in the curves of SA-AC-4 and CA-AC-4, indicating that there is charge transfer resistance. Obviously, the transition domain in the Nyquist curve of SA-AC-4 is shorter than that in the Nyquist curve of CA-AC-4, indicating that the charge transfer resistance in SA-AC-4 caused by the electrolyte penetration into the pores is much smaller than that in CA-AC-4.
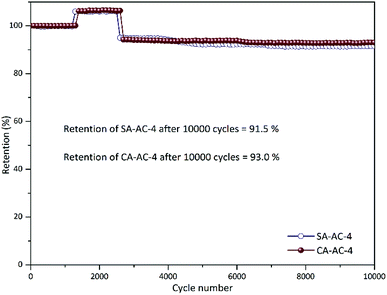
Fig. 7 and S6† shows the cycle performance curves at the current density of 5 A g−1 for 10![[thin space (1/6-em)]](https://www.rsc.org/images/entities/char_2009.gif) 000 cycles in 6 M KOH. All these curves present three similar stages. When these curves change from the first stage to the second stage, the capacitance becomes larger, which may be due to the pores in these charcoals being effectively utilized after a certain number of cycles; when these curves change from the second stage to the third stage, the capacitance becomes smaller, which may be due to the increase in charge transfer resistance after a large number of cycles. It can be observed that when the KOH/C ratios are the same, the cycle numbers of different charcoals corresponding to the same stage are similar, but when the KOH/C ratios are different, the cycle numbers of different charcoals corresponding to the same stage differ a lot, which can be attributed to the different etching levels under different KOH/C ratios. In addition, it can be noticed that SA-AC-X and CA-AC-X (X = 2, 3 and 4) have no significant difference in cycle performance, which is mainly due to the fact that the charge and discharge processes in the electrodes are almost performed by highly reversible electric double layer processes.
000 cycles in 6 M KOH. All these curves present three similar stages. When these curves change from the first stage to the second stage, the capacitance becomes larger, which may be due to the pores in these charcoals being effectively utilized after a certain number of cycles; when these curves change from the second stage to the third stage, the capacitance becomes smaller, which may be due to the increase in charge transfer resistance after a large number of cycles. It can be observed that when the KOH/C ratios are the same, the cycle numbers of different charcoals corresponding to the same stage are similar, but when the KOH/C ratios are different, the cycle numbers of different charcoals corresponding to the same stage differ a lot, which can be attributed to the different etching levels under different KOH/C ratios. In addition, it can be noticed that SA-AC-X and CA-AC-X (X = 2, 3 and 4) have no significant difference in cycle performance, which is mainly due to the fact that the charge and discharge processes in the electrodes are almost performed by highly reversible electric double layer processes.
Conclusions
In this study, two carbonized samples with different microstructures were prepared from sodium alginate and calcium alginate by simple carbonization, and six porous carbons were obtained by KOH activation. The results of SEM images show that under the effect of sodium or calcium, carbonized samples derived from alginic acid present respectively plane structure or concave structure. Pore properties of charcoals indicate that the influence of microstructures of carbonized samples on increasing their specific surface areas during activation process gradually weakens as the KOH/C ratio increases, and the generation process of pores in concave structures is more orderly than that in plane structures. Micropore size distributions demonstrate that increasing the KOH/C ratio, smaller micropores can be transformed into larger micropores, which leads to new extreme points appearing in the curves at larger pore size positions. In terms of electrochemical performance, the specific capacitance of CA-AC-4 is the largest, which is due to its large specific surface areas and excellent pore size distribution, and the charge transfer resistance in SA-AC-4 is smaller, which should be attributed to its higher ratio of mesopore specific surface areas to micropore specific surface areas.Conflicts of interest
There are no conflicts to declare.Acknowledgements
This work was supported by Natural Science Foundation of Shandong, China (ZR2017MEE010), and the Fundamental Research Funds of Shandong University (2016JC005).Notes and references
- M. Y. Song, Y. H. Zhou, X. Ren, J. F. Wan, Y. Y. Du, G. Wu and F. W. Ma, J. Colloid Interface Sci., 2019, 535, 276–286 CrossRef CAS PubMed.
- Y. Zhu, T. T. Fang, J. Q. Hua, S. J. Qiu, H. L. Chu, Y. J. Zou, C. L. Xiang, P. R. Huang, K. X. Zhang, X. C. Lin, E. H. Yan, H. Z. Zhang, F. Xu, L. X. Sun and J. L. Zeng, Chemistryselect, 2019, 4, 7358–7365 CrossRef CAS.
- S. J. Li, K. H. Han, J. X. Li, M. Li and C. M. Lu, Microporous Mesoporous Mater., 2017, 243, 291–300 CrossRef CAS.
- W. Yang, W. Yang, A. L. Song, G. Sun and G. J. Shao, Nanoscale, 2018, 10, 816–824 RSC.
- L. L. Zhang, X. Zhao, M. D. Stoller, Y. W. Zhu, H. X. Ji, S. Murali, Y. P. Wu, S. Perales, B. Clevenger and R. S. Ruoff, Nano Lett., 2012, 12, 1806–1812 CrossRef CAS PubMed.
- L. Yao, Q. Wu, P. X. Zhang, J. M. Zhang, D. R. Wang, Y. L. Li, X. Z. Ren, H. W. Mi, L. B. Deng and Z. J. Zheng, Adv. Mater., 2018, 30, 1706054 CrossRef PubMed.
- X. L. Su, J. R. Chen, G. P. Zheng, J. H. Yang, X. X. Guan, P. Liu and X. C. Zheng, Appl. Surf. Sci., 2018, 436, 327–336 CrossRef CAS.
- K. Wang, S. Z. Zhou, Y. T. Zhou, J. Ren, L. W. Li and Y. Lan, Int. J. Electrochem. Sci., 2018, 13, 10766–10773 Search PubMed.
- Z. J. Li, W. Lv, C. Zhang, B. H. Li, F. Y. Kang and Q. H. Yang, Carbon, 2015, 92, 11–14 CrossRef CAS.
- T. T. Liu, Y. Li, N. N. Peng, Q. Q. Lang, Y. Xia, C. Gai, Q. F. Zheng and Z. G. Liu, J. Environ. Manage., 2017, 197, 151–158 CrossRef CAS PubMed.
- I. I. G. Inal, S. M. Holmes, E. Yagmur, N. Ermumcu, A. Banford and Z. Aktas, J. Ind. Eng. Chem., 2018, 61, 124–132 CrossRef.
- C. M. Ashraf, K. M. Anilkumar, B. Jinisha, M. Manoj, V. S. Pradeep and S. Jayalekshmi, J. Electrochem. Soc., 2018, 165, A900–A909 CrossRef CAS.
- Z. H. Chen, X. W. Peng, X. T. Zhang, S. S. Jing, L. X. Zhong and R. C. Sun, Carbohydr. Polym., 2017, 170, 107–116 CrossRef CAS.
- J. N. Yi, Y. Qing, C. T. Wu, Y. X. Zeng, Y. Q. Wu, X. H. Lu and Y. X. Tong, J. Power Sources, 2017, 351, 130–137 CrossRef CAS.
- D. L. He, W. Zhao, P. Li, S. Sun, Q. W. Tan, K. Han, L. Liu, L. Liu and X. H. Qu, J. Alloys Compd., 2019, 773, 11–20 CrossRef CAS.
- P. S. Yang, L. Ma, M. Y. Gan, Y. Lei, X. L. Zhang, M. Jin and G. Fu, J. Mater. Sci. Mater. Electron., 2017, 28, 7333–7342 CrossRef CAS.
- J. Guo, D. L. Wu, T. Wang and Y. Ma, Appl. Surf. Sci., 2019, 475, 56–66 CrossRef CAS.
- J. T. Jin, P. Jiang, X. C. Qiao, W. L. Wan, X. W. Ren and L. F. Cui, J. Alloys Compd., 2019, 803, 704–710 CrossRef CAS.
- J. H. Xu, W. L. Zhang, D. X. Hou, W. M. Huang and H. B. Lin, Chin. Chem. Lett., 2017, 28, 2295–2297 CrossRef CAS.
- Z. J. Sun, W. J. Wang, J. M. Zhang, G. C. Wang, K. Wang, X. W. Liu, G. Ni and Y. Jiang, New J. Chem., 2019, 43, 1864–1873 RSC.
- Q. Li, Y. H. Li, X. M. Ma, Q. J. Du, K. Y. Sui, D. C. Wang, C. P. Wang, H. L. Li and Y. Z. Xia, Chem. Eng. J., 2017, 316, 623–630 CrossRef CAS.
- Y. Yamashita and K. Ouchi, Carbon, 1982, 20, 41–45 CrossRef CAS.
- S. V. Vassilev, C. G. Vassileva and V. S. Vassilev, Fuel, 2015, 158, 330–350 CrossRef CAS.
- S. V. Vassilev, D. Baxter, L. K. Andersen and C. G. Vassileva, Fuel, 2010, 89, 913–933 CrossRef CAS.
- B. Godin, S. Lamaudiere, R. Agneessens, T. Schmit, J. P. Goffart, D. Stilmant, P. A. Gerin and J. Delcarte, Energy Fuels, 2013, 27, 2588–2598 CrossRef CAS.
- H. Rabemanolontsoa and S. Saka, RSC Adv., 2013, 3, 3946–3956 RSC.
- M. M. Wang, K. H. Han, J. H. Qi, J. X. Li, Z. C. Teng and M. Li, J. Mater. Sci., 2019, 54, 14085–14101 CrossRef CAS.
- Q. C. Fan, C. Ma, L. Q. Wu, C. B. Wei, H. H. Wang, Y. Song and J. L. Shi, RSC Adv., 2019, 9, 6419–6428 RSC.
- D. L. Vu, J. S. Seo, H. Y. Lee and J. W. Lee, RSC Adv., 2017, 7, 4144–4151 RSC.
- H. M. Lee, H. G. Kim, K. H. An and B. J. Kim, J. Nanosci. Nanotechnol., 2015, 15, 8797–8802 CrossRef CAS PubMed.
- K. S. K. Reddy, A. Al Shoaibi and C. Srinivasakannan, N. Carbon Mater., 2012, 27, 344–351 CrossRef CAS.
- M. B. Wu, Q. F. Zha, J. S. Qiu, X. Han, Y. S. Guo, Z. F. Li, A. J. Yuan and X. Sun, Fuel, 2005, 84, 1992–1997 CrossRef CAS.
- J. X. Li, Y. Gao, K. H. Han, J. H. Qi, M. Li and Z. C. Teng, Sci. Rep., 2019, 9, 17270 CrossRef PubMed.
- Z. C. Teng, K. H. Han, J. X. Li, Y. Gao, M. Li and T. T. Ji, Ultrason. Sonochem., 2019, 60, 104756 CrossRef.
- J. M. Lee, M. E. Briggs, T. Hasell and A. I. Cooper, Adv. Mater., 2016, 28, 9804–9810 CrossRef CAS.
- X. L. Wu, L. L. Chen, S. Xin, Y. X. Yin, Y. G. Guo, Q. S. Kong and Y. Z. Xia, Chemsuschem, 2010, 3, 703–707 CrossRef CAS PubMed.
- Y. Fan, P. F. Liu, Z. Y. Huang, T. W. Jiang, K. L. Yao and R. Han, J. Power Sources, 2015, 280, 30–38 CrossRef CAS.
- Y. L. Deng, Y. J. Ji, H. M. Wu and F. Chen, Chem. Commun., 2019, 55, 1486–1489 RSC.
- C. J. Xuan, Z. K. Peng, J. Wang, W. Lei, K. D. Xia, Z. X. Wu, W. P. Xiao and D. L. Wang, Chin. Chem. Lett., 2017, 28, 2227–2230 CrossRef CAS.
- F. Shen, M. Qiu, Y. H. Hua and X. H. Qi, Chemistryselect, 2018, 3, 586–591 CrossRef CAS.
- L. Fang, Y. P. Xie, Y. Y. Wang, Z. W. Zhang, P. F. Liu, N. A. Cheng, J. F. Liu, Y. C. Tu, H. B. Zhao and J. J. Zhang, Appl. Surf. Sci., 2019, 464, 479–487 CrossRef CAS.
- Y. J. Wang, L. C. Zhao, H. Peng, X. W. Dai, X. N. Liu, G. F. Ma and Z. Q. Lei, Ionics, 2019, 25, 4315–4323 CrossRef CAS.
- W. M. Chen, X. Wang, M. Feizbakhshan, C. Z. Liu, S. Hong, P. Yang and X. Y. Zhou, J. Colloid Interface Sci., 2019, 540, 524–534 CrossRef CAS PubMed.
- C. F. Cheng, S. J. He, C. M. Zhang, C. Du and W. Chen, Electrochim. Acta, 2018, 290, 98–108 CrossRef CAS.
- G. X. Huang, Q. H. Geng, W. W. Kang, Y. B. Liu, Y. Y. Li, B. L. Xing, Q. R. Liu and C. X. Zhang, Microporous Mesoporous Mater., 2019, 288, 109576 CrossRef CAS.
- J. X. Li, K. H. Han and S. J. Li, J. Mater. Sci. Mater. Electron., 2018, 29, 8480–8491 CrossRef CAS.
- Q. Zhang, K. H. Han, S. J. Li, M. Li, J. X. Li and K. Ren, Nanoscale, 2018, 10, 2427–2437 RSC.
Footnote |
| † Electronic supplementary information (ESI) available. See DOI: 10.1039/c9ra09317f |
| This journal is © The Royal Society of Chemistry 2020 |

