 Open Access Article
Analytical modeling framework for performance degradation of PEM fuel cells during startup–shutdown cycles†
Yunqi Liab,
Xiran Chenab,
Yuwei Liuab,
Danping Xiongab,
Jing Liab,
Sha Yin ab,
Liang Chenc,
Congxin Lic and
Jun Xu
 *de
*de
aDepartment of Automotive Engineering, School of Transportation Science and Engineering, Beihang University, Beijing, 100191, China
bVehicle Energy & Safety Laboratory (VESL), Beihang University, Beijing, 100191, China
cBeijing New Energy Vehicle Technology Innovation Center Co.,Ltd, Beijing 100176, China
dDepartment of Mechanical Engineering and Engineering Science, The University of North Carolina at Charlotte, Charlotte, NC 28223, USA. E-mail: jun.xu@uncc.edu
eNorth Carolina Motorsports and Automotive Research Center, The University of North Carolina at Charlotte, Charlotte, NC 28223, USA
First published on 13th January 2020
Abstract
Startup–shutdown cycling is one of the main factors that contribute to fuel cell deterioration related to high cathode potential. In this study, a coupled model with the carbon corrosion model and agglomerate model of the cathode catalyst layer is built to predict performance degradation during startup–shutdown cycles. The carbon corrosion model calculates the carbon loading loss through the rate equations and material balance expressions of seven reactions, while the agglomerate model describes the catalyst layer performance according to the computed structural parameters. A set of operational and structural parametric studies are used to investigate their effects on initial performance and voltage degradation rate. The maximum voltage of the cyclic load is found to have a greater influence over the voltage degradation rate compared with relative humidity, pressure, and minimum voltage of the cyclic load. Among the structural parameters, the carbon loading and platinum loading have the greatest and least impact on voltage degradation rate, respectively, while ionomer fraction has a complex and nonmonotonic effect. An optimal design strategy is provided with a case demonstration. Results may provide a fundamental and important tool for degradation prediction in startup–shutdown conditions and guidance for catalyst layer design and operation.
1 Introduction
Faced with environmental pollution and resource shortage, the proton exchange membrane fuel cell (PEMFC) has considerable potential as an alternative to the traditional internal combustion engine1 due to its high energy density, high efficiency, and theoretically zero emission.2 In addition, FC is more reliable than lithium batteries which have many safety issues.3 However, the widespread marketing of FC generators in vehicles still faces two major bottlenecks: cost and durability. According to the roadmap of the U.S. Department of Energy, the lifetime of commercial PEMFCs needs to reach 8000 h by 2025.4 The challenge of PEMFC durability is the complex operating conditions of vehicles, including speed change, startup and shutdown, idling, and high power. Frequent startup and shutdown cycling contributes 33% to the degradation of PEMFC.5 This process causes an instantaneous condition and local potential in the catalyst layer (CL) can reach up to 1.5 V, which is abnormal in FC operations. Two critical issues in CL exist under this condition, namely, degradation mechanism and performance characterization, and they are investigated through experiment and simulation.As shown in Fig. 1a, startup and shutdown cycles are represented normally in literature6–10 by a triangle wave voltage between 1 and 1.5 VRHE with a sweep rate of 500 mV s−1 to investigate its degradation mechanisms and phenomena. Carbon corrosion during cyclic startup and shutdown can lead to the collapse of porous structure and reduction of material transport capacity11 (see Fig. 1b), the increase in platinum particles, and reduced electrochemical surface area (ECSA).6,12,13 After an extended shutdown, a small amount of oxygen will appear at both electrodes due to pressure and sealing problems. Once FCs start working, hydrogen enters the anode channel, resulting in a hydrogen/oxygen interface. Takagi et al.14 reported that the excessive cathode potential and carbon corrosion are mainly caused by the formation of hydrogen/oxygen interface under the startup–shutdown cycles.
Several models were proposed to explore the carbon corrosion mechanisms because an experiment would be costly and time-consuming. Meyers and Darling15 developed a 1D model of carbon corrosion in both steady-state and transient operation. Findings indicate that hydrogen maldistribution leads to oxygen evolution and carbon corrosion on the cathode. Uniform distribution of fuel and control of cathode potential can relieve degradation during startup–shutdown conditions. A more comprehensive model considering the reactions of platinum and their effect on carbon corrosion was developed by Chen et al.16 The effect of initial platinum state at the anode and cathode, temperature, and anode oxygen diffusivity was studied. A set of two-dimensional models17–19 were developed to take into consideration the difference of current density along the thickness direction. Carbon corrosion can reportedly be mitigated only by optimizing the catalyst. Other models focus solely on electrochemical reactions of the carbon support. Gallagher and Fuller20 proposed an electrochemical mechanism and numerical model for graphitized carbon. According to their study, carbon mass loss and surface oxide growth over time can be predicted. Their findings also indicate that three mechanisms contribute to current decay during electrochemical oxidation: carbon loss due to CO2 formation, reversible formation of a passive oxide, and irreversible formation of another oxide.
Another issue is the description of CL structure and simulation of CL performance. Models for the cathode CL can be classified into three categories according to their different complexity:21 interface models, homogeneous models, and agglomerate models (see Fig. 1c). Among them, the agglomerate model, which shows the best match with experimental data,22 has been used more often to study the related issues of CL in recent years.23–26 Moein-Jahromi et al.21 used the agglomerate model to simulate the CL, and the results were compared with those of the homogeneous one. A set of parametric studies were performed, in which the agglomerate size was found to be the most influential parameter. Ismail et al.26 studied the influence of the shape of agglomerates and found that slight changes in structure can substantially improve fuel cell performance.
Carbon corrosion models focus on reactions and its influencing factors and the strategy for mitigating corrosion, while agglomerate models provide ways to calculate performance. In automobile startup–shutdown operations, a sequential relationship exists between carbon corrosion and performance degradation. However, models for establishing this connection are still lacking at present. Thus, this study aims to fill this gap to provide useful guidance for the better understanding of FC performance in automobiles.
In this study, the carbon corrosion model and CL agglomerate model are combined to predict the performance of CL during startup–shutdown cycles. Both models were validated versus experimental data from literature. A parametric study was presented to analyze the effect of operation condition (e.g., relative humidity [RH], pressure, and maximum and minimum voltage) and structural parameters (e.g., carbon loading, platinum loading, and ionomer fraction) in the agglomerate model on the initial performance and voltage degradation rate (VDR) at various numbers of cycles.
2 Methods
2.1 Carbon corrosion model
The electrochemical oxidation of carbon comprises seven reactions with the individual kinetic equation from eqn 1–7 in Table 1 with the basic framework adopted from ref. 14 and 20. θab represents the coverage of species b on site a. x is the stoichiometric number fitted by Gallagher et al.20 V is the electrode potential. g is a Frumkin factor that describes the change in activation energy when oxide coverage differs.According to this model, carbon mass loss and surface oxide growth over time under different temperatures and potential conditions can be predicted.
 | (8) |
2.2 Agglomerate model of the catalyst layer
The agglomerate model of the cathode CL in this study is based on the following assumptions:• The model is one-dimensional and under steady state.
• The reaction condition is isothermal and isobaric.
• The reaction gasses are regarded as ideal.
• Void spaces in the CL are filled by liquid water.
• The agglomerate particles are spherical in shape with identical diameters.
Key processes and equations are introduced as follows, while other expressions of parameters are shown in Table 3.
| Parameters | Expressions | Ref. |
|---|---|---|
| Oxygen diffusion coefficient in liquid water, DO2,w |  |
21 |
Effective oxygen diffusion coefficient in agglomerate,  |
DO2,i L1.5i,agg | 21 |
| Thiele modulus, ϕL |  |
29 |
| Reaction effectiveness factor, Er |  |
29 |
| Local water content of the ionomer phase, λ | 0.3 + 10.8 RH − 16RH2 + 14.1 RH3 | 29 |
| Protonic conductivity, κl |  |
29 |
| Effective protonic conductivity, κeffl | κlL1.5l | 22 |
| Effective electronic conductivity, κeffs | κsL1.5Pt/C | 22 |
| Reversible potential of the reaction of hydrogen and oxygen, Erev | 1.229 − 0.85 × 10⁻³ (T − 298.15) + 4.31 × 10⁻⁵ T[ln(χH2P) + 0.5![[thin space (1/6-em)]](https://www.rsc.org/images/entities/char_2009.gif) ln(χO2P)] ln(χO2P)] |
22 |
| Reversible potential of Pt decomposition reaction, Erev,Pt | 1.188 + 3.2376 × 10⁻⁴ (T − 298) | 30 |
 | (15) |
 is the effective oxygen diffusion coefficient within an agglomerate particle. The penetrated oxygen flux into the ionomer film covering the agglomerate can be calculated by the following equation:29
 | (16) |
 | (17) |
| Ragg = −ErkcCO2,i|s | (18) |
 | (19) |
 | (20) |
Combined with eqn (16), (17), and (19), we can write CO2,i|s in terms of CO2,g|i. Thus, the current density gradient is obtained as follows:
 | (21) |
On the other hand, the current density in homogeneous view can be described by the Butler–Volmer equation:31
 | (22) |
 is the reference oxygen concentration. αa and αc are anodic and cathodic transfer coefficient respectively. The homogeneous model can be also retrieved from eqn (21) when ragg and δagg tend to 0:
 | (23) |
Therefore, kc can be expressed according to eqn (22) and (23)
 | (24) |
 | (25) |
| Ucell = Erev − ηlocal − ROhmItot | (26) |
 | (27) |
 is the effective diffusion coefficient of oxygen. According to the assumption that the void spaces are filled by liquid water, oxygen can diffuse to the surface of the agglomerate by two routes: within the void spaces flooded by water and ionomer phase. The detailed derivation process of
  is presented in ESI.†
 | (28) |
| i|z=0 = 0 | (29) |
At z = tcl, the current density is equal to the total cell current density
| i|z=tcl = Itot | (30) |
2.3 Agglomerate radius and electrochemical surface area
According to Ostwald ripening theories, platinum particles undergo the process of dissolution (Pt ⇌ Pt2+ + 2e−) and redeposition (Pt2+ + 2e− → Pt), which are driven by the tendency to decrease in total surface free energy.33 Consequently, large particles grow at the expense of dissolution of the smaller ones, leading to the increase in the mean radius of platinum particles and the decrease of the particle number. The coarsening of platinum particles34,35 can be written as
 | (31) |
 | (32) |
The exchange current density is calculated based on the effective catalyst surface area aeff, which is expressed by the platinum loading and ECSA
 | (33) |
The electrochemical surface area has a great influence on the performance of the CL. Thus, its attenuation under startup–shutdown cycles needs to be reasonably quantified. In this study, ECSA at any time is calculated based on the radius of the Pt particle
 | (34) |
The agglomerate radius also changes with the potential cycles, which can be related to the radius of the platinum particles. The radius of the agglomerate for degraded CL can be expressed as:35
 | (35) |
2.4 Computation strategy
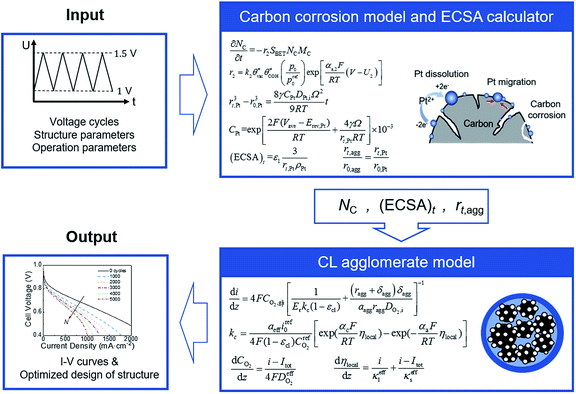
A coupled carbon corrosion–CL model that considers the influence of carbon corrosion behavior to the structure change of CL was developed to evaluate the effect of the transient operation condition and main parameters of CL. Fig. 2 introduces the detailed solution procedure of the modeling framework built in this study. The initial value of the agglomerate radius, r0,agg, and the thickness of the ionomer film covering an agglomerate, δ0,agg, are determined by adjusting them until the output results of the agglomerate model comply with the results of experiments. Afterwards, ECSA, the radius of the agglomerate, and structural parameters after N startup–shutdown cycles are calculated to be the input of agglomerate model. Finally, the governing equations in agglomerate model are solved to obtain the performance of degraded CL.The carbon corrosion model is used to calculate the loss of mass loading per area of the cathode under different operating conditions and structure parameters. Based on the detachment of Pt particles6 and collapse of porous structure11 caused by carbon corrosion, the platinum loading and volume of void space were assumed to decrease proportionally to the carbon load loss for the sake of simplicity. Meanwhile, the ECSA and radius of agglomerate during voltage cycles are obtained according to eqn (34) and (35), respectively, in Section 2.3. The agglomerate model of CL is a performance calculator to obtain the distribution of overpotential, current density, and other parameters. The model establishes the relationship between structural parameters and performance.
3 Results and discussion
3.1 Model validation
In this study, the modeling framework for degradation prediction consists of the carbon corrosion model and the agglomerate model. To have a more rigorous validation process and take the advantage of available test data, two separate experiments from previous literatures will be used to validate two sub-models respectively. In addition, the experimental results of 1000 and 2000 cycles are used to validate the coupled model considering the possible synergies between the two sub-models.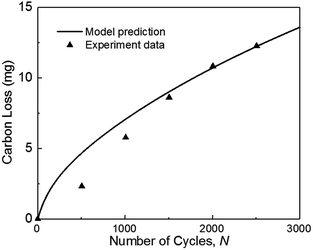 | ||
| Fig. 3 Validation of carbon mass loss with experiments of ref. 36 during square-wave potential cycles between 1 and 1.5 VRHE with a rest time of 5 s at each potential. (operation condition: T = 70 °C, P = 1.5 atm, RH = 100%). | ||
Fig. 3 also indicates that the model result is larger than the experimental data when the number of cycles N is smaller than 1500. As the number of cycles increases, the predicted carbon loss follows the experimental results. This situation probably occurred because the complex reactions of carbon corrosion in the experiment require a transition time for reaction species intake and exhaust, thereby causing the experimental results to be smaller initially. In the experiment, the mass of carbon loss was calculated from the detected concentration of CO2 measured by non-dispersive infrared spectroscopy (NDIR). The detection of gas is lagging the degradation test (see Fig. 14(a) in ref. 9 and Fig. 6 in ref. 37), but this deviation is not considered in the model, which leads to the simulation results being larger than the experimental results at the beginning.
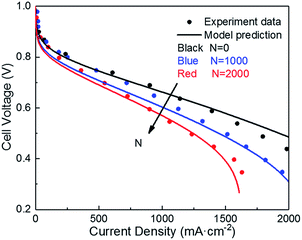 | ||
| Fig. 4 Validation of polarization curve with experiments of ref. 9 during the potential cycling between 1 and 1.5 VRHE with a sweep rate of 500 mV s−1 (operating conditions: T = 80 °C, P = 1 atm, RH = 100%). | ||
3.2 Effect of operating conditions
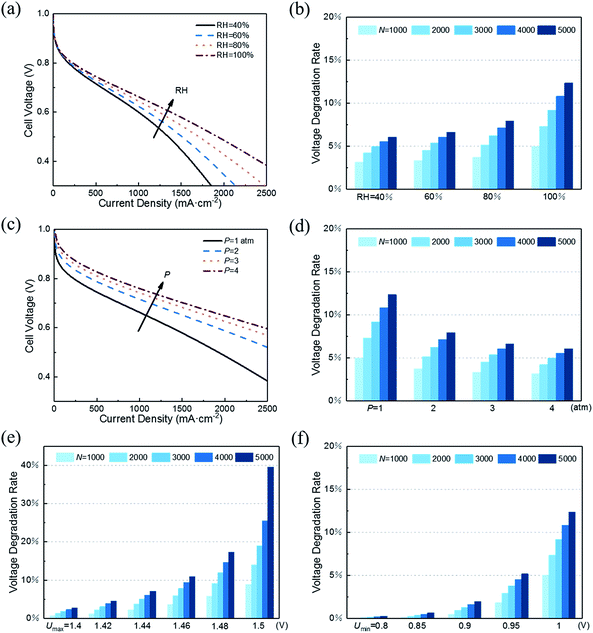
With decreasing RH, the water content of the proton exchange membrane reduces, leading to reduced protonic conductivity of the membrane phase. As shown in Fig. 5a, a small RH corresponds to poor initial performance of CL. However, RH has the opposite effect on performance degradation under startup–shutdown cycles. As shown in Fig. 5b, increasing RH will increase the VDR. In the carbon corrosion model, RH affects the parameter p0 (see eqn 2). An increase in RH accelerates the carbon corrosion reaction rate, resulting in increased performance losses. Similar conclusions can be found in the article by Takeuchi et al.14 Therefore, RH is an important parameter for controlling performance and VDR. A PEMFC needs to work at an optimal value of RH. In addition, in the actual situation, a low RH causes the proton exchange membrane to be insufficiently wetted, resulting in a large increase in membrane resistance and contact resistance, which is not considered in this model.
As for performance degradation, pressure does not affect carbon corrosion in this study. The different results shown in Fig. 5d indicate that the initial performance vary under different pressures while the voltage loss is the same.
As shown in Fig. 5e, the maximum voltage Umax has a great influence on VDR. The slight decrease in Umax causes VDR to drop sharply. The same influence trend was also proposed in the research of Dhanushkodi et al.36 When PEMFC starts and stops, the generated hydrogen–oxygen interface causes the cathode to suffer from an abnormally high potential of about 1.5 V. As Umax decreases, the rate of carbon corrosion reactions decreases exponentially. Moreover, the increase in the radius of platinum particles will reduce the ECSA and increase the radius of the aggregates, which will decrease the CL performance. The increase rate of the platinum particle radius decreases with the reduction of Umax. The combination of the above two points results in slow performance degradation as Umax decreases.
Fig. 5f illustrates that reducing Umin can also reduce performance degradation. The same reason is that its decrease reduces carbon corrosion and slows the growth of platinum particle radius. Similarly, in the study of Gallagher et al.,20 the carbon corrosion caused by lower voltage is weaker.
3.3 Effect of structural parameters
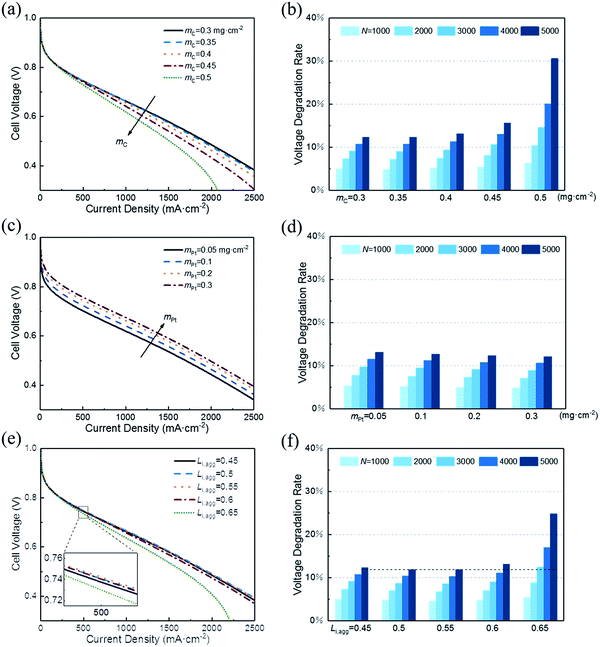
In this section, a parametric study is performed to provide guidance for the optimum design of CL expected to possess both excellent initial performance and resistance to degradation. Therefore, the effect of following key structural parameters on initial voltage and VDR are studied: (1) carbon loading, mC; (2) platinum loading, mPt; (3) ionomer fraction in agglomerate, Li,agg.Fig. 6a shows that the initial performance decreases with the increase in carbon loading when other parameters are fixed. The increase in carbon loading leads to the increase in solid phase (Pt/C) and the reduction in CL porosity. As a result, electronic conductivity increases and the diffusion coefficient of oxygen decreases. Their net effect is a lower cell voltage at different current density. Moreover, the polarization curves corresponding to 0.3 and 0.35 mg cm−2 are close to overlap. This finding suggests that excessive reduction of carbon loading has little effect on performance.
In addition, small porosity of the CL corresponds to a great impact when recession occurs. Fig. 6b illustrates that the VDR after different startup–shutdown cycles increases as the carbon loading increases. This condition occurs because the CL with low porosity is more likely to produce closed pores, resulting in a high resistance of oxygen transport. Notably, the VDR for cases of 0.3 and 0.35 mg cm−2 are almost the same.
In addition, the effective platinum surface area per unit CL volume increases with increased platinum loading. Therefore, the ORR rate increases and hence enhances the performance. Likewise, increasing platinum load continuously has less impact on performance improvement, as shown in Fig. 6c. When platinum loading changes from 0.1 to 0.2 mg cm−2, the voltage at 500 mA cm−2 increases by 22 mV, while from 0.2 to 0.3 mg cm−2, the value is 12 mV. This result indicates that boosting performance by increasing platinum load is not optimal when considering the cost. Cho et al.39 and Khajeh-Hosseini-Dalasm et al.22 have made similar conclusions.
As shown in Fig. 6d, the VDR decreased slightly with the increase in platinum loading. Actually, the voltage loss of different platinum loading has little difference. The difference in initial voltage is what causes VDR to vary. The VDR of 0.05 and 0.3 mg cm−2 after 5000 cycles is 13.17% and 12.13%, respectively. Compared with the data in Fig. 6a, the effect of platinum loading on voltage loss is less sensitive than carbon loading.
A rise in the cell voltage at 500 mA cm−2 is observed when Li,agg is increased from 0.45 to 0.5. As its value continues to increase, the voltage drops back to a level that is much lower than in the case of 0.45. The simulation of Srinivasarao et al. obtained similar results.40 The influence of ionomer fraction on the performance has positive and negative effects; with the increase in ionomer fraction, the proton transfer capacity of CL is improved. However, the high ionomer fraction can lead to water affinity of the electrode, which prevents the reaction gas from reaching the active site of the catalyst and causes the water produced by the cathode to be discharged, thus reducing the utilization rate of platinum and causing the electrode to be flooded. In addition, excessive ionomer fraction increases the electron transfer resistance and oxygen diffusion resistance of CL.
The effect of Li,agg on VDR during cycles is shown in Fig. 6f. Similar to the initial performance, the VDR decreases first and then increases with increasing Li,agg. The protonic resistance of CLs with higher ionomer fraction increases more slowly than that of CLs with lower ionomer fraction.41 However, high ionomer fraction results in less porosity, making CLs more likely to produce closed pores, which then leads to the higher resistance of oxygen transport and more serious degradation of performance.
3.4 Design of CL structural parameters
In the parametric study, a variable is changed within a range by keeping other parameters constant. However, the optimum value of each variable is supposed to vary with changes in the other structural parameters. Therefore, cases of different combinations of parameters are performed for integrated optimum design of CL. As shown in Fig. 7, the initial performance and resistance of degradation are described by the initial voltage U0 and the normalized voltage U′/U0, respectively. U0 and U′ are the voltage at 500 mA cm−2 of pristine CL and degraded CL after 5000 cycles, respectively.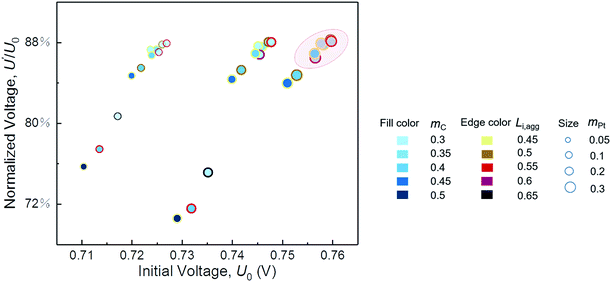 | ||
| Fig. 7 Performance and degradation comparison of different combinations of parameters. The normalized voltage is the ratio of degraded voltage to initial voltage at a current density of 500 mA cm−2. | ||
We expect to prepare CL with both excellent initial performance and resistance to degradation. Fig. 7 indicates that, regardless of cost, a satisfactory CL requires proper ionomer fraction, low carbon loading, and high platinum loading within the range of our parametric study. If the structure parameters of CL are in circle range, then its performance and ability to resist degradation will be satisfactory. Furthermore, the optimal value of the ionomer fraction in agglomerate depends on the values of carbon loading and platinum loading. In this study, the parameters of the best CL are mC = 0.3 mg cm−2, mPt = 0.3 mg cm−2, and Li,agg = 0.55. Table 4 shows the comparison of the model results with the optimization parameters in some literatures. The model predicts the optimal structural parameters well. It should be noted that the Nafion content Li of this study is calculated by Li,agg (see eqn S5† for specific calculation). What's more, few factors can be studied in a single experiment limited by time and cost. Simulation work of this study just makes up for this shortcoming.
4 Conclusions
In this study, an analytical modeling framework is established to predict the performance degradation of cathode CL during startup–shutdown cycles. The carbon corrosion model, together with assumptions that the platinum loading and volume of void space decrease proportionally to the carbon load loss, is used to calculate the changes in structural parameters. The ECSA is calculated by its relation with platinum radius. The output of structural parameters and ECSA is then used in the agglomerate model to predict the performance of CL after any number of cycles. The results of the model match well with the experimental data. After model validation, the effect of several operational and structural parameters is investigated in a parametric study. The operating parameters include RH, pressure, and maximum and minimum voltage of the cyclic load, while structural parameters cover carbon loading, platinum loading, and ionomer fraction in agglomerate. On the basis of this work, the following conclusions can be made:• Increasing gas pressure can improve CL performance and reduce VDR due to the increase in oxygen supply concentration. A suitable value of RH is required in practical operation. Higher maximum voltage and minimum voltage of the cyclic load lead to more significant performance degradation.
• Low carbon loading and high platinum loading can increase initial performance and decrease VDR in general. However, their influence is weak when the carbon loading is smaller than 0.4 mg cm−2 and the platinum loading is higher than 0.2 mg cm−2.
• Degradation forecast of CL performance during startup–shutdown cycles and guidance for the optimal design of CL can also be achieved through this established computational framework.
The presented modeling framework offers guidelines for the next-generation design and development of a durable catalyst for automobiles with optimized performance and cost to meet the requirements of the ever-demanding industry applications of the future.
Conflicts of interest
There are no conflicts to declare.Acknowledgements
This work was financially supported by The National Key Research and Development Program of China (2018YFB0105400).Notes and references
- L. Lin, W. Zhou, R. Gao, S. Yao, X. Zhang, W. Xu, S. Zheng, Z. Jiang, Q. Yu, Y. W. Li, C. Shi, X. D. Wen and D. Ma, Nature, 2017, 544, 80 CrossRef CAS PubMed.
- O. H. Kim, Y. H. Cho, S. H. Kang, H. Y. Park, M. Kim, J. W. Lim, D. Y. Chung, M. J. Lee, H. Choe and Y. E. Sung, Nat. Commun., 2013, 4, 2473 CrossRef PubMed.
- B. Liu, Y. Jia, J. Li, S. Yin, C. Yuan, Z. Hu, L. Wang, Y. Li and J. Xu, J. Mater. Chem. A, 2018, 6, 21475 RSC.
- U. S. Department of Energy and U. S. DRIVE Fuel Cell Technical Team, Fuel Cell Technical Team Roadmap, 2017 Search PubMed.
- P. Pei, Q. Chang and T. Tang, Int. J. Hydrogen Energy, 2008, 33, 3829 CrossRef CAS.
- J. Speder, A. Zana, I. Spanos, J. J. K. Kirkensgaard, K. Mortensen, M. Hanzlik and M. Arenz, J. Power Sources, 2014, 261, 14 CrossRef CAS.
- L. Castanheira, W. O. Silva, F. H. B. Lima, A. Crisci, L. Dubau and F. Maillard, ACS Catal., 2015, 5, 2184 CrossRef CAS.
- S. Ghosh, H. Ohashi, H. Tabata, Y. Hashimasa and T. Yamaguchi, J. Power Sources, 2017, 362, 291 CrossRef CAS.
- N. Macauley, D. D. Papadias, J. Fairweather, D. Spernjak, D. Langlois, R. Ahluwalia, K. L. More, R. Mukundan and R. L. Borup, J. Electrochem. Soc., 2018, 165, F3148 CrossRef CAS.
- T. Tamaki, H. Wang, N. Oka, I. Honma, S.-H. Yoon and T. Yamaguchi, Int. J. Hydrogen Energy, 2018, 43, 6406 CrossRef CAS.
- J. H. Park, S. M. Hwang, G. G. Park, S. H. Park, E. D. Park and S. D. Yim, Electrochim. Acta, 2017, 260, 674 CrossRef.
- Z. Hu, L. Xu, Y. Huang, J. Li, M. Ouyang, X. Du and H. Jiang, Appl. Energy, 2018, 212, 1321 CrossRef CAS.
- M. Chen, S. Hwang, J. Li, S. Karakalos, K. Chen, Y. He, S. Mukherjee, D. Su and G. Wu, Nanoscale, 2018, 10, 17318 RSC.
- N. Takeuchi and T. F. Fuller, J. Electrochem. Soc., 2010, 157, B135 CrossRef CAS.
- J. P. Meyers and R. M. Darling, J. Electrochem. Soc., 2006, 153, A1432 CrossRef CAS.
- J. Chen, J. Hu and J. R. Waldecker, J. Electrochem. Soc., 2015, 162, F878 CrossRef CAS.
- J. Hu, P. C. Sui, S. Kumar and N. Djilali, Electrochim. Acta, 2009, 54, 5583 CrossRef CAS.
- A. A. Kulikovsky, J. Electrochem. Soc., 2011, 158, B957 CrossRef CAS.
- C.-Y. Jung, W.-J. Kim, C.-S. Yoon, D.-H. Kim and S.-C. Yi, Int. J. Energy Res., 2013, 37, 1981 CAS.
- K. G. Gallagher and T. F. Fuller, Phys. Chem. Chem. Phys., 2009, 11, 11557 RSC.
- M. Moein-Jahromi and M. J. Kermani, Int. J. Hydrogen Energy, 2012, 37, 17954 CrossRef CAS.
- N. Khajeh-Hosseini-Dalasm, M. J. Kermani, D. G. Moghaddam and J. M. Stockie, Int. J. Hydrogen Energy, 2010, 35, 2417 CrossRef CAS.
- X. Zhang, Y. Gao, H. Ostadi, K. Jiang and R. Chen, J. Power Sources, 2015, 289, 114 CrossRef CAS.
- X. Zhang and Y. Gao, J. Power Sources, 2016, 318, 251 CrossRef CAS.
- M. Ahadi, A. Putz, J. Stumper and M. Bahrami, J. Power Sources, 2017, 354, 215 CrossRef CAS.
- M. S. Ismail, D. B. Ingham, L. Ma, K. J. Hughes and M. Pourkashanian, Energy, 2017, 122, 420 CrossRef CAS.
- K. S. Walton and R. Q. Snurr, J. Am. Chem. Soc., 2007, 129, 8552–8556 CrossRef CAS PubMed.
- F. Barbir, PEM fuel cells: theory and practice, Elsevier Academic Press, University of California, 2005 Search PubMed.
- W. Sun, B. A. Peppley and K. Karan, Electrochim. Acta, 2005, 50, 3359 CrossRef CAS.
- Y. Shao-Horn, W. C. Sheng, S. Chen, P. J. Ferreira, E. F. Holby and D. Morgan, Top. Catal., 2007, 46, 285 CrossRef CAS.
- A. Rowe and X. Li, J. Power Sources, 2001, 102, 82 CrossRef CAS.
- M. Khakbaz Baboli and M. J. Kermani, Electrochim. Acta, 2008, 53, 7644 CrossRef CAS.
- A. V. Virkar and Y. Zhou, J. Electrochem. Soc., 2007, 154, B540 CrossRef CAS.
- A. Baldan, J. Mater. Sci., 2002, 37, 2171 CrossRef CAS.
- M. Moein-Jahromi, M. J. Kermani and S. Movahed, J. Power Sources, 2017, 359, 611 CrossRef CAS.
- S. R. Dhanushkodi, S. Kundu, M. W. Fowler and M. D. Pritzker, J. Power Sources, 2014, 267, 171 CrossRef CAS.
- G. Lee, H. Choi and Y. Tak, Nanotechnology, 2019, 30, 085402 CrossRef CAS PubMed.
- A. Ohma, K. Shinohara, A. Iiyama, T. Yoshida and A. Daimaru, J. Electrochem. Soc., 2011, 41, 775 CAS.
- Y.-H. Cho, H.-S. Park, Y.-H. Cho, D.-S. Jung, H.-Y. Park and Y.-E. Sung, J. Power Sources, 2007, 172, 89 CrossRef CAS.
- M. Srinivasarao, D. Bhattacharyya, R. Rengaswamy and S. Narasimhan, J. Power Sources, 2010, 195, 6782 CrossRef CAS.
- A. P. Young, J. Stumper and E. Gyenge, J. Electrochem. Soc., 2009, 156, B913 CrossRef CAS.
- J. Thepkaew, A. Therdthianwong and S. Therdthianwong, Energy, 2008, 33, 1794 CrossRef CAS.
- C.-Y. Liu and C.-C. Sung, J. Power Sources, 2012, 220, 348 CrossRef CAS.
- T. Suzuki, S. Tsushima and S. Hirai, Int. J. Hydrogen Energy, 2011, 36, 12361 CrossRef CAS.
- T. Suzuki, S. Tsushima and S. Hirai, J. Power Sources, 2013, 233, 269 CrossRef CAS.
Footnote |
| † Electronic supplementary information (ESI) available. See DOI: 10.1039/c9ra09572a |
| This journal is © The Royal Society of Chemistry 2020 |


