 Open Access Article
Rational synthesis of 10GDC electrolyte through a microwave irradiation GNP facile route for SOFC applications
S. P. S. Shaikh *a and
Chandrashekhar V. Rode
 b
b
aDepartment of Physics, Savitribai Phule Pune University, Ganeshkhind Road, Pune-411007, Maharashtra, India
bChemical Engineering and Process Development Division, National Chemical Laboratory, Pune 411008, India. E-mail: shabanamsrl@gmail.com; Tel: +91 9923199822
First published on 16th January 2020
Abstract
The gadolinium-doped ceria Gd0.1Ce0.9O1.95 (10GDC) powder was synthesized using a microwave-synthesized glycine nitrate process (MS-GNP). The powder was subsequently pressed into circular pellets and sintered at various temperatures viz. 800, 900, 1000 and 1200 °C, in a microwave, high temperature furnace for 4 h so as to investigate the effect of the sintering temperature and sintering environment on the structural, morphological, thermal and electrical properties. The crystallite size and particle size as observed from X-Ray Diffraction (XRD) and Field Emission Scanning Electron Microscopy (FESEM) are found to be in the range of 15–28 nm and 12–20 nm, respectively. The electrochemical impedance spectroscopy (EIS) analysis was carried out to study the electrochemical properties during the cooling cycle from 400 °C to 800 °C. The highest value of ionic conductivity (3.55 × 10⁻¹ S cm−1) is observed at an operating temperature of 800 °C and O2 gas partial pressure of 1 atm. Further, it is observed that the sintering temperature has a significant effect on the surface morphology and crystallite size, thereby improving the electrical performance of the samples. Though 20GDC was used as an electrolyte in the authors' previous study, the novelty of the present work is the synthesis of 10GDC using a microwave-assisted glycine nitrate process and the size (thickness) of the prepared electrolyte for use in a Solid Oxide Fuel Cell (SOFC), which plays a major role in enhancing the structural, morphological and electrochemical properties with respect to different sintering temperatures as compared to the reported data. Hence, the prepared 10GDC electrolyte may be treated as one of the promising candidates as an electrolyte for SOFC for intermediate as well as high temperature applications.
1. Introduction
The fuel cell (FC) is one of the potential technologies to compete with the conventional sources of energy. It involves the electrochemical reaction of hydrogen with the oxidizing gas, generating energy and water as the only byproduct, and is considered as a clean, renewable energy source for a sustainable society. Amongst various types of FCs, the SOFC is one of the most efficient, reliable and commercially explored systems, which can be used for a wide range of small to large scale applications. This becomes the major driving force for SOFCs to be a most influencing and challenging field of research globally. The ongoing research activities into SOFCs are in line with the requirements of energy security and environmental consideration.1For the commercial exploitation of SOFCs, the selection of the electrolyte material plays a vital role. It electrically insulates each half-cell, thereby ensuring the electrons flow through the external circuit and assist the oxy ions to pass through its matrix towards the cathode during the electrochemical reaction.2,3 It is well known that ceria (CeO2) is a promising material as a catalyst as well as an electrolyte for the SOFC applications.4,5
The CeO2-based materials are known to promote heterogeneous catalytic reactions6,7 while the doped ceria electrolytes have exhibited high ionic conductivity and high efficiency in comparison to the conventionally used electrolytes even at temperatures below 600 °C.1,8 The major drawbacks of conventional electrolyte materials are: cell degradation, thermo chemical instability, disturbance in the thermal expansion coefficient and high manufacturing cost due to high operating temperature.1,9–12 These drawbacks could be overcome to some extent by the gadolinium-doped cerium oxide (GDC), particularly for low and intermediate temperature SOFC applications. For example, Gd0.2Ce0.8O2−δ (20GDC) reflects high electronic conductivity and less ionic conductivity with more porosity compared to the 10GDC (Gd0.1Ce0.9O1.95) electrolyte due to the high concentration of Gd.13 This is because, Gd3+ ions have strong affinity towards the complexing agents during the reaction environment.14 This indicates that the optimal Gd composition is a governing factor in deciding the cell performance and achievement of stable Gd complexes in the GDC matrix to enable the system to achieve the desired device-level performance characteristics.15 The 10GDC electrolyte materials promote high O2− ion vacancies and the O2− ionic conduction, which are the essential requirements for accomplishing the fast kinetics for the SOFC process.16,17 They are non-stoichiometric composites with 4+ and 3+ oxidation states of cerium, which can enhance the oxy-ion conductivity compared to the other electrolytes reported earlier, comparatively at low operating temperatures in the range of 600–800 °C.18 Nevertheless, several parameters of GDC electrolyte are required to optimize the composition and the thickness of the GDC pellet to enhance the ionic conductivity. The ionic conductivity of the electrolyte depends on the sintering environment, crystalline properties, composition of the material, crystallite size, thickness and grain size.17,19–21 Thus, the structural, compositional and morphological aspects of GDC are decisive factors in determining the overall performance of the system. In addition, the use of rare-earth ions as a dopant in the synthesis of electrolyte helps to reduce the operating temperature in the low as well as intermediate temperature regime for SOFC applications.9
It is well known that for the preparation of electrolyte materials such as YSZ, YDC, SDC and GDC, the conventional methods require very high temperature of the order of ≥1400 °C.14,22–24 Therefore, in the present study, the microwave synthesized glycine nitrate process (MS-GNP)25 technique is used to effectively minimize the sintering temperature to prepare the 10GDC electrolyte by retaining its required morphological and electrical characteristics. The prepared 10GDC sample was investigated thoroughly for its structural, thermal and electrical characteristics using advanced sintering technique at different sintering temperatures, in order to gain a better understanding of how the standard electrolytic properties are improved compared to that could be achieved by the conventional processes.
2. Materials and methods
High purity (>99.9%) Sigma Aldrich procured gadolinium nitrate hexahydrate, cerium nitrate hexahydrate and glycine were used to synthesize the 10GDC electrolyte material by MS-GNP route.25 The synthesized powder was pressed into pellets having diameter 25 mm with 1 mm thickness at a pressure of 4 tons for 2 min. The prepared pellets were sintered in a programmable high temperature microwave furnace (Phoenix CEM, Microwave Technology) at 800 °C, 900 °C, 1000 °C and 1200 °C for 4 h. The rate of annealing the sample was programmed at 20 °C min−1, whereas the cooling was done slowly at 2 °C min−1 to avoid cracking of the pellets. The sintering temperature and time were controlled and maintained with the help of 16-step digital proportional–integral–derivative (PID) controller provided with the high temperature microwave furnace.26 Further, the sintered pellets were pulverized using mortar and pestle, and examined for crystallinity and formation of the synthesized materials using Cu-Kα radiation of 1.54 Å (Bruker AXS D8-X-Ray Diffractometer) with step size of 0.02° and scanning rate of 5 s per scanning step. The raw data was refined using X'pert High Score plus Software. Surface morphology, grain size and local elemental composition were characterized using Field-Emission Scanning Electron microscopy (FE-SEM) FESEM-450, and X-lash 6130 emission electron microscope, USA. Prior to the scanning electron microscopy, the pellets were coated by gold which was sputtered for 30 s. The cell volume and lattice parameter for each sample sintered at different temperatures were measured using the Cell Refine software.27The surface roughness of the sintered pellet was studied by Atomic Force Microscopy (AFM) (JEOL, JSPM-5200, Japan). To study the thermal behavior of 10GDC as a function of temperature, Thermo Gravimetric Analysis (TGA), Differential Thermal Analysis (DTA) and Differential Scanning Calorimetry (DSC) were performed using TGA/DSC (1 Star System, Mettler Toledo). The Brunauer–Emmett–Teller (BET) method was used to characterize the specific surface area and the particle size distribution using Surface Area Analyzer (Thermo Scientific BET, Nitrogen adsorption system model). The electrical properties of the 10GDC sample sintered at 1200 °C were investigated using Electrochemical Impedance Spectroscopy (EIS) (Electrochemical Analyzer – CH1604E, CH Instruments, India) in the temperature range of 400–800 °C. The rate during heating was maintained at 20 °C min−1 from room temperature to 800 °C and O2 gas partial pressure of 1 atm, while in cooling, the temperature of the sample was decreased by 20 °C min−1.
3. Results and discussion
3.1. Structural characterization
The X-Ray diffraction (XRD) patterns of 10GDC pellets sintered in microwave furnace for 4 h at different temperatures are shown in Fig. 1. The XRD patterns indicate different Bragg's reflections corresponding to different planes of 10GDC. These peaks from the JCPDS data of file no. 01-075-0161, confirm the cubic fluorite structure of Ce0.9Gd0.1O1.95 samples. Further, no peaks corresponding to any other phase are obtained, suggesting the formation of single phase compound.14,23,28 The microwave-sintered green samples show the formation of 10GDC even at a sintering temperature of 800 °C, which exactly matches with the JCPDS data. The crystallinity and densification of the 10GDC could be enhanced by sintering the sample in microwave furnace up to 1200 °C. Thus, based on the XRD results with sharp crystalline peaks and cubic fluorite structure of 10GDC sample sintered at 1200 °C, this sample has been taken further for its various structural, thermal and electrochemical characterizations.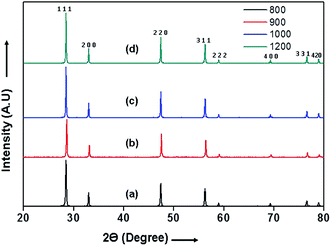 | ||
| Fig. 1 XRD patterns of the 10GDC microwave sintered samples at different temperatures: (a) 800 (b) 900 (c) 1000 and (d) 1200 °C for 4 h. | ||
The crystallite size estimated by Scherrer equation1,9,25 and the lattice parameters of the 10GDC samples estimated using cell refine software are given in Table 1.27 The crystallite size of the 10GDC sample is found to be in the range of 15–28 nm, while the sintered density is found to be 6.98 g cm−3, showing a close agreement with the standard density of 10GDC (7.22 g cm−3).23 The growth in crystallite size is observed due to higher densification with increase in temperature in the microwave irradiation process. The XRD phases reveal the lattice group Fm![[3 with combining macron]](https://www.rsc.org/images/entities/char_0033_0304.gif) m with respect to the cubic fluorite structure corresponding to the lattice parameter, a = b = c = 0.54 nm.9,23
m with respect to the cubic fluorite structure corresponding to the lattice parameter, a = b = c = 0.54 nm.9,23
| Sintering temp °C | Lattice parameter a = b = c (nm) | Cell volume (nm) | Lattice strain | Archimedes density (g cm−3) | Crystallite size (nm) | Particle size (nm) from FE-SEM |
|---|---|---|---|---|---|---|
| 800 | 0.5409 | 15.826 | 0.11 | 6.89 | 15.11 | 19.75 |
| 900 | 0.5410 | 15.922 | 0.10 | 6.88 | 16.04 | 16.40 |
| 1000 | 0.5412 | 15.913 | 0.095 | 6.90 | 18.90 | 14.72 |
| 1200 | 0.5407 | 15.938 | 0.13 | 6.98 | 27.83 | 12.70 |
The crystallite size of the 10GDC sintered samples at different temperatures is consistently increased due to its high densification, forming a better microstructure at lower temperature in the microwave furnace. The prepared 10GDC samples show a narrow particle size distribution, which confirms that the Gd3+ and Ce4+ in the gadolinium cerium oxide matrix mutually support to increase the ionic sites by forming the oxygen vacancies with a subsequent increase in the ionic conduction.29
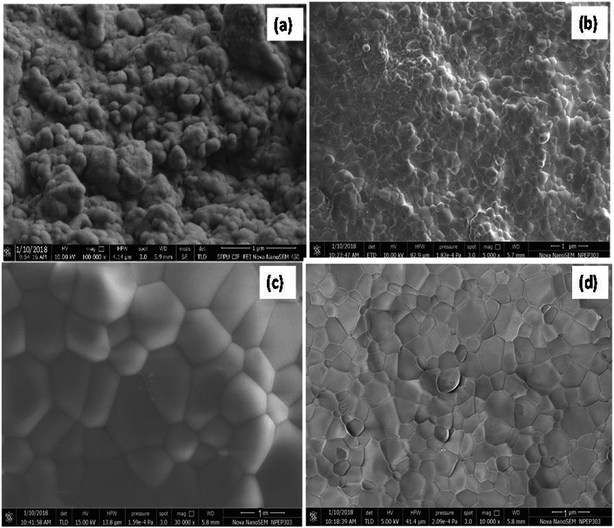
The FE-SEM images (Fig. 2) of the microwave-sintered samples show the presence of grains grew in a well-crystalline nature with the increase in the sintering temperature. Fig. 2(a–d) depicts the crack-free dense nanostructured morphology with fairly high surface area obtained under the microwave-irradiation sintering technique. The FE-SEM images reveal the formation of diffused fine crystalline particle growth during the microwave sintering of 10GDC even at 800 °C compared to the conventionally sintered YSZ at temperature ≥1400 °C reported earlier.23,29 Fig. 2(a–d) suggests that the microwave heating offers an ultra-fast method for ceramic preparation with an ultra-large heating rate compared to the conventional sintering methodologies. Thus, due to the volumetric microwave sintering, the grain size becomes smaller than that obtained by the conventional methods, while the grain size uniformity increases because of a few orders higher densification rate in a shorter sintering time. From the FE-SEM images, it is seen that the microwave sintering method produces a finer microstructure. The sintering at the inter-particle boundary is enhanced by the microwave-driven high-frequency ion vibration, while the shorter sintering time inhibits the grain growth.30,31 The distribution of metal and ceramic components is uniform with an average particle size in the submicron range. Fig. 2(c and d) depicts the presence of more homogeneous dense nanostructured particles with smaller particle size due to the high shrinkage rate at 1000 and 1200 °C compared to those processed at 800 and 900 °C (Fig. 2(a and b)). The microwave sintering has shown to produce samples with more uniform grain size distribution and higher density at lower temperature, compared to conventional techniques.31 The Archimedes's density (Table 2) of the sintered pellets at 800–1200 °C is found to be approximately similar to the standard value and to that reported previously.1,25,32,33
| Surface area m2 g−1 | Pore volume (cm3 g−1) | Specific pore radius (nm) | Average particle size (nm) from TEM | Average particle size (nm) from BET | Mechanical strength (kg mm−2) | Roughness (nm) from AFM |
|---|---|---|---|---|---|---|
| 0.821 | 0.002 | 0.1834 | 11.09 | 10.50 | 695.22 | 3.43 |
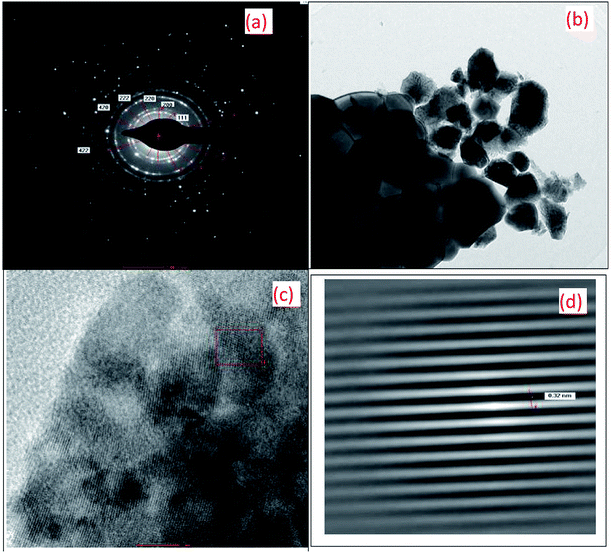
Fig. 3 shows the HR-TEM images of the 10GDC sample sintered at 1200 °C for 4 h in the microwave furnace. Both the SAED pattern (Fig. 3(a)) and TEM surface image (Fig. 3(b)) reveals that the obtained XRD data are in well agreement with the TEM results. The SAED image shows six clear and highly intense circular discs in good agreement with the XRD matching crystallography JCPDS file no. 01-075-0161. The TEM image confirms the formation of nano size particles due to the agglomeration of the crystallites with particle size of 11.09 nm and inter-planar spacing of 0.32 nm; this nanostructured morphology is consistent with the particle size obtained from the XRD pattern presented in Fig. 1 and BET results shown in Fig. 4. The HR-TEM image presented in Fig. 3(c) discloses the clear lattice fringes, which substantiates the high crystalline nature of the material. The information of 10GDC as obtained from the HR-TEM analysis are in good agreement with the results reported in few published works.9,23 The enlarged view of the section marked in the red square box in Fig. 3(c) is presented in Fig. 3(d), which was used to calculate the d-spacing value. The measured d-spacing value is 0.32 nm which matches well with the d-value measured from the XRD data. Thus, the TEM results strongly confirm the higher efficacy of the microwave-assisted synthesis process to obtain the desired size and morphological features of the crystallites compared to the rather time-consuming and energy-intensive conventional processes.
The BET surface area analysis of 10GDC sintered at 1200 °C is given in (eqn (1)).
 | (1) |
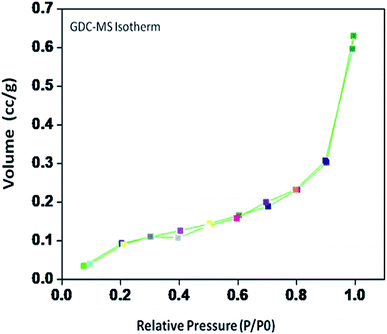
The specific surface area, pore volume and pore radius obtained by the BET measurements are 0.821 m2 g−1, 0.002 cm3 g−1 and 0.1834 nm, respectively. As expected, the specific surface area is much greater for the synthesized sample. This could be ascribed to the smaller particle size obtained because of pulverization of the sample in the sintering process under the microwave irradiation, which is in well agreement with the results of XRD and FE-SEM. As shown in Fig. 4, the very narrow hysteresis loop for the adsorption isotherm of 10GDC sintered at 1200 °C is developed generally due to the condensation in the mesopore, which plays a major role in determining the structure of the pores. The narrow hysteresis loops indicate low porosity with smaller particle size formation. The results of the surface area analysis show good consistency with the data reported elsewhere.31,32,34 From the nitrogen adsorption analysis, the average pore radius for the sample sintered at 1200 °C is estimated to be 3.1203 nm with an average particle size of 10.50 nm, was calculated using eqn (1). The comparison of the particle size determined by the XRD method d(hkl) or d(BET) indicates an increase in the extent of agglomeration during microwave irradiation.
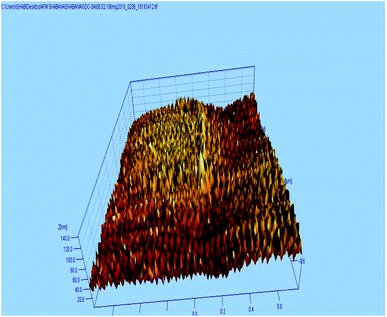
The AFM study was carried out to understand the micro structure topology of the microwave sintered 10GDC sample at 1200 °C. As shown in Fig. 5, the sample is composed of spherical particles with uniform and smooth distribution of the grains along the surface. The surface roughness of the sample was estimated to be 3.43 nm. Also, the mechanical strength has been estimated from the data of the AFM images by the Image j software, to be 695.22 kg mm−2. Thus, it could be inferred from the AFM results that the desired surface characteristics have been acquired, elucidating the ability of the microwave process in tuning the morphological characteristics. Moreover, the AFM results of the present 10GDC sample prepared by MS-GNP are in good agreement with the data of SDC and YSZ electrolytes reported by Muthukkumaran et al.,35 with better results for the prepared GDC materials.
3.2. Thermal analysis
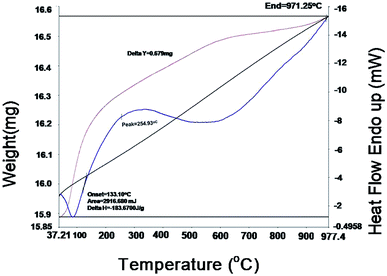
Thermo gravimetric analysis (TGA) and differential scanning calorimetric (DSC) studies were carried out on the 10GDC sample sintered at 1200 °C to analyze the correlation between the reductions and gain in the weight percentage as a function of temperature. The TGA and DSC analyses36 were performed on the GDC oxide microsphere under argon in double cycle at constant temperature with heating and cooling rates of 5 °C min−1.37–40The DSC curves in Fig. 6 shows two exothermic peak at 40 °C and 254.9 °C with slight weight loss. The first exothermic peak is attributed to the desorption of the physically adsorbed water and organic solvents, whereas the second peak is due to the combined effect of combustion of the residual organic species, decomposition of other absorbed moieties, and the oxidation of cerium oxide and gadolinium oxide components to CeO2, Gd2O3 respectively, at higher temperature. An endothermic effect is observed from 254.93 °C to 500 °C with a corresponding weight loss of 0.579 mg. Further, with increase in temperature from 500 °C to 1000 °C, a slight weight gain is observed up to 900 °C. This might have occurred due to the change in the valence state of Ce3+ to Ce4+.9,41 The TGA analysis shows that the residual moisture is removed during the temperature range from room temperature to 100 °C, while there is no phase transformation in the range 100–700 °C; however, at higher temperatures (700 °C to 977.4 °C), there is a negligible change in weight due to the mineralization under the argon gas environment. There is no weight gain in the 10GDC sample, indicating the formation of very clear single phase cubic fluorite structure, which is consistent with the XRD results at 1200 °C in which no extra phases are observed.
3.3. Electrochemical characteristics
The electrochemical impedance spectroscopy (EIS) measurement was carried out at 400–800 °C for the 10GDC sample sintered at 1200 °C under the oxygen partial pressure of 1 atm. These were collected on a comparative basis for the heating and cooling cycles with the temperature difference of 20 °C and charge homogenization time of 10 min for each reading in the cooling cycle. As the impedance response was very poor below 600 °C, the EIS plots of the 10GDC sample are made for temperatures 600 °C, 700 °C and 800 °C, as depicted in Fig. 7(a–c). At 600 °C and 700 °C, the impedance plot shows two incomplete partially resolved arcs, this could be ascribed to the difference in the relaxation time for the transfer of oxy ions through bulk, grain boundary and the reference electrode. Also, the depressed arc in Fig. 7(a and b) indicates the distribution of currents and electro active species due to the non-ideal capacitive nature of 10GDC.29 At the higher operating temperature of 800 °C, the impedance arc response is shifted to the higher frequency region, thereby producing a single semicircle due to the decrease of relaxation time with increase in temperature as (Fig. 7(c)).37 The decrease of relaxation time at 800 °C is due to the increase of hopping energy when the temperature is increased from 600 °C to 800 °C. The hopping process causes increase of oxy ion vacancies in the 10GDC crystal.29,42 The bulk resistance (Rb) and grain boundary resistance (Rgb) were calculated by taking the difference of the low and high frequency intercepts of the corresponding arcs, which fitted well using the two equivalent circuits, (R-CPE)b–(R-CPE)gb (R-CE)el for the impedance arc obtained at 600 and 700 °C, and Rb (R-CPE)gb–(R-CPE)el for 800 °C, by using the Z-view software. It is observed that the ionic conductivity increases with the increase of operating temperature, due to the enhanced mobility of the oxygen ion vacancy. The doping of Gd3+ into the CeO2 matrix generates more oxy ion vacancies, which permits conduction of oxygen ions as explained by the Kroger–Vink equation (eqn (2)) and the equation indicating the phase transformation (eqn (3)).3,43
 | (2) |
 is the oxy ion vacancy.
| Ce2O3 + O2 → 2CeO2 | (3) |
 | ||
| Fig. 7 EIS spectra of 10GDS sintered at 1200 °C in presence of O2 = 1 atm for the operating temperatures of (a) 600 °C, (b) 700 °C, and (c) 800 °C. | ||
The phase transformation of cerium oxide from Ce3+ to Ce4+ is according to eqn (3), due to the change in the valence state during the electrochemical reaction.41,44
The EIS plots (Fig. 7) show the AC conductivity of the 10GDC sample sintered at 1200 °C as 1.92 × 10⁻² S cm−1 at the operating temperature of 600 °C, whereas this value reached to 2.24 × 10⁻² S cm−1 at 700 °C and 3.55 × 10⁻¹ S cm−1 at 800 °C.20 This was possible due to the larger surface area obtained by the microwave sintering of the 10GDC sample. In 10GDC, the smaller doping of Gd in Ce could help to lower the grain boundary resistance as compared to the previously reported 20GDC samples.32
The Arrhenius plots generated from the EIS data (log![[thin space (1/6-em)]](https://www.rsc.org/images/entities/char_2009.gif) σT vs. 1000/T and for the log
σT vs. 1000/T and for the log![[thin space (1/6-em)]](https://www.rsc.org/images/entities/char_2009.gif) ASR vs. 1000/T plots) for the sample are shown in Fig. 8(a and b). The activation energy of the 10GDC sample sintered at 1200 °C for 4 h and operated at 800 °C is estimated to be 0.451 eV (Fig. 8(a)), while the activation energy of the fitted impedance is 0.228 eV (Fig. 8(b)). These values agree well with the data reported by Shi et al.44 The ceramic-based electrolyte shows improved ionic conductivity due to the co-doping of trivalent Gd3+ (as explained in eqn (2)), with fine grain structure, which initiates the high oxygen vacancy creation even at the intermediate temperature range of 600–800 °C. Also, it is understood that the obtained nanostructured morphology plays an important role in generating the higher ionic conductivity of the 10GDC electrolyte prepared by the MS-GNP technique compare to the several conventionally synthesized electrolyte materials.29,44–46
ASR vs. 1000/T plots) for the sample are shown in Fig. 8(a and b). The activation energy of the 10GDC sample sintered at 1200 °C for 4 h and operated at 800 °C is estimated to be 0.451 eV (Fig. 8(a)), while the activation energy of the fitted impedance is 0.228 eV (Fig. 8(b)). These values agree well with the data reported by Shi et al.44 The ceramic-based electrolyte shows improved ionic conductivity due to the co-doping of trivalent Gd3+ (as explained in eqn (2)), with fine grain structure, which initiates the high oxygen vacancy creation even at the intermediate temperature range of 600–800 °C. Also, it is understood that the obtained nanostructured morphology plays an important role in generating the higher ionic conductivity of the 10GDC electrolyte prepared by the MS-GNP technique compare to the several conventionally synthesized electrolyte materials.29,44–46
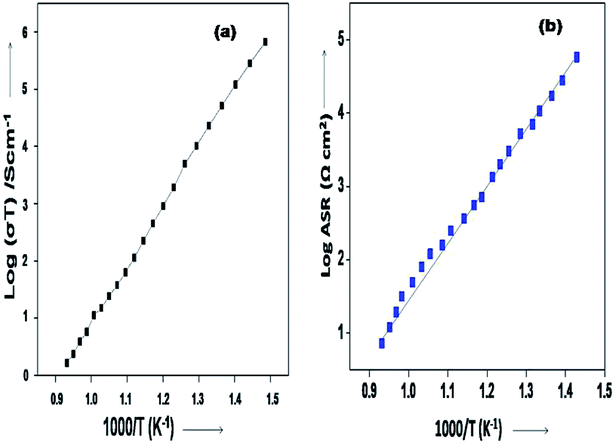 | ||
Fig. 8 Arrhenius plots of 10GDC sintered at 1200 °C: (a) log![[thin space (1/6-em)]](https://www.rsc.org/images/entities/char_2009.gif) σT vs. 1000/T and (b) log σT vs. 1000/T and (b) log![[thin space (1/6-em)]](https://www.rsc.org/images/entities/char_2009.gif) ASR vs. 1000/T plots. ASR vs. 1000/T plots. | ||
4. Conclusion
The effect of microwave sintering of 10GDC has been studied at different annealing temperatures to attain a favourable tuning of the crystallite size, surface morphology and ionic conductivity, for the IT-SOFC applications. The microwave processing is a relatively new development in the processing of materials, which has distinct advantages in terms of lowering the processing time and energy, compared to the conventional techniques. Also, it is observed that the crystallites of all the sintered pellets formed through the microwave process are in nano size range. The electrical study reveals that the higher values of AC conductivity (3.55 × 10⁻¹ S cm−1) are achieved at an operating temperature of 800 °C under O2 gas partial pressure of 1 atm. The XRD, HR-TEM, FE-SEM, and EDS analyses confirm the formation of nanostructured crystalline particles of the prepared 10GDC sample. Since fast and homogeneous nucleation of particles in the 10GDC matrix occurred due to the microwave irradiation process, good sinterability and good ionic conductivity could be possible. The rapid microwave sintering helps to manufacture the ceramic electrolyte for SOFC applications with smaller particle sizes than those produced by the conventional techniques. This improved structural characteristic of the sample is due to the vibration of the high-frequency ions when subjected to microwave irradiation, whereas the limited time of sintering process inhibits particle enlargement. The ability of the microwaves to couple energy directly to the material is the primary advantage of the microwave processing, compared to the conventional techniques. The cubic fluorite structured 10GDC electrolyte is observed to be more promising than the other reported conventional electrolyte, for the IT-SOFC applications. The effect of sintering temperature using microwave radiations on the densification, morphological microstructure, fine tuning and ionic properties of the 10GDC electrolyte was studied. Considering the ease of preparation and the quality of the product obtained, the methodology adopted here can be further scaled up for a commercially viable process for making the electrolyte material for the SOFC applications.Conflicts of interest
There are no conflicts to declare.Acknowledgements
The first author gratefully acknowledges the Department of Physics, SP Pune University, Pune, and CSIR-National Chemical Laboratory (CSIR-NCL), Pune, Maharashtra, India, for permission to carry out this work successfully. This work is supported financially by UGC, New Delhi, India, under DS Kothari Post-Doctoral Fellowship award no. PH-0030. Sincere thanks to Dr Sreekumar Kurungot, Dr N. Devi, Shibin and Jijil, CSIR-NCL, Pune, and, also to Prof. A. S. Kumbhar and S. B. Tayade, Department of Chemistry, SP Pune University, Pune and Dr M. Abdul Mujeebu, Imam Abdulrahman Bin Faisal University, Kingdom of Saudi Arabia for their kind help to complete this work by using their lab facilities.References
- S. Shaikh, S. Moharil and B. Nagrare, Int. J. Hydrogen Energy, 2012, 37, 6853–6861 CrossRef.
- S. P. Shaikh, A. Muchtar and M. R. Somalu, Renewable Sustainable Energy Rev., 2015, 51, 1–8 CrossRef.
- M. Reisert, A. Aphale and P. Singh, Materials, 2019, 11, 2169 CrossRef.
- S. M. Ali, M. Anwar, A. M. Abdalla, M. R. Somalu and A. Muchtar, Ceram. Int., 2017, 43, 1265–1271 CrossRef.
- M. Anwar, S. M. Ali, A. M. Abdalla, M. R. Somalu and A. Muchtar, Process. Appl. Ceram., 2017, 11, 67–74 CrossRef.
- R. J. Gorte and J. M. Vohs, J. Catal., 2003, 216, 477–486 CrossRef.
- A. Fuerte, R. X. Valenzuela and M. a. J. Escudero, Universal Journal of Electrical and Electronic Engineering, 2017, 5, 45–55 Search PubMed.
- Z. Gong, W. Sun, D. Shan, Y. Wu and W. Liu, ACS Appl. Mater. Interfaces, 2016, 8, 10835–10840 CrossRef.
- M. Choolaei, Q. Cai, R. C. Slade and B. A. Horri, Ceram. Int., 2018, 44, 13286–13292 CrossRef.
- B. C. Steele, Solid State Ionics, 2000, 129, 95–110 CrossRef.
- V. Kharton, F. Marques and A. Atkinson, Solid State Ionics, 2004, 174, 135–149 CrossRef.
- A. Lashtabeg and S. J. Skinner, J. Mater. Chem., 2006, 16, 3161–3170 RSC.
- G. Dönmez, V. Sarıboğa, T. Gürkaynak Altınçekiç and M. A. F. Öksüzömer, J. Am. Ceram. Soc., 2015, 98, 501–509 CrossRef.
- A. Gondolini, E. Mercadelli, A. Sanson, S. Albonetti, L. Doubova and S. Boldrini, Ceram. Int., 2011, 37, 1423–1426 CrossRef.
- G. Laukaitis, J. Dudonis and D. Milcius, Mater. Sci., 2007, 13, 23–26 Search PubMed.
- C. Xia and M. Liu, Solid State Ionics, 2001, 144, 249–255 CrossRef CAS.
- S. I. Ahmad, P. Koteshwar Rao and I. A. Syed, Journal of Taibah University for Science, 2016, 10, 381–385 CrossRef.
- S. R. Hui, J. Roller, S. Yick, X. Zhang, C. Deces-Petit, Y. Xie, R. Maric and D. Ghosh, J. Power Sources, 2007, 172, 493–502 CrossRef CAS.
- J. Shemilt and H. Williams, J. Mater. Sci. Lett., 1999, 18, 1735–1737 CrossRef CAS.
- S. Kazlauskas, A. Kežionis, T. Šalkus and A. F. Orliukas, J. Mater. Sci., 2015, 50, 3246–3251 CrossRef CAS.
- S. Zha, C. Xia and G. Meng, J. Power Sources, 2003, 115, 44–48 CrossRef CAS.
- H. Yahiro, Y. Eguchi, K. Eguchi and H. Arai, J. Appl. Electrochem., 1988, 18, 527–531 CrossRef CAS.
- V. Sadykov, V. Usoltsev, Y. Fedorova, N. Mezentseva, T. Krieger, N. Eremeev, M. Arapova, A. Ishchenko, A. Salanov and V. Pelipenko, in Sintering of ceramics-New emerging techniques, InTech, 2012 Search PubMed.
- L. Spiridigliozzi, G. Dell'Agli, A. Marocco, G. Accardo, M. Pansini, S. Yoon, H. Ham and D. Frattini, J. Ind. Eng. Chem., 2018, 59, 17–27 CrossRef CAS.
- S. P. Shaikh, M. R. Somalu and A. Muchtar, J. Phys. Chem. Solids, 2016, 98, 91–99 CrossRef CAS.
- S. Charmond, C. P. Carry and D. Bouvard, J. Eur. Ceram. Soc., 2010, 30, 1211–1221 CrossRef CAS.
- T. Holland and S. Redfern, Mineral. Mag., 1997, 61, 65–77 CrossRef CAS.
- Z. Wang, G. M. Kale and M. Ghadiri, J. Am. Ceram. Soc., 2012, 95, 2863–2868 CrossRef CAS.
- C. Ng, S. Ramesh, C. Tan, A. Muchtar and M. R. Somalu, Int. J. Hydrogen Energy, 2016, 41, 14184–14190 CrossRef CAS.
- D. P. Fagg, V. V. Kharton and J. R. Frade, J. Electroceram., 2002, 9, 199–207 CrossRef CAS.
- R. Chockalingam, S. Chockalingam and V. R. Amarakoon, J. Power Sources, 2011, 196, 1808–1817 CrossRef CAS.
- M. Caisso, R. m. Boulesteix, S. b. Picart, A. Maître, T. Delahaye and A. Ayral, J. Am. Ceram. Soc., 2017, 100, 4450–4460 CrossRef CAS.
- L. Spiridigliozzi, G. Dell'Agli, G. Accardo, S. Yoon and D. Frattini, Ceram. Int., 2019, 45, 4570–4580 CrossRef CAS.
- N. Seaton and J. Walton, Carbon, 1989, 27, 853–861 CrossRef CAS.
- K. Muthukkumaran, P. Kuppusami, T. Mathews, E. Mohandas and S. Selladurai, Mater. Sci., 2007, 25, 671–678 CAS.
- A. Rafique, R. Raza, N. Akram, M. K. Ullah, A. Ali, M. Irshad, K. Siraj, M. A. Khan, B. Zhu and R. Dawson, RSC Adv., 2015, 5, 86322–86329 RSC.
- M. Dudek, Int. J. Electrochem. Sci., 2012, 7, 2874–2889 CAS.
- G. Accardo, C. Ferone, R. Cioffi, D. Frattini, L. Spiridigliozzi and G. Dell'Agli, J. Appl. Biomater. Funct. Mater., 2016, 14, 35–41 Search PubMed.
- S. Ohta, T. Kosaka and K. Sato, J. Phys.: Conf. Ser., 2010, 225, 012043 CrossRef.
- C. Graf, R. Ohser-Wiedemann and G. Kreisel, J. Photochem. Photobiol., A, 2007, 188, 226–234 CrossRef CAS.
- A. Zarkov, A. Stanulis, T. Salkus, A. Kezionis, V. Jasulaitiene, R. Ramanauskas, S. Tautkus and A. Kareiva, Ceram. Int., 2016, 42, 3972–3988 CrossRef CAS.
- J. G. Lee, J. H. Park and Y. G. Shul, Nat. Commun., 2014, 5, 4045 CrossRef CAS.
- P. Kuppusami, S. Padhi, K. Muthukkumaran, E. Mohandas and V. Raghunathan, Surf. Eng., 2005, 21, 172–175 CrossRef CAS.
- H. Shi, R. Ran and Z. Shao, Int. J. Hydrogen Energy, 2012, 37, 1125–1132 CrossRef CAS.
- N. Kim, B.-H. Kim and D. Lee, J. Power Sources, 2000, 90, 139–143 CrossRef CAS.
- İ. Ermiş and S. Shaikh, Ceram. Int., 2018, 44, 18776–18782 CrossRef.
| This journal is © The Royal Society of Chemistry 2020 |

