 Open Access Article
A thermal energy storage composite by incorporating microencapsulated phase change material into wood
Wenbin Wanga,
Huimin Caoa,
Jingyi Liua,
Shifang Jiaa,
Lin Mab,
Xi Guo*a and
Weisheng Sun *a
*a
aLab Wood Sci & Technol, Zhejiang A & F Univ, Hangzhou 311300, PR China. E-mail: guoxi@zafu.edu.cn; 18268158266@163.com
bZhejiang Shiyou Timber Co., Ltd, Huzhou 313000, PR China
First published on 25th February 2020
Abstract
Phase change energy storage wood (PCESW) was prepared by using microencapsulated phase change materials (MicroPCM) as thermal energy storage (TES) materials and wood as the matrix. The incorporation of MicroPCM and wood was realized using a vacuum impregnation method. The morphology and microstructure of MicroPCM, delignified wood (DLW) and PCESW were observed by scanning electron microscopy (SEM); the thermal properties including phase change temperature, enthalpy, thermal stability, thermal conductivity of MicroPCM and PCESW were characterized by differential scanning calorimetry (DSC), thermogravimetric analysis (TG) and laser flash analysis (LFA). The results showed that: (1) delignification improved the porosity of wood and enhanced the impregnation effect, MicroPCM got into the delignified wood successfully and mainly distributed in the vessels; (2) PCESW had excellent energy storage capacity and suitable phase transition temperature for regulating indoor temperature; (3) PCESW had prior thermal stability at room temperature and great durability after 100 heating–cooling cycles; (4) addition of graphene greatly improved the thermal conductivity of PCESW. The TES composite can be used as an indoor temperature regulating material for building energy conservation.
1 Introduction
With the rapid development of the economy, in particular the dramatic increase in building energy consumption caused by population growth, energy and environmental problems have become a worldwide topic.1–4 Thermal energy storage (TES) materials based on phase change materials (PCMs) were suggested as a solution to these problems. PCMs refer to the materials that can absorb or release a large amount of energy during the phase change process and maintain a constant temperature in a certain range.5–8 Therefore, the incorporation of PCMs with building materials is helpful for adjusting indoor temperature and reducing building energy consumption. According to the phase transition state, PCMs can be divided into solid–liquid, solid–solid and solid–gas PCMs.9–11 Compared with the other two PCMs, solid–liquid PCM is the most widely used, benefited by its high latent heat and low cost.12–15 However, shortcomings like volume change and liquid infiltration during the phase change process seriously limits the application of solid–liquid PCM, considering that it may reduce the thermal energy storage capacity and lead to environmental pollution.16–19 MicroPCM combined with microcapsule technology is an ideal method to overcome the problems of solid–liquid PCM.20–23 MicroPCM can prevent PCM from leaking, volume change in the phase transition process and increase the heat transfer area of PCM.24–26 So a lot of researchers have prepared the energy saving composites by using the temperature regulation and form-stable function of MicroPCM. Cabeza et al.27 constructed two identical 2 × 2 × 3 m houses to investigate the energy capacity of MicroPCM, one of them was made of ordinary concrete slabs and another was used energy storage concrete mixed MicroPCM. The indoor temperature changes were recorded with radiation sensors, results showed that adding MicroPCM could effectively keep constant indoor temperature and reduce energy consumption of the house. Hunge et al.28 added MicroPCM to self-made concrete and tested the properties of concrete before and after hardening, results showed that the performance of fresh concrete is not affected by MicroPCM, but its energy storage capacity improved after hardening. And 12% energy consumption can be saved when the mass fraction of MicroPCM was 5%. Jin et al.29 fabricated a wood–plastic composites using MicroPCM as latent heat storage medium and polyvinyl chloride (PVC)/wood flour composites as support materials, the melting and freezing temperature, latent heat of wood–plastic composite indicated that it could be used as a building material for thermal energy storage.Wood is a natural porous material with low cost and abundant resources. It has been used as building material and furniture structural material for thousands of years.30,31 So the combination of wood and MicroPCM may produce a building energy-saving material with good performance. There are many nano- to micron-scale pores in wood, and these pores are interconnected, which provides possibility for introducing PCM into wood. Barreneche et al.32 filled paraffin wax into wood to prepare a novel PCM/wood composite which can effectively regulate indoor temperature, but results showed that leakage still appeared due to the direct impregnation of PCM into wood without any protection method. However, as an independent and stable functional unit, MicroPCM can not only give wood durable energy storage performance, but also the form-stable property. Jeong et al.33 mixed adhesive and MicroPCM for the synthesis of composite wood floor, the prepared wood floor had good bonding strength, but the improvement of thermal quality for wood floor was not obviously because of the low loading of MicroPCM. Guo et al.34 prepared the PEG modified MicroPCM and mixed it with wood flour/high density polyethylene (WF/HDPE) to prepare the thermal energy storage wood plastic composite (TES-WPC). The melting and cooling temperature of TES-WPC were 27.2 and 11.3 °C, respectively, which indicated that the supercooling was negative for its application. Mathis et al.35 selected red oak (Quercus rubra L.) and sugar maple (Acer saccharum Marsh.) as the base materials to prepare TES wood. The results showed that red oak had a higher enthalpy, but just about 7.6 J g−1 in the temperature range of 28.5 and 31.5 °C, indicating that PCM could not enter the wood effectively due to the high density and low porosity of this two kinds of wood.
So in this study, we prepared a phase change energy storage wood (PCESW) combining balsa wood and MicroPCM. Balsa is generally used as model material because of its low density and high porosity. And in order to getting a much higher porosity, delignification was carried out by using sodium hydroxide and sodium sulfite mixed solution. The impregnation of MicroPCM was realized through vacuum method. The prepared PCESW were characterized by scanning electron microscopy (SEM), differential scanning calorimetry (DSC), thermogravimetric analysis (TG) and laser flash analyzer (LFA) to analysis the morphology, microstructure and thermal performance of MicroPCM and PCESW.
2 Experimental
Materials
Balsa wood (Ochroma lagopus Swartz) was purchased from Shanghai Feiheng Trading Co., Ltd. Sapwood of balsa was used as the matrix material and its average density was 0.138 g cm−3. MicroPCM emulsion (solid content: 53.34%) was provided by Micro Delivery Smart Microcapsule Sci & Tech Co. Lid., Anhui. According to the information published by the company, the wall material of MicroPCM was formed by two N-alkyl acrylamide monomers. Chemicals, including sodium hydroxide and sodium sulfite were all analytical grade reagents, purchased from Shanghai Aladdin Bio-Chem Technology Co., Ltd.Delignification of wood
The delignification of wood was realized by using NaOH (2.5 mol L−1) and Na2SO3 (0.4 mol L−1) mixed solution. Use a circular saw to cut balsa wood into wood blocks with a size of 20 × 20 × 20 mm, the wood blocks were immersed in the solution and boiled for 36 h and then washed in hot deionized water to remove the residual reagents. The delignified wood (DLW) specimens were preserved in ethanol for further use.Infiltration of MicroPCM
As shown in Table 1, the DLW specimens were impregnated in six different solid content MicroPCM emulsions. Graphene was added in order to improve the thermal conductivity of PCESW. The impregnation was realized by vacuum method. Briefly, impregnation emulsions with different solid content were prepared using the purchased MicroPCM emulsion. 10 samples of each group were placed in the beaker and followed by adding 840 mL MicroPCM emulsion. The DLW was vacuumized for 30 min to remove the gas and ethanol inside of the wood. Then the vacuum was removed to let the solution fill the inside space of wood. This process was repeated three times. Finally, the samples were cleaned and dried at 30 °C for 96 h.| Sample | MicroPCM content of emulsion (wt%) | Graphene (wt%) |
|---|---|---|
| a OW-40 represents the group that wood treated without delignification. | ||
| OW-40 | 40 | — |
| PCESW-15 | 15 | — |
| PCESW-20 | 20 | — |
| PCESW-25 | 25 | — |
| PCESW-30 | 30 | — |
| PCESW-35 | 35 | — |
| PCESW-40 | 40 | — |
| PCESW-40-G | 40 | 0.2 |
Characterization
The morphologies and microstructures of MicroPCM, DLW and PCESW were observed by a Hitachi (Hitachi SU8010, JPN) SEM at 3 kV. The DLW and PCESW samples are taken from the cross section in the middle of the wood block. All samples were bonded to the sample stages and sprayed with gold prior to the examination.The average diameter of MicroPCM was measured with a laser particle size analyzer (Mastersizer 3000, UK). The dispersant was deionized water and results were collected after ultrasonic treatment.
Porosity change of balsa wood before and after delignification was tested by mercury intrusion method. The mercury filling pressure was 0.5 psia with an equilibration time of 10 s.
Phase change properties of MicroPCM and PCESW were carried out by using a Q2000 (TA, USA) DSC analyzer. The particle size of PCESW flour was about 40–60 mesh. And the temperature range was −10–50 °C with a heating or cooling temperature rate of 5 °C min−1 under nitrogen atmosphere.
Thermal stability of the MicroPCM and PCESW were analyzed by TG (Q5000IR, USA) in the temperature range of 30–600 °C at a heating rate of 10 °C min−1 under nitrogen atmosphere.
Thermal durability of the PCESW was performed by using oven and refrigerator for melting–freezing cycles. The beaker containing PCESW was placed in an oven at 45 °C for 30 min to carry out the melting process, and then immediately placed in a refrigerator at −20 °C for 30 min to suffer the freezing process, thermal properties of PCESW was recorded after 100 times.
The thermal conductivities of wood, MicroPCM, PCESW-40 and PCESW-40-G were measured by laser flash analyzer (Netzsch LFA 467, GER). The samples were cut to 10 × 10 × 1 mm and tested at 30 °C.
3 Results and discussion
Characterization of MicroPCM
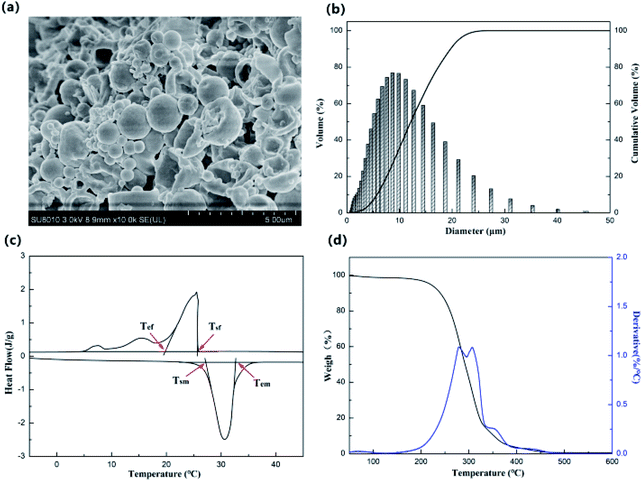
The morphology of MicroPCM is shown in Fig. 1a. Most of the MicroPCM were spherical with a smooth surface. Just a small number of MicroPCM were burst due to the pressure during fabrication or drying process. The diameter of MicroPCM was distributed in the range of 0.9–45.6 μm and the average diameter was 6.5 μm, which indicated that it is possible for MicroPCM to get into the wood vessels (Fig. 1b).The DSC and TG curves of MicroPCM are shown in Fig. 1c and d. It can be seen that MicroPCM exhibited obvious endothermic and exothermic phenomenon during the temperature changing progress. The start (Tsm) and end temperature (Tem) of melting process were 25 and 40 °C, respectively (Fig. 1c). For the freezing progress, the start (Tsf) and end temperature (Tef) were 27.3 and 19.9 °C, respectively. This indicated that the phase change temperature range of MicroPCM fits the comfortable temperature zone of human body. Besides, the enthalpies of melting and freezing process were 129.3 and 124.7 J g−1, respectively, which meant an outstanding energy storage capacity.
Fig. 1d shows the TG and DTG curves of MicroPCM. It can be seen from the figure that there was a sharp weight decrease stage between 195 and 325 °C, which was related to the decomposition of MicroPCM core material. From the DTG curve it can be found that there appeared another small weight loss stage at 331–370 °C, which was related to the decomposition of wall materials. The weight loss of MicroPCM was 2.5% when temperature below 100 °C, which meant that it had excellent thermal stability when used at room temperature.
Effect of delignification on wood
The microstructure of balsa wood and DLW are shown in Fig. 2. It can be seen that DLW retained the honeycomb-like structure after delignification. However, deformation and shrinkage were occurred due to the lack of lignin (Fig. 2b). Fig. 2c shows the pore size distribution of natural wood and DLW. The balsa wood had abundant pore structure and diameter of these lumina mainly ranging from 1–20 and 75–370 μm, compared with other wood, it has larger pore size distribution.36 After delignification, the average diameter of DLW increased from 2.7 μm to 4.3 μm. The porosity also increased 18.2%. As seen in Fig. 2b, the microstructure of DLW became loose and a large number of big holes in the rage of 250 and 300 μm were appeared. All these changes provided possibility for the incorporation of MicroPCM and DLW.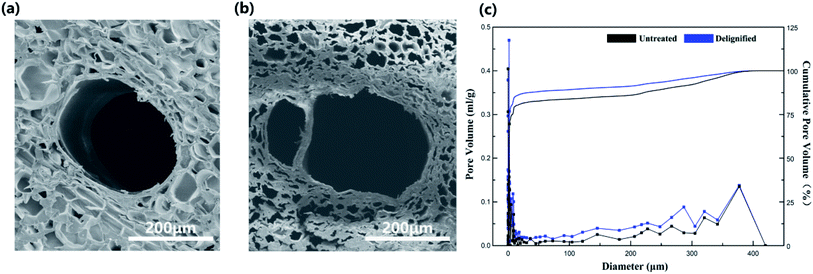 | ||
| Fig. 2 SEM images of balsa wood (a) and delignified wood (b), (c) pore size distribution of balsa wood and delignified wood. | ||
Distribution of MicroPCM in wood
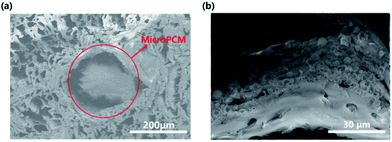
Fig. 3 shows the cross-sectional SEM image of PCESW. It is obvious that MicroPCM had got into the wood successfully and filled the wood vessels (Fig. 3a). But the MicroPCM were just found in big vessels rather than all wood cells. The reason could be attributed to the poor connectivity of wood pores and the big size of MicroPCM. Besides, aggregation of MicroPCM was found in the vessel and this uneven distribution of MicroPCM may lead to the inhomogeneous heat transmission of wood.Heat storage capacity
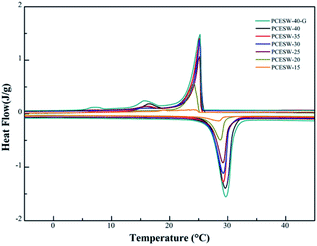
The energy storage capacity of MicroPCM, PCESW-40-G, PCESW-40, OW-40 and wood are shown in Fig. 4 and Table 2. Natural wood had no endothermic and exothermic peaks during the heating or cooling process, but the peaks appeared after the incorporation of MicroPCM, so it indicated that the energy storage capacity of PCESW was mainly from MicroPCM. The melting and freezing enthalpies of PCESW-40 were 36.1 and 35.1 J g−1, respectively, which increased by 99.4% and 106.5%, respectively, compared to OW-40. The reason could be attributed to the higher porosity after delignification which provide more space for MicroPCM loading. Further, after the addition of graphene, the melting and freezing enthalpies increased to 44.3 and 42.5 J g−1, respectively, which proved that the graphene could enhance the energy storage capacity of PCESW. One reason for this phenomenon was that graphene improved the thermal conductivity of PCESW and prevented the damage of MicroPCM resulted by inhomogeneous heat transmission. Another was graphene powder blocked the vessels of the wood and prevented the PCM leaking resulted by ruptured MicroPCM. There was no significant difference of phase change temperatures between MicroPCM and PCESW (Fig. 4a). But the temperature of PCESW-40-G was more closely resemble the MicroPCM, which also benefited the high thermal conductivity of graphene. The enthalpy of PCESW gradually improved with the increase of MicroPCM solution content. And the phase change temperature also changed slightly (Fig. 4b).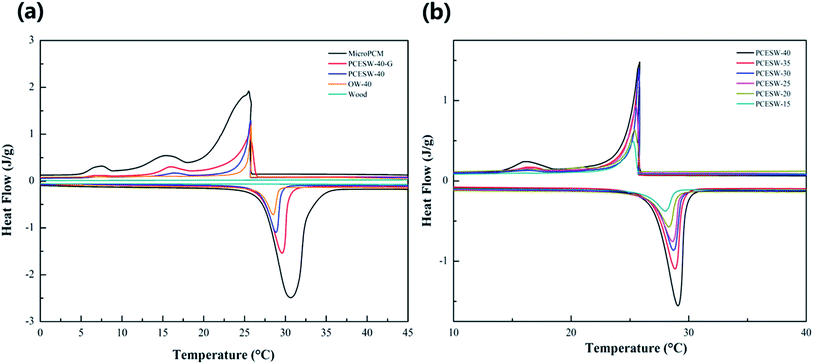 | ||
| Fig. 4 DSC curves of PCESW-40, MicroPCM, natural wood, OW-40, PCESW-40-G (a) and PCESW with different MicroPCM emulsion concentrations (b). | ||
| Labeling | Melting | Solidifying | ||||
|---|---|---|---|---|---|---|
| Onset temperature (°C) | Peak temperature (°C) | Latent heat (J g−1) | Onset temperature (°C) | Peak temperature (°C) | Latent heat (J g−1) | |
| a Values in the parentheses represent the enthalpy of the composite after experiencing 100 heating–cooling cycles. | ||||||
| MicroPCM | 27.3 | 30.6 | 129.3 ± 4.1 (123.6 ± 4.4) | 25.7 | 25.5 | 124.7 ± 3.8 (119.1 ± 3.6) |
| OW-40 | 27.0 | 29.0 | 18.1 ± 8.2 | 25.2 | 25.1 | 17.0 ± 7.9 |
| PCESW-15 | 26.6 | 28.7 | 13.3 ± 3.4 (12.5 ± 3.8) | 24.5 | 24.2 | 12.9 ± 2.9 (11.7 ± 3.2) |
| PCESW-20 | 26.8 | 29.1 | 21.3 ± 3.4 (20.9 ± 3.7) | 25.1 | 24.6 | 20.4 ± 3.2 (19.6 ± 3.4) |
| PCESW-25 | 26.9 | 29.2 | 26.5 ± 7.1 (26.0 ± 7.3) | 25.3 | 25.0 | 25.6 ± 6.3 (24.9 ± 6.9) |
| PCESW-30 | 27.0 | 29.6 | 30.7 ± 6.1 (29.8 ± 6.3) | 26.3 | 25.9 | 29.9 ± 5.3 (29.1 ± 5.1) |
| PCESW-35 | 27.1 | 29.3 | 34.2 ± 4.4 (33.4 ± 4.7) | 25.4 | 25.2 | 33.3 ± 4.0 (31.9 ± 4.5) |
| PCESW-40 | 27.2 | 29.3 | 36.1 ± 5.7 (35.3 ± 6.3) | 25.4 | 25.3 | 35.1 ± 5.2 (33.8 ± 5.8) |
| PCESW-40-G | 27.2 | 29.5 | 44.3 ± 7.4 (43.9 ± 8.0) | 25.6 | 25.3 | 42.5 ± 7.0 (42.3 ± 7.3) |
Thermal stability
The TG curves of MicroPCM, natural wood and PCESW are shown in Fig. 5a. The evaporation of water led to the initial decrease of weight and followed by the decomposition of wood and MicroPCM. Thermal decomposition of MicroPCM core material and wood hemicellulose corresponded to the temperature range of 210–300 °C, cellulose thermal decomposition corresponded to 290–350 °C, the thermal decomposition temperature of MicroPCM wall material and a small amount of residual lignin is 310–500 °C.37,38 As shown in Fig. 5b, the weight loss ratio of PCESW changed slightly with the increasing MicroPCM content, and all PCESW had almost no weight loss below 100 °C, which indicating that the PCESW composite had excellent thermal stability at room temperature.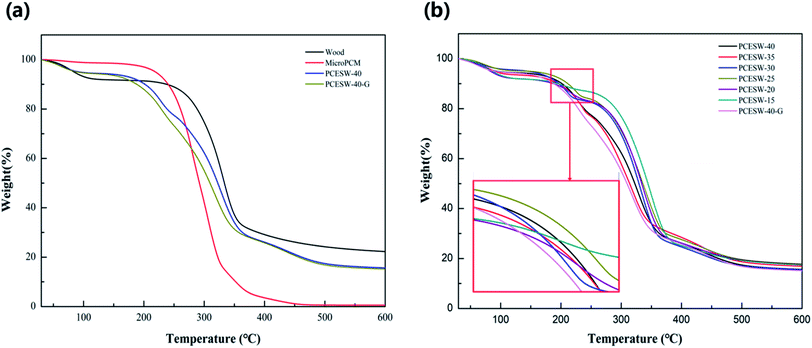 | ||
| Fig. 5 TG curves of MicroPCM, wood and PCESW (a) and PCESW with different MicroPCM emulsion concentrations (b). | ||
Thermal cycling
Thermal durability of PCESW was measured by using heating–cooling cycling test (Fig. 6). The enthalpy values of PCESW after 100 cycles are shown in Table 2. The enthalpy values of PCESW decreased slightly after the thermal cycles, and the phase change temperature also just changed a little. The enthalpy change of different PCESW was between 0.90% and 9.30%, indicating that the PCESW composite had great thermal durability. One point should be noted that the value change of PCESW-40-G was the smallest, which indicated that the blocking effect of graphene powder in wood was positive for reducing the leakage of PCM in phase transformation process.Thermal conductivity
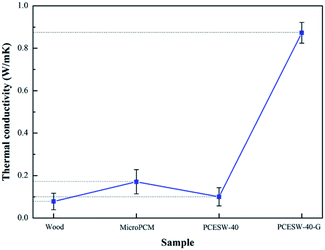
Usually, thermal conductivity of indoor building materials should be low because of the need for thermal insulation, but for PCESW, the thermal conductivity needs to be improved in order to achieve the heat transmission rapidly and keep a comfortable room temperature. In Fig. 7, thermal conductivity of nature wood and PCESW-40 were 0.078 and 0.10 W m−1 K−1, respectively. After the addition of graphene, thermal conductivity of PCESW-40-G was 0.873 W m−1 K−1, which increased about 773% than PCESW. The enhancement should be attributed to the high thermal conductivity of graphene.4 Conclusions
Phase change energy storage wood could be prepared by using wood as matrix and MicroPCM as energy storage unit. MicroPCM got into the delignified wood successfully and mainly distributed in the vessels. PCESW had outstanding energy storage capacity and it could be adjusted by changing the MicroPCM content in wood. Thermal performance showed the PCESW has suitable phase change temperature which fits the human comfortable temperature range. TG test showed the PCESW had great thermal stability when used at room temperature. Heating–cooling cycles indicated the PCESW had excellent thermal durability. The addition of graphene improved the thermal conductivity greatly. Because of the superior energy storage capacity of PCESW, it was suggested to be used as indoor temperature regulating material for building energy conservation. Further research should be focus on the optimization of MicroPCM with smaller particle size, higher enthalpy value and suitable phase change temperature. And the practical heat storage capacity of PCESW by building a model to simulate the real environment.Conflicts of interest
There are no conflicts to declare.Acknowledgements
This study was financially supported by the National Key R&D Planning Projects in China (2017YFD0601105) and the scientific research development fund project of Zhejiang Agriculture & Forestry University (2018FR042).Notes and references
- S. N. Palacio, K. F. Valentine and M. Wong, Appl. Energy, 2014, 129, 228–237 CrossRef.
- H. Omrany and A. Ghaffarianhoseini, Renewable Sustainable Energy Rev., 2016, 1252–1269 CrossRef.
- F. Pacheco-Torgal, Renewable Sustainable Energy Rev., 2017, 71, 618–629 CrossRef.
- J. E. Mason, Energy Policy, 2007, 35(2), 1315–1329 CrossRef.
- A. Sharma, V. V. Tyagi and C. R. Chen, Renewable Sustainable Energy Rev., 2009, 13, 318–345 CrossRef CAS.
- A. M. Khudhair and M. M. Farid, Energy Convers. Manage., 2004, 45, 263–275 CrossRef CAS.
- M. M. Farid, A. M. Khudhair, S. A. K. Razack and S. Al-Hallaj, Energy Convers. Manage., 2004, 45, 1597–1615 CrossRef CAS.
- A. F. Regin, S. Solanki and J. Saini, Renewable Sustainable Energy Rev., 2008, 12(9), 2438–2458 CrossRef CAS.
- L. Feng, J. Zheng, H. Yang, Y. Guo, W. Li and X. Li, Sol. Energy Mater. Sol. Cells, 2011, 95, 644–650 CrossRef CAS.
- C. Chen, K. Liu, H. Wang, W. Liu and H. Zhang, Sol. Energy Mater. Sol. Cells, 2013, 117, 372–381 CrossRef CAS.
- S. F. Li, Z. H. Liu and X. J. Wang, Appl. Energy, 2019, 255, 113667 CrossRef.
- C. Wang, L. Feng, W. Li, J. Zheng, W. Tian and X. Li, Sol. Energy Mater. Sol. Cells, 2012, 105, 21–26 CrossRef CAS.
- L. Shuo and Z. Dong, Chemistry, 2008, 12, 906–911 Search PubMed.
- A. Sari, Energy Convers. Manage., 2016, 117, 132–141 CrossRef CAS.
- G. Ferrer, A. Sol, C. Barreneche, I. Martorell and L. F. Cabeza, Renewable Sustainable Energy Rev., 2015, 50, 665–685 CrossRef CAS.
- W. Su, J. Darkwa and G. Kokogiannakis, Renewable Sustainable Energy Rev., 2015, 48, 373–391 CrossRef CAS.
- Y. Hong and G. Xin-shi, Sol. Energy Mater. Sol. Cells, 2000, 64, 37–44 CrossRef CAS.
- G. Fang, Z. Chen and H. Li, Chem. Eng. J., 2010, 63, 154–159 CrossRef.
- B. P. Yang, M. Y. Xi, J. F. Cui, J. H. Guo and Z. Cui, Appl. Chem. Ind., 2014, 43(1), 118–120 CAS.
- V. V. Tyagi, S. C. Kaushik, S. K. Tyagi and T. Akiyama, Renew. Sustain. Energy Rev., 2011, 15, 1373–1391 CrossRef CAS.
- H. Zhang and X. Wang, Sol. Energy Mater. Sol. Cells, 2009, 93, 1366–1376 CrossRef CAS.
- E. Fallahi, M. Barmar and M. H. Kish, Iran. Polym. J., 2010, 19, 277–286 CAS.
- L. X. Wang, L. Ren and J. F. Su, Mater. Rev., 2003, 17, 141–144 Search PubMed.
- Y. Ozonur, M. Mazman, H. Ö. Paksoy and H. Evliya, Int. J. Energy Res., 2006, 30, 741–749 CrossRef CAS.
- S. H. Ye, Y. Q. Guo, S. H. Lu and M. C. Chen, Polym. Mater. Sci. Eng., 2004, 20(5), 6–9 Search PubMed.
- N. F. Sala, E. Devaux, S. Bourbigot and P. Rumeau, J. Appl. Polym. Sci., 2008, 107(4), 2444–2452 CrossRef.
- L. F. Cabeza, A. Gutierrez, C. Barreneche and S. Ushak, Renewable Sustainable Energy Rev., 2015, 42, 1106–1112 CrossRef CAS.
- M. Hunge, A. G. Entrop and I. Mandilaras, Cem. Concr. Compos., 2009, 31, 731–743 CrossRef.
- X. Jin, J. Li, P. Xue and M. Jia, Sol. Energy Mater. Sol. Cells, 2014, 130, 435–441 CrossRef CAS.
- D. N. S. Hon and N. Shiraishi, Wood and Cellulosic Chemistry, CRC Press, 2000 Search PubMed.
- H. Zhu, W. Luo, P. N. Ciesielski, Z. Fang, J. Zhu, G. Henriksson, M. E. Himmel and L. Hu, Chem. Rev., 2016, 116(16), 9305–9374 CrossRef CAS PubMed.
- C. Barreneche, J. Vecstaudza, D. Bajare and A. I. Fernandez, IOP Conf. Ser.: Mater. Sci. Eng., 2017, 251(1), 012111 Search PubMed.
- S. G. Jeong, J. Jeon, J. Seo, J. H. Lee and S. Kim, Energy Convers. Manage., 2012, 64, 516–521 CrossRef CAS.
- X. Guo, J. Z. Cao, Y. Peng and R. Liu, Mater. Des., 2016, 89, 1325–1334 CrossRef CAS.
- D. Mathis, P. Blanchet, V. Landry and P. Lagière, Appl. Sci., 2018, 8(12), 2696 CrossRef CAS.
- Q. L. Fu, L. L. Medina, Y. Y. Li, F. Carosio, A. Hajian and L. A. Berglund, ACS Appl. Mater. Interfaces, 2017, 9(41), 36154–36163 CrossRef CAS PubMed.
- E. D. Tomak, E. Baysal and H. Peker, Thermochim, 2012, 547, 76–82 CrossRef CAS.
- M. Brebu and C. Vasile, Cellul. Chem. Technol., 2010, 44, 353–363 CAS.
| This journal is © The Royal Society of Chemistry 2020 |

