 Open Access Article
Effect of activation ratio on the characteristics of AC derived from anaerobic digester residue and its applications in supercapacitors†
Wentao Wua,
Lele Zhanga,
Ce Wanga,
Jin Wanga,
Jiang Qiana,
Shaomin Songb and
Zhengbo Yue *a
*a
aSchool of Resources and Environmental Engineering, Hefei University of Technology, Hefei, Anhui, China 230009. E-mail: zbyue@hfut.edu.cn; Fax: +86-551-62901524; Tel: +86-551-62901523
bAnhui Huawei New Energy Co., Ltd, Wuhu, Anhui, China 241080
First published on 3rd February 2020
Abstract
Anaerobic digestion biogas residue contains a large amount of lignocellulose, and is a potential valuable biomass source. In the current study, activated carbon (AC) for supercapacitor electrodes was prepared with the anaerobic digestion residue collected from an anaerobic digester, with cow dung as the feedstock. The effects of activation ratio on the specific surface area, pore size distribution and electrochemical performance of AC were investigated. The results show that AC from the anaerobic digestion biogas residue could be used as a supercapacitor electrode material. The activated carbon obtained at the activation ratio of 3 has higher specific capacitance and good capacitance performance. The good electrochemical performance confirms that the anaerobic dry fermentation residue can be used as a good porous carbon electrode material for supercapacitors.
1. Introduction
Anaerobic digestion has been applied to treat large quantities of renewable lignocellulose biomass. In addition to methane, biogas residues will be generated in the process of anaerobic digestion.1 Anaerobic digester biogas residue is rich in inorganic nutrients, namely, N, K and P, which can be used as soil amendments and crop fertilizers; also, they can be used in cultivating edible fungi and aquaculture.2–4 However, anaerobic digester biogas residue might bring the potential environmental risk since it contains heavy metals, organic pollutants, antibiotics, insecticides and pathogenic bacteria.5 Such random accumulation may also pollute water bodies.6 Therefore, the utilization of the anaerobic digester biogas residue in eco-environmental and effectively ways is a matter of concern of researchers.Recently, activated carbon (AC) was used for the preparation of electrode materials for supercapacitors because of its easy preparation, high specific surface area, rich pore structure and good electrical conductivity.7 Compared with the traditional fossil energy, the development of lignocellulose biomass-derived AC has aroused great interest of researchers due to the advantages of low cost and environment-friendliness.8 Anaerobic digester biogas residue contains a large amount of lignocellulose, so it can be regarded as a new source of biomass for AC preparation. In the preparation process, the activation ratio is one of the major factors influencing the electrochemical performance of activated carbon electrodes. Ma et al. in 2015 found that the activation ratio influenced the pore structure and oxygen content of activated carbon.9 Serafin in 2019 illustrated the influence of the mass ratio of the lumpy bracket to KOH on the characteristics of nanoporous activated biocarbons.10 The distribution of pore structures will further influence the capacity of supercapacitors. Hence, in the current study, AC was prepared using digester residues and further applied to prepare supercapacitor electrode materials. The effect of activation ratio on the physical and chemical properties of AC was studied. Cyclic voltammetry (CV), constant current charging/discharge (GCD) and electrochemical impedance spectroscopy (EIS) were used to evaluate the electrochemical properties of supercapacitors.
2. Materials and methods
2.1. Preparation of activated carbon
Anaerobic digester biogas residue used in the experiment was gathered from a farm in Suzhou, Anhui Province, China. The biomass residue was pre-carbonized at 800 °C for 1 h under nitrogen flow. Then, the pre-carbonized sample was mixed with KOH at mass ratios of 1![[thin space (1/6-em)]](https://www.rsc.org/images/entities/char_2009.gif) :
:![[thin space (1/6-em)]](https://www.rsc.org/images/entities/char_2009.gif) 0, 1
0, 1![[thin space (1/6-em)]](https://www.rsc.org/images/entities/char_2009.gif) :
:![[thin space (1/6-em)]](https://www.rsc.org/images/entities/char_2009.gif) 1, 1
1, 1![[thin space (1/6-em)]](https://www.rsc.org/images/entities/char_2009.gif) :
:![[thin space (1/6-em)]](https://www.rsc.org/images/entities/char_2009.gif) 2, 1
2, 1![[thin space (1/6-em)]](https://www.rsc.org/images/entities/char_2009.gif) :
:![[thin space (1/6-em)]](https://www.rsc.org/images/entities/char_2009.gif) 3 and 1
3 and 1![[thin space (1/6-em)]](https://www.rsc.org/images/entities/char_2009.gif) :
:![[thin space (1/6-em)]](https://www.rsc.org/images/entities/char_2009.gif) 4 in 200 ml deionized water. Then, these solutions were kept at 85 °C for 10 h in water bath. The achieved mixture was then filtered and dried in the air. The dried solid sample was further heated at 600 °C for 2 h. The resulting materials were pickled and washed until the pH became neutral. Finally, the obtained activated carbon was dried and ground into powder through 200 mesh sieves and represented as AC-0, AC-1, AC-2, AC-3, and AC-4 according to the activation ratio.
4 in 200 ml deionized water. Then, these solutions were kept at 85 °C for 10 h in water bath. The achieved mixture was then filtered and dried in the air. The dried solid sample was further heated at 600 °C for 2 h. The resulting materials were pickled and washed until the pH became neutral. Finally, the obtained activated carbon was dried and ground into powder through 200 mesh sieves and represented as AC-0, AC-1, AC-2, AC-3, and AC-4 according to the activation ratio.
2.2. Analytical methods
The morphology and structure of the samples were imaged using FEI Nova Nano SEM 450. FTIR (Varian 600-IR) and XPS (Thermo Scientific ESCALAB 250) were used to characterize elementals and surface functional groups. The porosity properties of the samples were obtained using an ASAP 2020 V3.0H instrument. The specific surface area of the samples was obtained via BET analysis, and pore size distribution data were calculated by DFT.Initially, 80 wt% AC, 10 wt% acetylene black and 10 wt% polytetrafluoroethylene were mixed to obtain a viscous slurry, which was then pressed onto a nickel foam current collector (1.0 cm2) to form a working electrode. The electrochemical properties of the working electrode were measured on a CHI 660D electrochemical workstation (Shanghai Chenhua Instruments Co.) with a three-electrode system in 6 M KOH electrolyte at room temperature. The CV curves were obtained with the scanning rate from 5 to 200 mV s−1. The GCD measurement was performed with a current density range of 0.5–10 A g−1. EIS measurements were recorded at a frequency range from 10 kHz to 10 mHz at open circuit potential with the current amplitude of 5 mV. The specific capacitance and coulomb efficiency were calculated according to the previous report.11,12
3. Results and discussion
3.1. Porous structure characterization
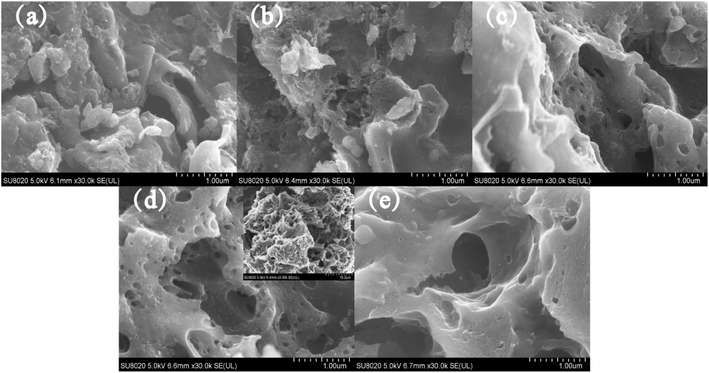
FESEM images of AC-0 clearly show that the surface of the sample was relatively smooth and the pores were almost invisible (Fig. 1a). With the increase in activation ratio, the surface of activated carbon became rough; also, honeycomb pores appeared, and the pore size increased (Fig. 1b–e). However, when the activation ratio was increased to 4, the ablation of AC intensified (Fig. 1e). In addition, the pore size became larger and some pores collapsed into the structure between the layers, which resulted in fewer pores. This indicated that the pore structure and morphology of porous carbon can be controlled by changing the activation ratio in the process of preparing activated carbon.According to the IUPAC classification, two types of Langmuir isotherms, namely, type-I and type-IV constituted the adsorption isotherms of all the AC samples (Fig. 2a). Such results illustrated the simultaneous presence of micropores and mesopores.13,14 The AC derived from biogas residue had both micropores and mesopores regardless of the activation ratio (Fig. 2a). The adsorption capacity of AC-0 was the lowest and the pore structure was also extremely underdeveloped and can be mainly expressed as micropores (Fig. 2). Meanwhile, AC-3 had the maximum adsorption capacity. The pore sizes became larger and the pores gradually changed from micropores to the composite multi-pore structure (Fig. 2b). The specific surface area and pore structure features of AC samples are listed in Table 1. AC-3 exhibited the maximum specific surface area of 942 m2 g−1 and the specific surface area ratio of micropores to mesopores was the lowest (3.36) among the AC samples. This confirmed that AC-3 contained a large number of micropores and some mesopores, which was consistent with the results predicted by FESEM (Fig. 1).
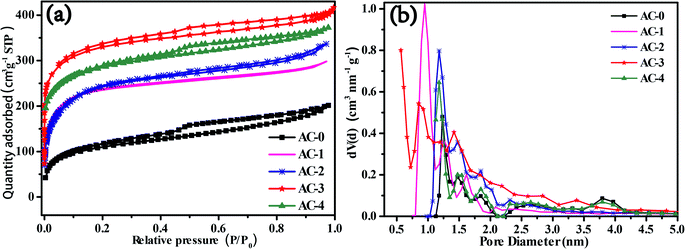 | ||
| Fig. 2 (a) Adsorption/desorption isotherms and (b) pore size distribution curves of AC-0, AC-1, AC-2, AC-3 and AC-4. | ||
| Samples | SBETa [m2 g−1] | Smicb [m2 g−1] | Vtotalc [cm3 g−1] | Vmicrod [cm3 g−1] | Davere [nm] | Smic/Smes |
|---|---|---|---|---|---|---|
| a SBET is the specific surface area from multiple BET method.b Smic is the microporous specific surface area from t-plot method.c Vtotal is the total volume calculated at a relative pressure of 0.999.d Vmic is the microporous volume from t-plot method.e Daver is the average pore width from the equation 4Vtotal/SBET. | ||||||
| AC-0 | 351 | 289 | 0.314 | 0.284 | 3.58 | 4.66 |
| AC-1 | 746 | 602 | 0.593 | 0.340 | 3.18 | 4.18 |
| AC-2 | 817 | 656 | 0.648 | 0.362 | 3.17 | 4.07 |
| AC-3 | 942 | 726 | 0.712 | 0.371 | 3.02 | 3.36 |
| AC-4 | 892 | 703 | 0.675 | 0.327 | 3.03 | 3.71 |
3.2. XRD characterization
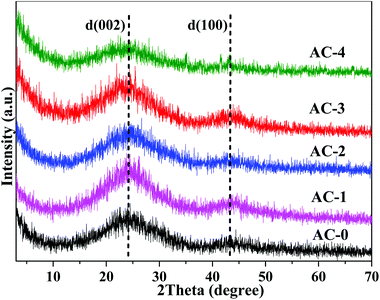
As shown in Fig. 3, the activation ratio affected the crystalline structure of the AC samples. The layer pitch of the 002 diffraction peak of AC-0 was about 0.339 nm, which was close to that of graphite, and the sample had a relatively complete graphite interlayer structure.15 With the increase in the activation ratio, the peak position of the (002) diffraction peak tends to shift left and the peak intensity became weaker. When the activation ratio was 4, the spacing of the graphite layer ((002) diffraction peak) was much larger than that of the complete graphite spacing of 0.335 nm. Moreover, the (002) diffraction peak was wider than that in the other sample. These results indicated that the graphite-crystalline structure of the activated carbon material was destroyed by the activating agent.3.3. XPS characterization
XPS survey spectra of all the AC samples showed the high-resolution peaks of C 1s, O 1s and N 1s, which demonstrated that heteroatom doping happened (Fig. 4 and S2†).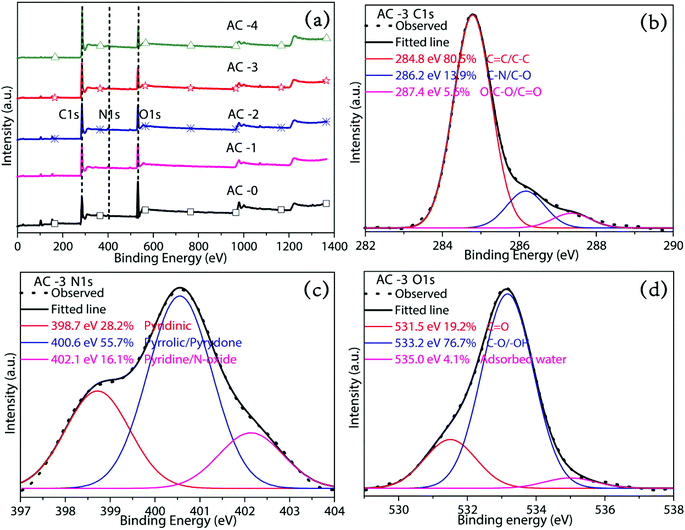 | ||
| Fig. 4 (a) XPS full spectra of AC-0, AC-1, AC-2, AC-3 and AC-4 and (b) C 1s, (c) N 1s and (d) O 1s spectra of AC-3. | ||
The elemental composition of all the obtained AC samples by XPS is showed in the Table 2. The high-resolution C 1s spectra of all AC samples are decomposed into three peaks at 284.8 ± 0.3, 286.8 ± 0.3 and 287.6 ± 0.3 eV, ascribed to the functional groups C![[double bond, length as m-dash]](https://www.rsc.org/images/entities/char_e001.gif) C/C–C, C–N/C–O and O–C–O/C
C/C–C, C–N/C–O and O–C–O/C![[double bond, length as m-dash]](https://www.rsc.org/images/entities/char_e001.gif) O, respectively.16 The N 1s spectrum can be deconvoluted into those ascribed to different kinds of nitrogen groups at 398.7 ± 0.3 eV, 400.4 ± 0.3 eV, 401.8 ± 0.4 eV and 402–405 eV, corresponding to pyridinic N (N-6), pyrrolic/pyridone N (N-5), quaternary N (N-Q) and N-oxide (N-X). The main nitrogen-containing functional groups on the surface of AC samples were N-6 and N-5 (Fig. 4c and S2†). These groups mainly contributed to pseudo-capacitance and can increase the specific capacitance.17,18 Meanwhile, quaternary N may play a very important role in improving electron transfer. The high resolution O 1s spectrum of the samples can be deconvoluted into C
O, respectively.16 The N 1s spectrum can be deconvoluted into those ascribed to different kinds of nitrogen groups at 398.7 ± 0.3 eV, 400.4 ± 0.3 eV, 401.8 ± 0.4 eV and 402–405 eV, corresponding to pyridinic N (N-6), pyrrolic/pyridone N (N-5), quaternary N (N-Q) and N-oxide (N-X). The main nitrogen-containing functional groups on the surface of AC samples were N-6 and N-5 (Fig. 4c and S2†). These groups mainly contributed to pseudo-capacitance and can increase the specific capacitance.17,18 Meanwhile, quaternary N may play a very important role in improving electron transfer. The high resolution O 1s spectrum of the samples can be deconvoluted into C![[double bond, length as m-dash]](https://www.rsc.org/images/entities/char_e001.gif) O (531.5 ± 0.3 eV), C–O/–OH (533.3 ± 0.3 eV) and adsorbed water (535 ± 0.3 eV).16–19 These oxygen-containing functional groups can take part in the faradaic reactions to yield pseudo-capacitance and raise the wettability of AC samples.
O (531.5 ± 0.3 eV), C–O/–OH (533.3 ± 0.3 eV) and adsorbed water (535 ± 0.3 eV).16–19 These oxygen-containing functional groups can take part in the faradaic reactions to yield pseudo-capacitance and raise the wettability of AC samples.
| Sample | C (wt%) | N (wt%) | O (wt%) |
|---|---|---|---|
| AC-0 | 80.09 | 4.72 | 15.19 |
| AC-1 | 74.3 | 3.93 | 21.77 |
| AC-2 | 77.13 | 2.89 | 19.98 |
| AC-3 | 79.57 | 2.65 | 17.78 |
| AC-4 | 79.23 | 2.25 | 18.52 |
3.4. Electrochemical properties of AC as a supercapacitor electrode material
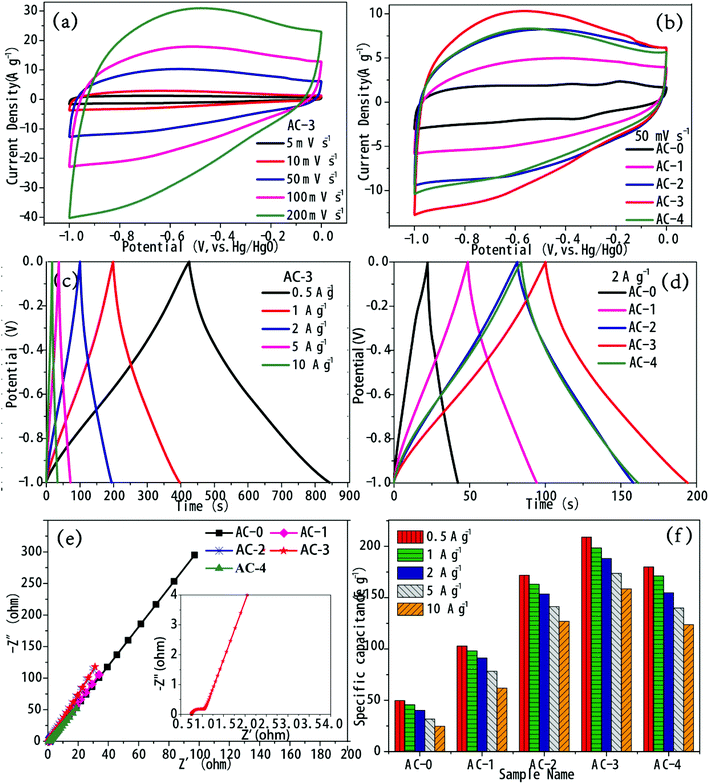
In order to evaluate the performance of AC as a supercapacitor electrode material, electrochemical testing was performed in 6 M KOH aqueous electrolyte using a three-electrode system. The CV curves of the five AC electrodes at a scan rate of 50 mV s−1 are shown in Fig. 5b. All the CV curves appeared approximately rectangular in shape from −1.0 to 0 V, which indicated that all AC electrode materials had the ideal characteristic of electric double layer capacitance.20–22 However, the CV curves are slightly deformed, which confirmed the presence of pseudo-capacitance caused by the oxidation–reduction reaction from oxygen-containing functional groups on the carbon skeletons. The CV curve enveloping area of AC-3 revealed the highest specific capacitance. The CV curves of AC-3 within scan rates of 5–200 mV s−1 are shown in Fig. 5a. Even at a high scan rate of 200 mV s−1, AC-3 can retain a rectangular shape, indicating its good rate performance.The shapes of the GCD curves for activated AC samples were approximately straight lines and symmetric triangles at different current densities (Fig. 5c and S6†). This proved their effective charge–discharge reversibility and ideal electric double layer capacitance.23 This can be attributed to the improved hydrophilicity, lowered electrode resistance and increased pseudo-capacitance through activation by the addition of KOH. The charge–discharge time of the KOH-activated samples was higher than that of the control samples (Fig. 5d and S4†), which indicated that the specific capacitance increased after KOH activation. The charge–discharge time of AC-3 was the longest at different current densities, and it exhibited optimum electrochemical performance.
Rate performance was another factor that affected the electrochemical performance of the AC electrode materials. The specific capacitance of all the AC electrodes at different current densities is shown in Fig. 5f. The specific capacitance was calculated from the GCD curve. With the increase in activation ratio, the specific capacitance of the AC electrodes increased and reached a maximum of 198.42 F g−1 at the activation ratio of 3.
The specific capacitance of the AC-3 electrode changed from 198.42 to 158.48 F g−1 when the current density changed from 1 to 10 A g−1. The capacitance preservation rate was 79.9%, which indicated that the AC-3 electrode had good energy storage output capability.
EIS was performed and the impedance spectra of AC samples are shown in Fig. 5e. The semi-circle of the high-frequency area denoted the charge transfer resistance (Rct). The smaller the semicircle, the better the conductivity and the faster the ion transfer.24 The semi-circular arc of AC-0 was not evident in the high frequency area, indicating that the Rct of AC-0 was larger, which may be due to the increase in ion transport resistance caused by the undeveloped pores. With the increase in the activation ratio, the diameter of the semi-circular arc in the high frequency area gradually became lower, which indicated that the Rct of AC and the transport resistance of electrolyte ions decreased. Among all the samples, the semicircle of AC-3 was the smallest, so its conductivity was the best. Equivalent series resistance (ESR) is represented by intercept between the high frequency region and real axis. As can be seen from Fig. 5e, AC-3 has the lowest ERS of 0.77 Ω. These results showed that the power characteristics of AC-3 significantly improved.
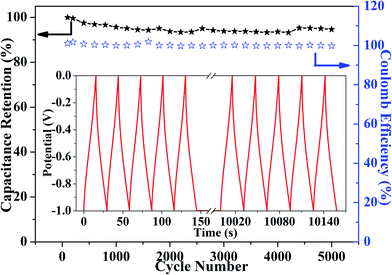
The cycle life of the AC-3 electrode material for supercapacitors is shown in Fig. 6. The results showed that the specific capacitance attenuation of the AC-3 electrode material was smaller after 5000 test cycles and the capacitance retention rate was 94.67%, which indicated that the cycling stability of AC-3 was superior and the charge–discharge reversibility was higher. This was important for commercial applications.25 Even after 5000 cycles, the coulomb efficiency of AC-3 remained at about 1.0. This fully proved that AC-3 can efficiently store charge and has high charge utilization rate. These results demonstrated that the AC-3 electrode not only had high specific capacitance, but also had good cycling stability.
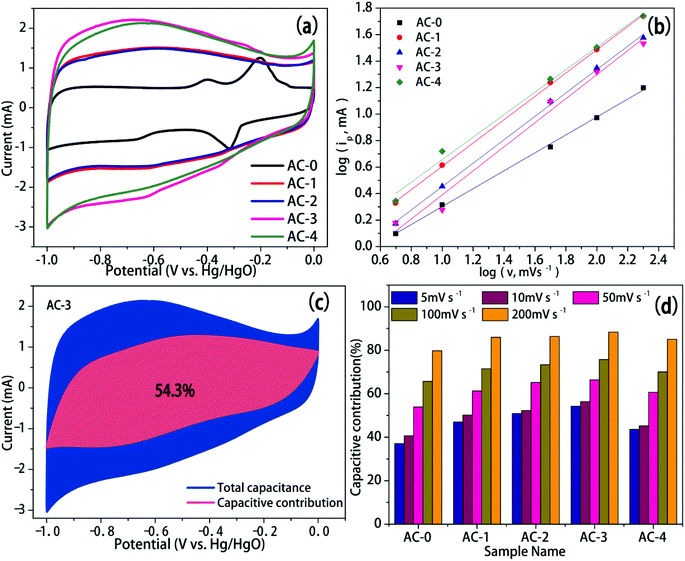
To get insight into the observed excellent capacitive performance in AC electrodes, quantitative analyses were conducted based on the recorded CV data to study the kinetical features of AC electrodes. The capacitive behavior can be identified using the relation ip = avb in another form, viz., log![[thin space (1/6-em)]](https://www.rsc.org/images/entities/char_2009.gif) ip = b × log
ip = b × log![[thin space (1/6-em)]](https://www.rsc.org/images/entities/char_2009.gif) v + log
v + log![[thin space (1/6-em)]](https://www.rsc.org/images/entities/char_2009.gif) a, where a and b are variable parameters.26 When b = 0.5, the capacitance was mainly determined by the diffusion process. When b was between 0.5 and 1, the capacitance was determined by the diffusion process and the capacitive effect. When b ≥ 1, the capacitance was determined by the capacitive processes. The peak current and scan rate of each sample was plotted to obtain the b value. As revealed in Fig. 7a, the b values for AC-0, AC-1, AC-2, AC-3 and AC-4 were 0.68, 0.88, 0.89, 0.91 and 0.85 respectively, which were all in the range of 0.5–1. This demonstrated that the diffusion-limited current and the capacitive response synergistically contribute to the electrode process, thus causing the rapid reaction kinetics. In addition, the contribution of capacitive and diffusion-controlled processes can be determined quantitatively based on the equation proposed by Dunn et al.:27
a, where a and b are variable parameters.26 When b = 0.5, the capacitance was mainly determined by the diffusion process. When b was between 0.5 and 1, the capacitance was determined by the diffusion process and the capacitive effect. When b ≥ 1, the capacitance was determined by the capacitive processes. The peak current and scan rate of each sample was plotted to obtain the b value. As revealed in Fig. 7a, the b values for AC-0, AC-1, AC-2, AC-3 and AC-4 were 0.68, 0.88, 0.89, 0.91 and 0.85 respectively, which were all in the range of 0.5–1. This demonstrated that the diffusion-limited current and the capacitive response synergistically contribute to the electrode process, thus causing the rapid reaction kinetics. In addition, the contribution of capacitive and diffusion-controlled processes can be determined quantitatively based on the equation proposed by Dunn et al.:27
| i(V) = k1v + k2v1/2 |
4. Conclusions
In this study, AC samples were successfully prepared from the anaerobic digestion biogas residue of cow manure and applied as supercapacitor electrode materials. AC samples had ordered pore size distribution, high specific capacitance and excellent cycle stability in waterborne electrolytes. The diffusion-limited current and the capacitive response synergistically contributed to the electrode performance. When the current density was 1 A g−1, the specific capacitance in an alkaline electrolyte was 198.42 F g−1. After 5000 cycles of constant current charge and discharge, the retention rate of the specific capacitance was still 94.67%. This indicated that carbon material AC-3 has good electrochemical cycling stability in an alkaline electrolyte and exhibited good development prospect as an electrode material.Conflicts of interest
There are no conflicts to declare.Acknowledgements
This study was supported partially by Fundamental Research Funds for National Key R&D Program of China (2016YFC1400605) and Anhui Huawei New Energy Co., Ltd, National Natural Science Foundation of China (U19A20108).References
- R. B. Frøseth, A. K. Bakken, M. A. Bleken, H. Riley, R. Pommeresche, K. Thorup-Kristensen and S. Hansen, Eur. J. Agron., 2014, 52, 90–102 CrossRef.
- X. Meng, J. Dai, Y. Zhang, X. Wang, W. Zhu, X. Yuan, H. Yuan and Z. Cui, J. Environ. Manage., 2018, 216, 62–69 CrossRef CAS PubMed.
- K. Möller and T. Müller, Eng. Life Sci., 2012, 12, 242–257 CrossRef.
- F. Tambone, B. Scaglia, G. D. Imporzano, A. Schievano, V. Orzi, S. Salati and F. Adani, Chemosphere, 2010, 81, 577–583 CrossRef CAS PubMed.
- T. Kupper, T. D. Bucheli, R. C. Brändli, D. Ortelli and P. Edder, Bioresour. Technol., 2008, 99, 7988–7994 CrossRef CAS PubMed.
- L. Kaluža, M. Šuštaršič, V. Rutar and G. D. Zupančič, Bioresour. Technol., 2014, 151, 137–143 CrossRef PubMed.
- X. Xu, J. Gao, Q. Tian, X. Zhai and Y. Liu, Appl. Surf. Sci., 2017, 411, 170–176 CrossRef CAS.
- A. Elmouwahidi, Z. Zapata-Benabithe, F. Carrasco-Marín and C. Moreno-Castilla, Bioresour. Technol., 2012, 111, 185–190 CrossRef CAS PubMed.
- D. Ma, G. Wu, J. Wan, F. Ma, W. Geng and S. Song, RSC Adv., 2015, 5, 107785–107792 RSC.
- J. Serafin, M. Baca, M. Biegun, E. Mijowska, R. J. Kaleńczuk, J. Sreńscek-Nazzal and B. Michalkiewicz, Appl. Surf. Sci., 2019, 497, 143722 CrossRef.
- M. Liu, W. W. Tjiu, J. Pan, C. Zhang, W. Gao and T. Liu, Nanoscale, 2014, 6, 4233 RSC.
- V. S. Jamadade, V. J. Fulari and C. D. Lokhande, J. Alloys Compd., 2011, 509, 6257–6261 CrossRef CAS.
- L. Wang, Y. Guo, B. Zou, C. Rong, X. Ma, Y. Qu, Y. Li and Z. Wang, Bioresour. Technol., 2011, 102, 1947–1950 CrossRef CAS PubMed.
- A. B. Fuertes and M. Sevilla, ACS Appl. Mater. Interfaces, 2015, 7, 4344–4353 CrossRef CAS PubMed.
- Y. Zhu, S. Murali, M. D. Stoller, K. J. Ganesh, W. Cai, P. J. Ferreira, A. Pirkle, R. M. Wallace, K. A. Cychosz, M. Thommes, D. Su, E. A. Stach and R. S. Ruoff, Science, 2011, 332, 1537–1541 CrossRef CAS PubMed.
- P. Burg, P. Fydrych, D. Cagniant, G. Nanse, J. Bimer and A. Jankowska, Carbon, 2002, 40, 1521–1531 CrossRef CAS.
- B. Xu, F. Wu, S. Chen, Z. Zhou, G. Cao and Y. Yang, Electrochim. Acta, 2009, 54, 2185–2189 CrossRef CAS.
- Y. Lee, K. Chang and C. Hu, J. Power Sources, 2013, 227, 300–308 CrossRef CAS.
- S. Liu, J. Tian, L. Wang, Y. Zhang, X. Qin, Y. Luo, A. M. Asiri, A. O. Al-Youbi and X. Sun, Adv. Mater., 2012, 24, 2037–2041 CrossRef CAS PubMed.
- L. Jiang, J. Yan, L. Hao, R. Xue, G. Sun and B. Yi, Carbon, 2013, 56, 146–154 CrossRef CAS.
- Q. Lei, H. Song, X. Chen, M. Li, A. Li, B. Tang and D. Zhou, RSC Adv., 2016, 6, 4469–4683 RSC.
- C. Zhou, X. Chen, H. Liu, J. Zhou, Z. Ma, M. Jia and H. Song, Electrochim. Acta, 2017, 236, 53–60 CrossRef CAS.
- J. Han, G. Xu, B. Ding, J. Pan, H. Dou and D. R. MacFarlane, J. Mater. Chem. A, 2014, 2, 5352–5357 RSC.
- L. L. Zhang, X. Zhao, M. D. Stoller, Y. Zhu, H. Ji, S. Murali, Y. Wu, S. Perales, B. Clevenger and R. S. Ruoff, Nano Lett., 2012, 12, 1806–1812 CrossRef CAS PubMed.
- W. Qian, F. Sun, Y. Xu, L. Qiu, C. Liu, S. Wang and F. Yan, Energy Environ. Sci., 2014, 7, 379–386 RSC.
- Y. Liu, Q. Shen, X. Zhao, J. Zhang, X. Liu, T. Wang, N. Zhang, L. Jiao, J. Chen and L. Z. Fan, Adv. Funct. Mater., 2019, 1907837, 1–11 Search PubMed.
- J. B. Cook, H. S. Kim, T. C. Lin, C. H. Lai, B. Dunn and S. H. Tolbert, Adv. Funct. Mater., 2017, 7, 2 Search PubMed.
- B. Xie, M. Yu, L. Lu, H. Feng, Y. Yang, Y. Chen, H. Cui, R. Xiao and J. Liu, Carbon, 2019, 141, 134–142 CrossRef CAS.
Footnote |
| † Electronic supplementary information (ESI) available. See DOI: 10.1039/c9ra09636a |
| This journal is © The Royal Society of Chemistry 2020 |

