DOI:
10.1039/C9RA10288D
(Paper)
RSC Adv., 2020,
10, 5428-5435
Bond-photon-phonon thermal relaxation in the M(X, X2) (M = Mo, Re, Ta, Ge, Sn; X = S, Se, and Te)
Received
8th December 2019
, Accepted 21st December 2019
First published on 3rd February 2020
Abstract
We systematically investigated the temperature-dependent bandgap energy and Raman shift on the bond length and bond energy, Debye temperature, and atomic cohesive energy for M(X, X2) via bond relaxation methods. It is revealed that the thermal decay of both bandgap energy and phonon frequency arose from the thermal integration of the specific heat of Debye approximation. The results indicate that (i) the bandgap energy relaxation is due to the thermal excitation-induced weakening of the bond energy, and the phonon frequency was just a function of bond length and bond energy; (ii) the Debye temperature determines the nonlinear range at low temperatures; (iii) the reciprocal of the atomic cohesive energy governs the linear behavior at high temperatures. Thus, the outcomes of this study include fundamental information about photon, phonon, and the thermal properties of layered semiconductors, which are crucial to develop the new generations of thermal and electronic applications of devices based on layered semiconductors.
1. Introduction
During the last two decades, numerous studies have focused on two-dimensional (2D) nanomaterials because graphene sheets1 have been produced via mechanical exfoliation to obtain unusual physical and chemical properties. More recently, graphene-like 2D nanomaterials such as metal chalcogenides and phosphorene have attracted significant interest as they can be used to manufacture new or improved field-effect transistors,2–4 optoelectronic devices,5–7 and topological superconductors.8–10 Metal chalcogenides, include metal dichalcogenides and metal monochalcogenides, whose chemical formulae are MX and MX2, respectively, where M represents a metal atom of molybdenum (Mo), tantalum (Ta), rhenium (Re), germanium (Ge) or tin (Sn); and X stands for atoms of either sulfur (S), selenium (Se), or tellurium (Te). MX has wrinkled honeycomb structures, similar to phosphorene, which shows an ultralow thermal conductivity. MX2 has a hexagonal honeycomb structure that exhibits unique electronic properties. This makes it a promising candidate material with diverse applications such as batteries,11,12 field-emission devices,13 and thermoelectric energy conversion.14,15 Hence, studying the properties of these 2D ultrathin films can have far-reaching benefits for future semiconducting devices.
The availability of a wide range of bandgaps is very beneficial for both fundamental research and semiconductor applications. A crystal of MoTe2, which belongs to the family of metal dichalcogenides, is a semiconductor with an indirect bandgap of about 1.0 eV.16 It transitions to a direct-bandgap semiconductor with an optical gap of 1.10 eV (ref. 17) when used as a monolayer. Moreover, nanomaterials based on ReSe2, SnSe2, SnS2, and GeSe2 show strong covalent bonds within very weak interlayer interactions. This means that the bandgap type of bulk material is the same as that of the monolayer. For example, bulk materials consisting of ReSe2, SnSe2 and SnS2 are indirect bandgap semiconductors with gaps of 0.92 eV (ref. 18), 1.07 eV (ref. 19), and 2.18 eV (ref. 19), respectively. However, their respective monolayer counterparts show increasing indirect bandgaps with gaps of 1.22 eV (ref. 18), 1.69 eV (ref. 19), and 2.41 eV (ref. 19). Moreover, the metal monochalcogenides such as SnS, SnSe, and GeSe are indirect bandgap semiconductors with gaps of 1.58 eV (ref. 20), 0.83 eV (ref. 21), and 1.04 eV (ref. 22), respectively. The suitable bandgaps not only expand the application range of these 2D films but also increase the interest in the study of their fundamental thermodynamic properties. For instance, the thermal excitation effects with respect to the optical bandgaps of monolayers and bilayers of MoTe2 were measured with a 125 and 50 μW laser powers.23 Furthermore, as the temperature increases the gaps of these films, a red-shift was observed. The bandgap energy of the layered SnS films was also investigated for temperatures between 20 K and 200 K (ref. 24), and the results reveal a similar shift toward lower energies. However, Varshni's semiempirical relationship25,26 can generally describe the observation that the bandgap energies shift toward lower energy with increasing temperature, which is a consistent understanding of the bond and photon attributes and hence their correlation remain in their infancy.
Furthermore, it is important to note that the self-heating of the device is unavoidable. In particular, when both bias and back-gate voltages are applied, the device performance can substantially degrade in highly integrated electronic components. Usually, the heat in 2D nanomaterials mainly propagates via acoustic phonons,27,28 which determine its thermal conductivity. Therefore, it is very important to study the temperature dependence of the lattice vibrations of metal chalcogenides as nanomaterials. Raman spectroscopy is a very good method for the in situ analysis of both phonon scattering and lattice distortion in the 2D nanomaterials. Therefore, the thermal response of Raman spectroscopy of the 2D materials was measured in some studies. For monolayer ReSe2 (ref. 29), the frequencies of all the observed phonon modes exhibited nonlinear temperature dependence with incident laser wavelengths of 532 nm at low temperatures. Moreover, the temperature-dependent Raman spectroscopy of the SnSe sample30 shows intrinsic non-harmonic phonon scattering. In general, the temperature dependence of the Raman actives modes of the 2D nanomaterials was analyzed using the Grüneisen31–34 model, which indicates that the non-harmonic properties are due to the decay of an optical phonon into multiple acoustic phonons. However, the calculation of the nonlinear phonon properties at low temperatures using the Grüneisen model does not agree well with the observations.
In this study, we used a Bond-Order-Length-Strength (BOLS) approximation,35,36 which intrinsically probes bond–photon–phonon thermal softening properties across a wide temperature range. A simulation of the temperature-dependent bandgap energy and Raman shift of these 2D films revealed valuable quantitative information, including the Debye temperature (θD), atomic cohesive energy (Ez), and the referential frequency (ωL, L denotes A1g, E12g, A3g, and B3g modes). We confirm that the Debye temperature determines the nonlinear range at low temperatures, while the atomic cohesive energy determines the linear behavior at high temperatures.
2. Principles
2.1. Bond-phonon correlation
It is well-known that a Raman shift can be described using ω = ω(0) + Δω. Here, ω(0) is the Raman frequency of the reference point, and Δω is the perturbation of the temperature (T) with respect to the Raman frequency. ω(0) varies with the frequency of the substrate material and the wavelength of the incident light. However, the trend of the perturbation Δω remains unchanged when thermal excitation is used. According to the interatomic potential function, u(r) can be expanded using a Taylor series around its equilibrium position, and the Raman shift can be derived as:37| |
 | (1) |
The term (n = 0) corresponds to the equilibrium single bond energy at 0 K; the term (n = 1) is the force at equilibrium; the term (n = 2) corresponds to the thermal vibration energy, which dominates the Raman shift; the term (n ≥ 3) correspond to the nonlinear vibrations. So, omitting the higher-order terms, one can obtain the following relationship:
| |
 | (2) |
According to eqn (2), the Raman shift (ω) can be described by using Δω, which is a function of bond length (dz) and bond energy (Ez) in the zth atomic layer for the entire Raman spectroscopy. The μ = m1m2/(m1 + m2) is the reproduced mass of the representative bond.38 Thus, the Raman shift can be derived as: ω(dz,Ez) = (Ez/μ)1/2/dz.
2.2. Bond-photon correction
The bandgap energy (Eg) can be calculated using the first-order Fourier coefficient of the crystal potential (Vcry) function. Eg = 2|V1|∝〈Eb〉, where the bandgap energy is proportional to the single bond cohesive energy 〈Eb〉, and  . Here, eik·r is the Bloch wave function for equilibrium conditions. This means that the crystal potential function determines the intrinsic bandgap energy Eg. The expression of the bandgap energy for a given perturbation temperature can be written as:
| | |
Eg(T) = Eg(0)(1 + ΔT)
| (3) |
here, Eg(T) and Eg(0) represent the bandgap energies at the measured temperature and 0 K, respectively.  is the perturbation of temperature with respect to the bandgap energy.
2.3. Bond length and bond energy thermal relaxation
The relationship between the bond length and bond energy for thermal relaxation can be described using the following equation:| |
 | (4) |
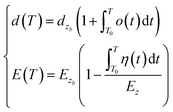
here, α(t) is the thermal expansion coefficient; dzb and Ezb denote the bond length and bond energy of the film materials without thermal stimuli, respectively. Eqn (4) indicates that the bond length expands, and the bond energy weakens upon stimulation via heating for the entire electron and Raman spectrum. The integration of the specific heat η(t) can be described by the following relationship:| |
 | (5) |
here, zi is the atomic effective coordination number, θD is the Debye temperature, Ezi is the single bond energy, and x = θD/T is the reduced form of the temperature. When the external temperature is greater than the Debye temperature, the specific heat Cv is approximately equal to a constant value of 3R, where R represents the ideal gas constant. The atomic cohesive energy Ez = ziEzi is the only adjustable parameter for the calculation of the thermal excitation of a given sample.
2.4. Photon and phonon thermal relaxation
We found the following proportional relationship for phonons and photons with respect to bond length and bond energy:| |
 | (6) |
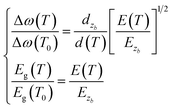
where ω(T) is the measured value for the Raman frequency, Δω(T) = ω(T) − ω(1) is the variation of the Raman frequency, ω(1) denotes the vibration frequency of a dimer, which comes from the Raman frequency of the reference point ω(0). Here, the reference frequency can vary with an incident laser wavelength, but the resulting shift is independent of the incident laser energy. Furthermore, d(T) and E(T) denote the bond length expansion and bond energy weakening with increase in temperature, respectively. Therefore, the Raman frequency and bandgap energy of these 2D films can be expressed as a function of bond length and bond energy for thermal excitation.
Combining eqn (1) to eqn (6), the thermal relaxation of the Raman frequency and bandgap energy can be expressed as:
| |
 | (7) |
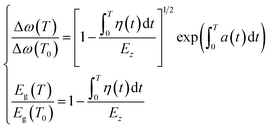
According to eqn (7), the atomic cohesive energy is the only adjustable parameter for the calculation of the temperature-dependent Raman shift and bandgap energy. Because the thermal expansion coefficient α(t) is a very small value, about 10−6 K−1, the following is valid:  . Therefore, we can neglect the effects of thermal expansion on the temperature dependence of the Raman shift. Here, a proportional relationship was established to be studied between the temperature dependence of the Raman shift and bandgap energy because the exact values of the implied constants in the expression cannot reveal the relative variation in the respective physical quantities. The main objective of our study was to determine the bond contributions to electron and phonon spectroscopy and to extract the quantitative information from complex measurements carried out by other researchers.
3. Results and discussion
3.1. The vibrational modes of M-(X, X2)
The interatomic force of M(X, X2) is made up of covalent bonds and the van der Waals (VDW) forces. Strong covalent bonds provide the in-plane stability to 2D films, whereas relatively weak VDW forces are sufficient to keep the stack together. In Fig. 1, the dotted line denotes the weakening of the interlayer VDW force; the purple spheres are metal atoms; the green balls are group VIA atoms. Fig. 1(a) shows the two Raman active vibration modes of MX2. E12g is the in-of-plane vibration mode, which comes from the opposite direction of the vibration between two X atoms and intermediate M atoms. A1g is the out-of-plane vibration mode, which is derived from the opposite direction of the vibration of two X atoms in a unit cell. Contrastingly, the MX films show out-of-plane modes (A3g) and in-plane modes (B3g) (Fig. 1(b)) because MX shows wrinkled honeycomb structures, which is different from the hexagonal honeycomb structure of MX2. The vibration modes of M(X, X2) can not only be used to identify various nanomaterials but also provide the necessary basis for the study of the temperature dependence of the Raman shift of these 2D films.
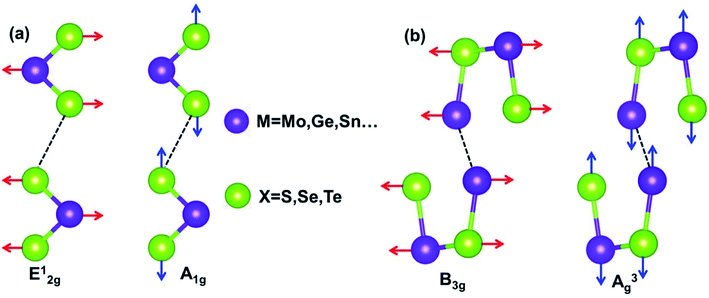 |
| | Fig. 1 The schematic of the main vibrational modes for nanostructure of (a) MX2 (ref. 47) and (b) MX.33 | |
3.2. Thermal relaxation of Raman shifts
Fig. 2 and 3 depict the BOLS reproduction observation results of the temperature-dependent A1g modes and E12g modes of MX2, respectively. The trends of all E12g and A1g modes turn gradually from nonlinear to linear during heating because the specific heat is η(t) ∝ T3 at low temperatures, due to which the Raman shift varies slowly with temperatures. However, the specific heat η(t) ≈ 3R (R is the ideal gas constant) at high temperatures, so the Raman shift display a linear decrease with the increase in temperature. Thus, the bond relaxation theory confirms that the Debye temperature determines the nonlinear range of the Raman shift at low temperatures. By calculating the temperature dependence of the Raman shift of MX2, the Debye temperature (θD), the referential frequency ωL(1) (L denote A1g and E12g modes), and atomic cohesive energy (Ez) can be listed in Table 1. These parameters are essential for calculating the temperature-dependent Raman shift of these 2D films. According to eqn (7), the physical mechanism of the temperature-dependent Raman shift originates from the thermal excitation-induced bond length expansion and bond energy weakening.
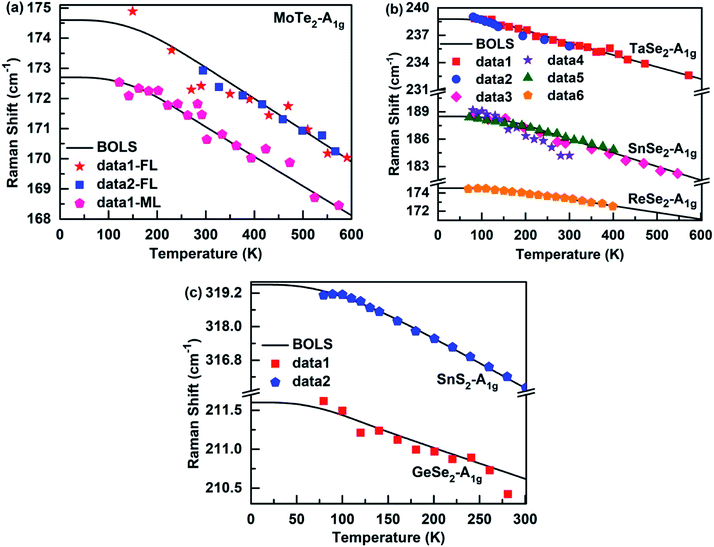 |
| | Fig. 2 The BOLS reproduction of the measured Raman A1g modes for (a) few-layer48,49 (FL) and monolayer48 (ML) MoTe2, (b) (Ta, Sn, Re)-Se2,50–54 and (c) (Sn, Ge)-(S2, Se2).44,54 | |
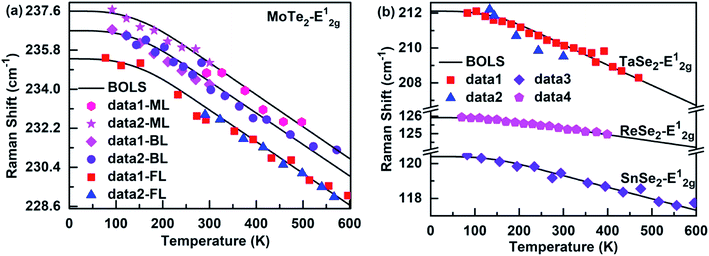 |
| | Fig. 3 Theoretical reproduction of the measured Raman E12g modes for (a) monolayer32,49 (ML), bilayer32,48 (BL), and few-layer48,49 (FL) MoTe2, (b) (Ta, Sn, Re)-Se2.50–53 | |
Table 1 The referential frequency (ωA(1) and ωE(1)), bulk bandgap energy (E0), Debye temperature (θD), and cohesive atomic energy (Ez) were used to calculate the temperature dependence of the Raman shift and bandgap energy of M(X, X2)
| Stimuli |
ωA(1) (cm−1) |
ωE(1) (cm−1) |
E0 (eV) |
Ez (eV) |
θD (K) |
| Monolayer of the nanomaterials. Bilayer of the nanomaterials. Few-layer of the nanomaterials. A3g modes. B3g modes. |
| ReSe2 |
171.12 |
124.91 |
0.68 |
3.39 |
181 (ref. 25) |
| TaSe2 |
232.12 |
206.73 |
— |
5.23 |
150 (ref. 40) |
| MoTe2 |
168.12a/169.80c |
228.66a/230.01b/232.82c |
0.58 |
4.22 |
169 (ref. 41) |
| SnSe2 |
181.11 |
117.32 |
0.53 |
4.45 |
170 (ref. 42) |
| SnS2 |
293.52 |
— |
4.16 |
3.51 |
136 (ref. 43) |
| GeSe2 |
198.52 |
— |
1.21 |
2.29 |
180 (ref. 44) |
| SnSe |
133.85d |
88.46e |
0.49 |
0.83 |
204 (ref. 33) |
| SnS |
150.13d |
84.96e |
0.69 |
0.80 |
270 (ref. 45) |
| GeSe |
175.62d |
135.86e |
0.65 |
0.69 |
214 (ref. 46) |
Fig. 4 shows the BOLS approximation calculated temperature-dependent A3g and B3g modes of the MX films. The referential frequency ωL (1) (L denote A3g and B3g modes), Debye temperature θD, and atomic cohesive energy Ez, which is hardly possible using the Varshni's semiempirical relationship and the Grüneisen model, is calculated in Table 1. From the table, it is clear that the Debye temperature for the SnS films was greater than for SnSe and GeSe, so the low-temperature nonlinear range of the former was distinctly larger than the latter. Thus, the results indicate that the Debye temperature determines the nonlinear range of the Raman shift of these 2D films at low temperatures.
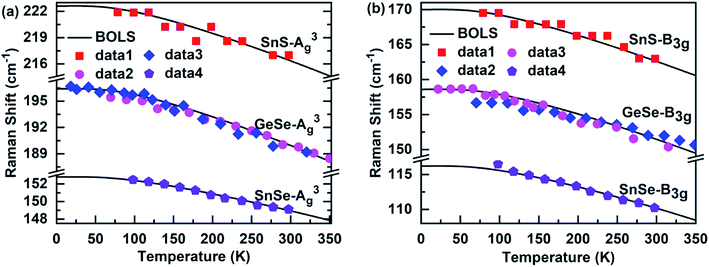 |
| | Fig. 4 Theoretical reproduction of the measured Raman (a) A3g and (b) B3g modes of SnS,55 SnS,30 and GeSe56,57 films. | |
3.3. Ez resolved a linear behavior at high temperatures
We first studied the temperature-dependent Raman shift of the monolayer (ML), bilayer (BL), and few-layer (FL) of the MoTe2 film, which is applicable to the BOLS approximation as well, see Fig. 2(a) and 3(a). The BOLS approximation demonstrates that the atoms under coordination shorten the bond length and strengthen the bond energy, which means that the E12g modes experience a blue shift, and the A1g modes undergo a redshift as the atomic layer number decreases. This was found to be similar to the layer number dependent Raman shift of MoS2.39 As a result, when there was no thermal stimulus, the phonon frequency of the few-layers of the A1g modes of MoTe2 was larger than that of the monolayer, but the phonon frequency of the E12g modes follows the opposite trend: ωML > ωBL > ωFL. In addition, since MoTe2 with a different atomic layer number had the same atomic cohesive energy, it shows the same behavior at high temperatures. Therefore, the BOLS approximation can resolve not only the layer number effect of the Raman shift of MoTe2 film but can also clarify its temperature dependence.
Moreover, the atomic cohesive energy Ez determines the linear behavior at high temperatures of the temperature-dependent Raman shift for different nanomaterials in the same temperature range. When the temperature changes from 0 to 600 K, the atomic cohesive energy (see-Table 1) shows the following relationships: Ez-TaSe2 (5.23 eV) > Ez-SnSe2 (4.45 eV) > Ez-MoTe2 (4.22 eV) > Ez-ReSe2 (3.39 eV). Compared to the other three materials, TaSe2 exhibit the largest linear behavior at high temperatures, so the rate of decrease in the Raman shift is the fastest for continuous heating. In addition, as shown in Fig. 2(c), the behavior for SnS2 at high temperatures was clearly larger than that for GeSe2 for temperatures between 0 and 300 K. So, the order of their atomic cohesive energy calculated using the bond relaxation theory was Ez-SnS2 (3.51 eV) > Ez-GeSe2 (2.29 eV). A similar situation occurs for the Raman shift temperature dependence of SnS, SnSe, and GeSe. The agreement between the BOLS calculations and the experimental measurements confirms that the atomic cohesive energy Ez governs the behavior at high temperatures for thermal relaxation in these Raman spectroscopies.
3.4. Thermal relaxation of bandgap energy
The bandgap energy of the 2D nanomaterials is an important foundation for its applications in semiconductors and optoelectronic devices. Because the self-heating of the device is unavoidable, when an electronic equipment is used, this directly affects the bandgap energy of nanomaterials. This means it is important to understand the physical mechanism of the temperature-dependent of the bandgap energy of nanomaterials. According to eqn (7), the thermal excitation increases the bond energy, which causes the thermal softening of the bandgap energy of these 2D film materials (see Fig. 5). The Debye temperature determines the nonlinear range at low temperatures, while the atomic cohesive energy governs the linear behavior at high temperatures, which is similar to the temperature dependence of the Raman shift of these 2D films. The BOLS approximation derived both atomic cohesive energy Ez and bulk bandgap energy E0, which were used to calculate the temperature dependence of the bandgap energy of these 2D films (see Table 1). Thus, these results not only show the reliability of the bond relaxation theory when the temperature dependence of bandgap energy was calculated but also confirm that the Debye temperature and the atomic cohesive energy play an important role in the thermal softening of the bandgap energy.
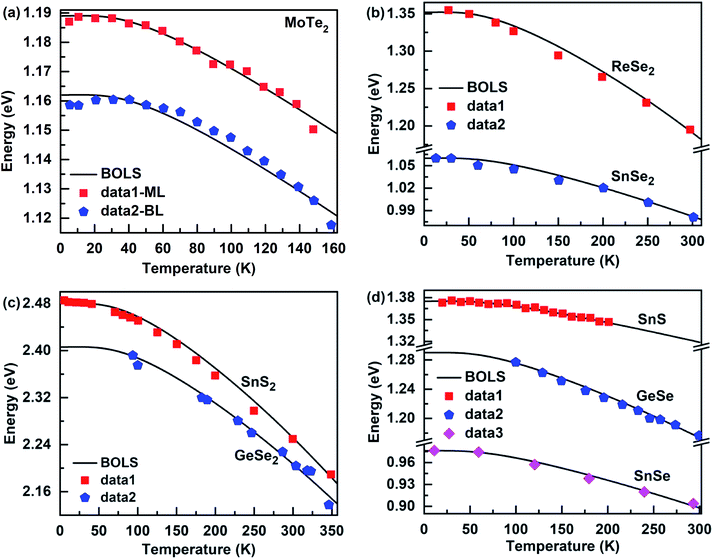 |
| | Fig. 5 Theoretical reproduction of the measured bandgap energy for (a) monolayer23 (ML) and bilayer23 (BL) MoTe2, (b) ReSe2 (ref. 25) and SnSe2 (ref. 42), (c) SnS2 (ref. 58) and GeSe2 (ref. 59) and (d) (Sn, Ge)-(S, Se).24,60,61 | |
4. Conclusion
In summary, we have investigated in detail the temperature dependence of the Raman shift and bandgap energy for M(X, X2) using the BOLS approximation. The thermal softening of the Raman shift was caused by bond length elongation and bond energy expansion; the photon energy originates from the thermal excitation-induced weakening of the bond energy. The good agreement between the theoretical predictions and the experimental observations confirms that the Debye temperature determines the nonlinear range at low temperatures, while the atomic cohesive energy governs the linear behavior at high temperatures for the thermal relaxation of the photon and phonon spectroscopy. Therefore, this study confirms the value of the bond relaxation theory, which enables the extraction of the quantitative information of bond length and bond energy from electron spectroscopy and phonon spectroscopy. The research method described in this study offers both new insight and effective tools for further exploring the thermal excitation behavior of other 2D films.
Conflicts of interest
There are no conflicts to declare.
Acknowledgements
This study was kindly supported by the National Natural Science Foundation of China (No.: 41425014), Key Laboratory Project of Jiangxi Province (No.: 20171BCD40010) and Two 1000 Talents Plan Project of Jiangxi Province (No.: S2018CQKJ0755).
References
- K. S. Novoselov, A. K. Geim, S. V. Morozov, D. Jiang, Y. Zhang, S. V. Dubonos, I. V. Grigorieva and A. A. Firsov, Science, 2004, 306, 666–669 CrossRef CAS PubMed.
- N. R. Pradhan, D. Rhodes, S. Feng, Y. Xin, S. Memaran, B.-H. Moon, H. Terrones, M. Terrones and L. Balicas, ACS Nano, 2014, 8, 5911–5920 CrossRef CAS PubMed.
- F. Xia, H. Wang, D. Xiao, M. Dubey and A. Ramasubramaniam, Nat. Photonics, 2014, 8, 899 CrossRef CAS.
- X. Wang, B. Liu, Q. Wang, W. Song, X. Hou, D. Chen, Y. b. Cheng and G. Shen, Adv. Mater., 2013, 25, 1479–1486 CrossRef CAS PubMed.
- O. Lopez-Sanchez, D. Lembke, M. Kayci, A. Radenovic and A. Kis, Nat. Nanotechnol., 2013, 8, 497 CrossRef CAS PubMed.
- E. Zhang, P. Wang, Z. Li, H. Wang, C. Song, C. Huang, Z.-G. Chen, L. Yang, K. Zhang and S. Lu, ACS Nano, 2016, 10, 8067–8077 CrossRef CAS PubMed.
- B. Mukherjee, Z. Hu, M. Zheng, Y. Cai, Y. P. Feng, E. S. Tok and C. H. Sow, J. Mater. Chem., 2012, 22, 24882–24888 RSC.
- X. Luo, F. Chen, J. Zhang, Q. Pei, G. Lin, W. Lu, Y. Han, C. Xi, W. Song and Y. Sun, Appl. Phys. Lett., 2016, 109, 102601 CrossRef.
- J. Zhang, E. Sun, X. Feng, H. Liu, S. A. Redfern, V. Kanchana, G. Liu and H. Wang, Phys. Chem. Chem. Phys., 2018, 20, 29472–29479 RSC.
- Y.-M. Zhang, J.-Q. Fan, W.-L. Wang, D. Zhang, L. Wang, W. Li, K. He, C.-L. Song, X.-C. Ma and Q.-K. Xue, Phys. Rev. B, 2018, 98, 220508 CrossRef CAS.
- S. H. Choi and Y. C. Kang, Nano Res., 2015, 8, 1595–1603 CrossRef CAS.
- M.-Z. Xue, J. Yao, S.-C. Cheng and Z.-W. Fu, J. Electrochem. Soc., 2006, 153, A270–A274 CrossRef CAS.
- S. R. Suryawanshi, S. S. Warule, S. S. Patil, K. R. Patil and M. A. More, ACS Appl. Mater. Interfaces, 2014, 6, 2018–2025 CrossRef CAS PubMed.
- M. A. Franzman, C. W. Schlenker, M. E. Thompson and R. L. Brutchey, J. Am. Chem. Soc., 2010, 132, 4060–4061 CrossRef CAS PubMed.
- L.-D. Zhao, S.-H. Lo, Y. Zhang, H. Sun, G. Tan, C. Uher, C. Wolverton, V. P. Dravid and M. G. Kanatzidis, Nature, 2014, 508, 373 CrossRef CAS PubMed.
- A. Grant, T. Griffiths, G. Pitt and A. Yoffe, J. Phys. C: Solid State Phys., 1975, 8, L17 CrossRef CAS.
- C. Ruppert, O. B. Aslan and T. F. Heinz, Nano Lett., 2014, 14, 6231–6236 CrossRef CAS PubMed.
- N. R. Pradhan, C. Garcia, B. Isenberg, D. Rhodes, S. Feng, S. Memaran, Y. Xin, A. McCreary, A. R. H. Walker and A. Raeliarijaona, Sci. Rep., 2018, 8, 12745 CrossRef PubMed.
- J. M. Gonzalez and I. I. Oleynik, Phys. Rev. B, 2016, 94, 125443 CrossRef.
- Y. Zhang, B. Shang, L. Li and J. Lei, RSC Adv., 2017, 7, 30327–30333 RSC.
- G. Shi and E. Kioupakis, J. Appl. Phys., 2015, 117, 065103 CrossRef.
- R. Fei, W. Li, J. Li and L. Yang, Appl. Phys. Lett., 2015, 107, 173104 CrossRef.
- I. G. Lezama, A. Arora, A. Ubaldini, C. Barreteau, E. Giannini, M. Potemski and A. F. Morpurgo, Nano Lett., 2015, 15, 2336–2342 CrossRef CAS PubMed.
- T. Raadik, M. Grossberg, J. Raudoja, R. Traksmaa and J. Krustok, J. Phys. Chem. Solids, 2013, 74, 1683–1685 CrossRef CAS.
- C. Ho, P. Liao, Y. Huang, T.-R. Yang and K. Tiong, J. Appl. Phys., 1997, 81, 6380–6383 CrossRef CAS.
- S. Logothetidis, P. Lautenschlager and M. Cardona, Phys. Rev. B: Condens. Matter Mater. Phys., 1986, 33, 1110 CrossRef CAS PubMed.
- X. Liu, G. Zhang, Q.-X. Pei and Y.-W. Zhang, Appl. Phys. Lett., 2013, 103, 133113 CrossRef.
- W. Li, J. Carrete and N. Mingo, Appl. Phys. Lett., 2013, 103, 253103 CrossRef.
- S. Jiang, L. Zhao, Y. Shi, C. Xie, N. Zhang, Z. Zhang, Y. Huan, P. Yang, M. Hong and X. Zhou, Nanotechnology, 2018, 29, 204003 CrossRef PubMed.
- S. Luo, X. Qi, H. Yao, X. Ren, Q. Chen and J. Zhong, J. Phys. Chem. C, 2017, 121, 4674–4679 CrossRef CAS.
- J. Joshi, I. R. Stone, R. Beams, S. Krylyuk, I. Kalish, A. V. Davydov and P. M. Vora, Appl. Phys. Lett., 2016, 109, 031903 CrossRef.
- J. Park, Y. Kim, Y. I. Jhon and Y. M. Jhon, Appl. Phys. Lett., 2015, 107, 153106 CrossRef.
- F. Liu, P. Parajuli, R. Rao, P. Wei, A. Karunarathne, S. Bhattacharya, R. Podila, J. He, B. Maruyama and G. Priyadarshan, Phys. Rev. B, 2018, 98, 224309 CrossRef CAS.
- C. W. Li, J. Hong, A. F. May, D. Bansal, S. Chi, T. Hong, G. Ehlers and O. Delaire, Nat. Phys., 2015, 11, 1063 Search PubMed.
- X. Liu, X. Zhang, M. Bo, L. Li, H. Tian, Y. Nie, Y. Sun, S. Xu, Y. Wang and W. Zheng, Chem. Rev., 2015, 115, 6746–6810 CrossRef CAS PubMed.
- X. Yang, C. Peng, L. Li, M. Bo, Y. Sun, Y. Huang and C. Q. Sun, Prog. Solid State Chem., 2019, 55, 20–66 CrossRef CAS.
- G. White, in Physics in Australia: a review by the National Committee for Physics, 1981 Search PubMed.
- C. Q. Sun, Springer Ser. Chem. Phys., 2014, 108, 807 Search PubMed.
- Y. Liu, M. Bo, Y. Guo, X. Yang, Z. Xi, C. Q. Sun and Y. Huang, J. Raman Spectrosc., 2017, 48, 592–595 CrossRef CAS.
- M. Naito and S. Tanaka, Physica B, 1981, 105, 136–140 CrossRef CAS.
- S. Helmrich, R. Schneider, A. W. Achtstein, A. Arora, B. Herzog, S. M. D. Vasconcellos, M. Kolarczik, O. Schoeps, R. Bratschitsch and U. Woggon, 2D Mater., 2018, 5, 045007 CrossRef CAS.
- P. Manou, J. Kalomiros, A. Anagnostopoulos and K. Kambas, Mater. Res. Bull., 1996, 31, 1407–1415 CrossRef CAS.
- A. Shafique, A. Samad and Y.-H. Shin, Phys. Chem. Chem. Phys., 2017, 19, 20677–20683 RSC.
- X. Zhou, X. Hu, S. Zhou, Q. Zhang, H. Li and T. Zhai, Adv. Funct. Mater., 2017, 27, 1703858 CrossRef.
- Y. M. Han, J. Zhao, M. Zhou, X. X. Jiang, H. Q. Leng and L. F. Li, J. Mater. Chem. A, 2015, 3, 4555–4559 RSC.
- M. Sist, C. Gatti, P. Nørby, S. Cenedese, H. Kasai, K. Kato and B. B. Iversen, Chem.–Eur. J., 2017, 23, 6888–6895 CrossRef CAS PubMed.
- P. Hajiyev, C. Cong, C. Qiu and T. Yu, Sci. Rep., 2013, 3, 2593 CrossRef PubMed.
- D. J. Late, Applied Materials Today, 2016, 5, 98–102 CrossRef.
- H. Zhang, W. Zhou, X. Li, J. Xu, Y. Shi, B. Wang and F. Miao, Appl. Phys. Lett., 2016, 108, 091902 CrossRef.
- J. Tsang, J. Smith Jr and M. Shafer, Solid State Commun., 1978, 27, 145–149 CrossRef CAS.
- Z. Yan, C. Jiang, T. Pope, C. Tsang, J. Stickney, P. Goli, J. Renteria, T. Salguero and A. Balandin, J. Appl. Phys., 2013, 114, 204301 CrossRef.
- A. Taube, A. Łapińska, J. Judek and M. Zdrojek, Appl. Phys. Lett., 2015, 107, 013105 CrossRef.
- A. S. Pawbake, A. Date, S. R. Jadkar and D. J. Late, ChemistrySelect, 2016, 1, 5380–5387 CrossRef CAS.
- S. V. Bhatt, M. Deshpande, V. Sathe and S. Chaki, Solid State Commun., 2015, 201, 54–58 CrossRef CAS.
- J. Xia, X.-Z. Li, X. Huang, N. Mao, D.-D. Zhu, L. Wang, H. Xu and X.-M. Meng, Nanoscale, 2016, 8, 2063–2070 RSC.
- T. Fukunaga, S. Sugai, T. Kinosada and K. Murase, Solid State Commun., 1981, 38, 1049–1052 CrossRef CAS.
- A. Taube, A. Łapińska, J. Judek, N. Wochtman and M. Zdrojek, J. Phys. D: Appl. Phys., 2016, 49, 315301 CrossRef.
- L. A. Burton, T. J. Whittles, D. Hesp, W. M. Linhart, J. M. Skelton, B. Hou, R. F. Webster, G. O'Dowd, C. Reece and D. Cherns, J. Mater. Chem. A, 2016, 4, 1312–1318 RSC.
- L. Tichý and H. Ticha, Mater. Lett., 1992, 15, 198–201 CrossRef.
- A. Elkorashy, J. Phys. Chem. Solids, 1989, 50, 893–898 CrossRef CAS.
- S. Vlachos, A. Lambros, A. Thanailakis and N. Economou, Phys. Status Solidi B, 1976, 76, 727–735 CrossRef CAS.
|
| This journal is © The Royal Society of Chemistry 2020 |
Click here to see how this site uses Cookies. View our privacy policy here.  Open Access Article
 *ab
*ab


 . Here, eik·r is the Bloch wave function for equilibrium conditions. This means that the crystal potential function determines the intrinsic bandgap energy Eg. The expression of the bandgap energy for a given perturbation temperature can be written as:
 is the perturbation of temperature with respect to the bandgap energy.


 . Therefore, we can neglect the effects of thermal expansion on the temperature dependence of the Raman shift. Here, a proportional relationship was established to be studied between the temperature dependence of the Raman shift and bandgap energy because the exact values of the implied constants in the expression cannot reveal the relative variation in the respective physical quantities. The main objective of our study was to determine the bond contributions to electron and phonon spectroscopy and to extract the quantitative information from complex measurements carried out by other researchers.


