 Open Access Article
Construction of octenyl succinic anhydride modified porous starch for improving bioaccessibility of β-carotene in emulsions†
Haiyan Li‡
a,
Yunxiang Ma‡a,
Liyue Yua,
Huadong Xue b,
Yue Wanga,
Jinfeng Chena and
Shenggui Zhang
 *a
*a
aCollege of Food Science and Engineering, Gansu Agricultural University, No. 1 Yingmencun, Anning District, Lanzhou 730070, Gansu, China. E-mail: zhangshenggui@gsau.edu.cn
bState Key Laboratory of Applied Organic Chemistry, College of Chemistry and Chemical Engineering, Lanzhou University, Lanzhou 730000, Gansu, China
First published on 27th February 2020
Abstract
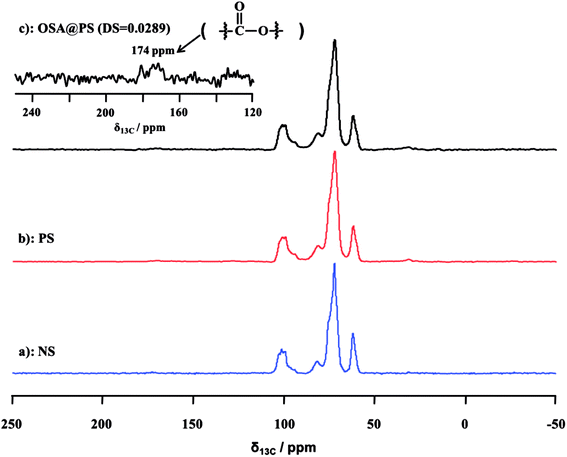
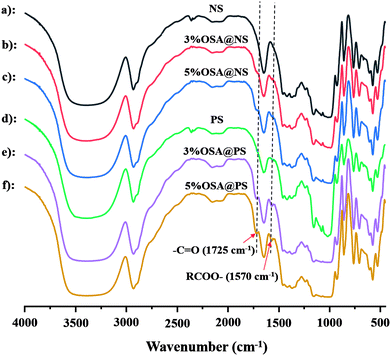
Modified porous starch (PS), by introducing octenyl succinic anhydride (OSA) moieties, was synthesized successfully, which was applied as an emulsion of β-carotene for the first time. The pores and channels within porous starch provided more possibilities for OSA to modify starch. The ester linkage of OSA modified PS with different degrees of substitution (DS) were confirmed by both 13C solid-state NMR and Fourier transform-infrared spectroscopy (FT-IR). The hydrophobic octenyl succinic and hydrophilic hydroxyl groups of OSA modified PS showed the good emulsifying capability, which could be utilized to prepare β-carotene emulsions. And the bioaccessibility of β-carotene was also enhanced with increasing DS of OSA modified starch. This study not only paves a new way using porous starches for modification of starch, but also offers an attractive alternative for obtaining emulsion-based delivery systems for bioactive components.
1. Introduction
Over the last decades, great efforts have been devoted to the association between diet and chronic diseases. Based on the convincing evidence from scientific research, the consumption of fruits and vegetables, which are good sources of carotenoids and other bioactive compounds, plays an important role in the prevention of human diseases.1 carotenoids, including β-carotene, lutein and neoxanthin, represent a large family of tetraterpenoid organic pigments, which are widely found in various colorful fruits and vegetables.2,3 As one type of carotenoid, β-carotene showed highly desirable bioactivities such as health-promoting properties, and antioxidant activity, which can maintain human health and prevent chronic diseases including cardiovascular diseases, cancer and other chronic diseases.4,5 Due to the low stability, solubility and bioaccessibility, the supplemented foods of β-carotene were greatly limited.3–6 It was worth noting that utilization of an emulsion-based delivery system is considered as an effective method for overcoming the limitations of β-carotene. The conventional emulsifying agent, including Tween 20, and polyglycerol esters,7–9 showed the excellent ability of emulsification for fabrication of colloidal system. For example, Tween 20 has been applied as an emulsifier to prepare β-carotene nano-dispersions for the first time by Tan et al. However, the chemical emulsifiers may pose a potential threat to human health in the field of foods and beverages, especially for the consumption at high-level.10 With an increasing concern on the safety of the delivery system, there is an increasingly urgent need to search for a safe emulsifier as a candidate. Emulsions from biopolymers of plants and microbial, possessing higher safety in food-grade, are considered as potential alternatives for fabrication of emulsions.3 The application of biopolymer-based emulsifiers was labeled as plant sources surfactants than the synthetic and semi-synthetic one.11 Previous research suggested that biopolymer emulsifiers, including proteins12 and polysaccharides,13 have been applied for the fabrication of the delivery system of carotenoid successfully. Among these food-grade biopolymer emulsifiers, starches chemically modified by different alkenyl succinic anhydrides, possessing the favorable hydrophobicity, are suitable to stabilize emulsions.14 For example, octenyl succinic anhydride modified starch, which is synthesized by esterification between the hydroxyl group of the starch and the carboxyl group of OSA, has also been utilized for preparing β-carotene emulsions due to its strong surface activity and good emulsifying properties.3,14,15 Various studies indicated that hydrophobic octenyl and carboxyl groups, derived from OSA modified starch, can improve the emulsifying capability of starch.16,17 Meanwhile, the degree of substitution has also a great influence on the emulsification effect of OSA modified starch. It has been proved that the emulsions with the larger DS exhibited the less flocculation and coalescence.18,19 It is well known that the DS of OSA modified starch is greatly affected by the process of esterification.20 However, the esterification reaction of OSA modified starch was restricted by the naturally low surface areas of starch, which resulted in the low DS.21 Therefore, exploring the efficient approach with more reactive sites for esterification is a great challenge in this field. It was worth noting that, porous starch is a type of well-known modified starch, which have the high surface areas22,23 to overcome the above limitation of native starches.Porous starch, obtained by the physical, chemical, and enzyme treatment, is a modified starch with abundant pores, which extended from the surface to the center of starch granules.24 Derived from these micro-sized pores and channels, porous starch possessed the larger specific surface area, which showed the more chemically reactive sites than that of starch.22,23,25 Many studies also proved that the modification of porous starch gives a higher DS than the native one.23 The pores and channels within porous starch provided more possibilities for chemical agents to penetrate easily into the interior of starch for further modifications. Therefore, the higher DS of esterified starch could be obtained using porous starch instead of the native one. Porous starch may be very suitable as a host material for further OSA modification. To the best of our knowledge, few researches have been reported about the fabrication and application of OSA modification using porous starch.
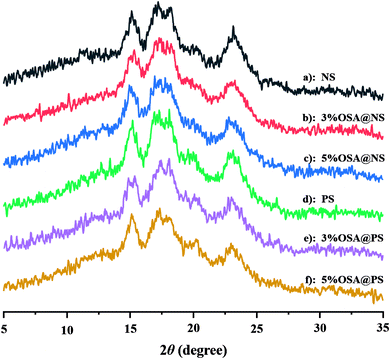
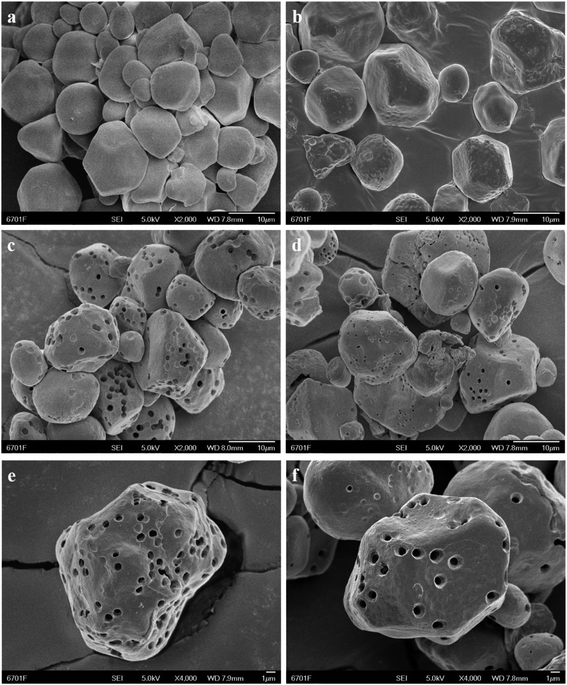
In this study, porous starch modified by introducing OSA moieties was synthesized successfully, which was applied as an emulsion of β-carotene for the first time. As shown in Fig. 1, the schematic illustration was exhibited to illustrate entire process. Porous starch synthesized by enzymatic hydrolysis, was modified by esterification with OSA groups to form OSA modified porous starch (OSA@PS). In comparison with native starch (NS), PS has the larger surface areas, which could offer more reaction sites. Thus, at the same experimental condition, the greater DS of OSA modified starch should be obtained using PS instead of NS. The successful formation of the ester linkage was confirmed by both 13C solid-state NMR spectroscopy and FT-IR. The crystalline and porous structures were characterized by X-ray diffraction analysis (XRD) and scanning electron microscopy (SEM) respectively. Furthermore, OSA modified porous starch was applied as the emulsifier to fabricate β-carotene emulsions. By mimicking digestion process in oral, gastric and intestinal fluid, the digestion test in vitro was carried out to determine the bioaccessibility of β-carotene after emulsions.
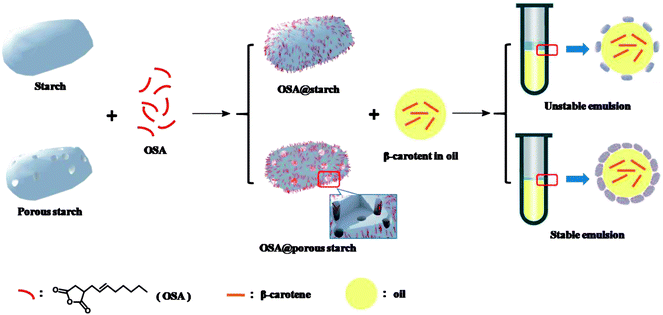 | ||
| Fig. 1 Schematic representation of synthesis and application of OSA modified porous starch and native starch. | ||
2. Materials and methods
2.1 Materials
Corn starch, α-amylase (AM, 50 U mg−1), amyloglucosidase (AMG, 100 U mL−1), octenyl succinic anhydride, were purchased from Shanghai Yuanye Biotechnology Co., Ltd. All the reagents used were of analytical grade unless otherwise stated.2.2 Methods
![[thin space (1/6-em)]](https://www.rsc.org/images/entities/char_2009.gif) :
:![[thin space (1/6-em)]](https://www.rsc.org/images/entities/char_2009.gif) 1, were added into the suspension. The samples were kept in a shaking water bath at 50 °C for 24 h. Then, the pH was adjusted to 10.0 by adding 1 M NaOH solution. The suspension was centrifuged and washed using the distilled water. Finally, the collected precipitate was dried at 50 °C to yield the porous starch. The product was ground through a 90 mesh sieve in a desiccator for further use.
1, were added into the suspension. The samples were kept in a shaking water bath at 50 °C for 24 h. Then, the pH was adjusted to 10.0 by adding 1 M NaOH solution. The suspension was centrifuged and washed using the distilled water. Finally, the collected precipitate was dried at 50 °C to yield the porous starch. The product was ground through a 90 mesh sieve in a desiccator for further use.
 | (1) |
Free OSA content of OSA modified starches was measured by 1H NMR experiments referred to the method of Tizzotti et al.27
2.2.4.1 13C solid-state NMR spectroscopy. Solid-state NMR measurements were carried out on a Bruker WB Avance II 400 MHz spectrometer. The transmitter frequency of 13C NMR is 100.60 MHz. The solid-state 13C cross-polarization magic angle spinning (CP/MAS) NMR spectra were recorded with a 4 mm double-resonance MAS probe and with a spinning rate of 10.0 kHz; a pulse delay of 3 s was applied during data acquisition with a contact time of 2.5 ms (ramp 100). The 13C chemical shifts were referenced to the signal of tetramethylsilane as 0 ppm.
2.2.4.2 Fourier transform-infrared spectroscopy. The FT-IR spectra of NS, PS, OSA@NS and OSA@PS were determined by FT-IR spectroscopy (Nicolet NEXUS 670, American). Scanning was performed from 4000–450 cm−1 at a resolution of 4 cm−1.
2.2.4.3 X-ray diffraction analysis. The crystal structures of NS, PS, OSA@NS and OSA@PS were characterized by X-ray diffract meter (Shimadzu, XRD-6000, Japan). The test conditions were as follows: voltage: 40 kV; current: 40 mA; scanning speed: 2° min−1; scanning step size: 0.06°; scanning method: continuous. The relative crystallinity (%) was quantified as the ratio of the crystalline area to the total area under the diffractogram.
2.2.4.4 Scanning electron microscopy. The morphology of NS, PS, OSA@NS and OSA@PS were observed using an SEM instrument (JSM-6701F, Electron Optics Inc., Japan). The shape and surface characteristics of the samples were observed at an accelerating voltage of 5 kV.
![[thin space (1/6-em)]](https://www.rsc.org/images/entities/char_2009.gif) :
:![[thin space (1/6-em)]](https://www.rsc.org/images/entities/char_2009.gif) 4, v/v) was added, and centrifuged at 4000 rpm. The bottom yellow layer was analyzed by spectrophotometer at 450 nm. The concentration of β-carotene in the original emulsion and micellar phase were determined from a calibration curve.
4, v/v) was added, and centrifuged at 4000 rpm. The bottom yellow layer was analyzed by spectrophotometer at 450 nm. The concentration of β-carotene in the original emulsion and micellar phase were determined from a calibration curve.
 | (2) |
3. Results and discussion
3.1 DS of OSA modified NS and PS
The OSA@NS and OSA@PS possessing different DS were synthesized according to the methods above. With varying the ratio of OSA to NS and PS from 3% to 5%, the DS of OSA@NS was changed from 0.0195 to 0.0289. The DS was enhanced as the increasing concentration of OSA, which showed a similar trend in OSA-treated ginkgo starch.31 It could be interpreted that greater availability of OSA molecules was in the proximity of starch molecule during esterification.32 In comparison with NS, OSA@PS has a larger DS (Table 1), which was proved by the result from 1H NMR of free OSA (ESI Table S1 and Fig. S1†). It was derived from additional pores and channels within the porous starch structure, which provides a larger specific surface area and more reactive sites with OSA.| Samples | DS | Xc (%) |
|---|---|---|
| a Values are given as mean ± standard deviation. Different superscript letters in the columns indicate significant difference (p < 0.05). | ||
| NS | 0 | 31.84 ± 0.1380b |
| PS | 0 | 30.18 ± 0.1751b |
| 3% OSA@NS | 0.0195 ± 0.0195d | 33.28 ± 0.0980a |
| 5% OSA@NS | 0.0228 ± 0.0162c | 31.95 ± 0.1310a |
| 3% OSA@PS | 0.0260 ± 0.0249b | 28.83 ± 0.1551c |
| 5% OSA@PS | 0.0289 ± 0.0205a | 28.22 ± 0.0616c |
3.2 Structural characterization of modified NS and PS
![[double bond, length as m-dash]](https://www.rsc.org/images/entities/char_e001.gif) O and RCOO– group of the ester, were observed obviously in that of OSA modified NS and PS.35,36 Meanwhile, the signal became increasingly obvious with the raising DS gradually. Compared FT-IR spectra of OSA@NS and OSA@PS, it was worth noting that adsorption bands of C
O and RCOO– group of the ester, were observed obviously in that of OSA modified NS and PS.35,36 Meanwhile, the signal became increasingly obvious with the raising DS gradually. Compared FT-IR spectra of OSA@NS and OSA@PS, it was worth noting that adsorption bands of C![[double bond, length as m-dash]](https://www.rsc.org/images/entities/char_e001.gif) O (1725 cm−1) and RCOO– (1570 cm−1) of OSA@PS could be observed obviously than that of OSA@NS in FT-IR spectra. This result suggested that enzymatic hydrolysis improved the efficiency of esterification, due to the larger surface areas of PS. This result, which offered the further evidence for the formation of ester linkage, indicated that OSA was successfully introduced into NS and PS by means of esterification reaction.
O (1725 cm−1) and RCOO– (1570 cm−1) of OSA@PS could be observed obviously than that of OSA@NS in FT-IR spectra. This result suggested that enzymatic hydrolysis improved the efficiency of esterification, due to the larger surface areas of PS. This result, which offered the further evidence for the formation of ester linkage, indicated that OSA was successfully introduced into NS and PS by means of esterification reaction.
N2 adsorption analysis was also utilized to explore porous structure of PS before and after esterification. The application of the Brunauer–Emmett–Teller (BET) model resulted in the surface areas of 1.08 and 1.43 m2 g−1 for PS (ESI Fig. S2†) and 5% OSA@PS (ESI Fig. S3†), respectively. In comparison with the case of PS, no difference was observed obviously indicated that pores within PS were still maintained after esterification.
3.3 Effect of modified starch on digestion characteristics of emulsion
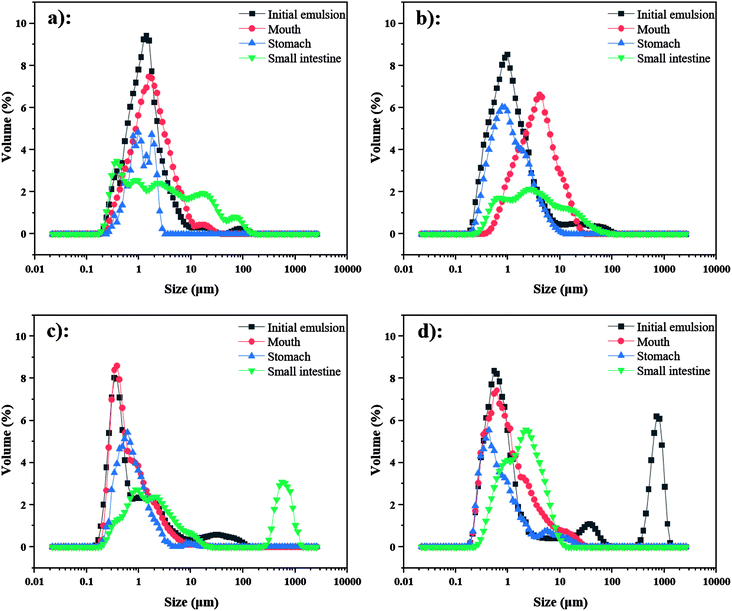 | ||
| Fig. 7 Particle size distribution of emulsions containing β-carotene during in vitro digestion ((a) 3% OSA@NS; (b) 5% OSA@NS; (c) 3% OSA@PS; (d) 5% OSA@PS). | ||
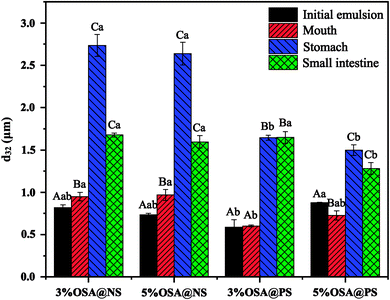
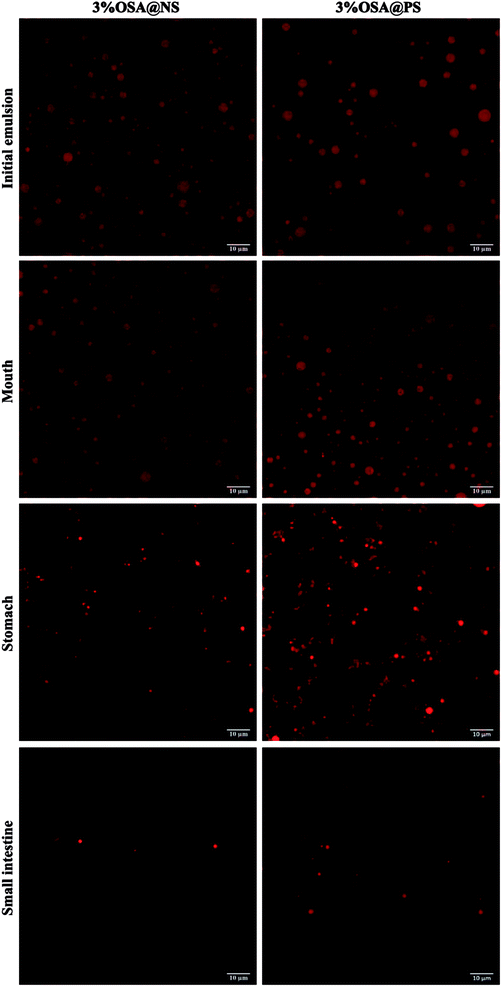
As shown in ESI Fig. S4,† by means of CLSM analysis, the variation of microstructure was observed obviously in all emulsions after SGF. In the emulsions stabilized by OSA@NS, many flocs appeared along with the disappearance of small oil droplets, which indicated that severe flocculation and coalescence occurred in these emulsions.18 However, only a few flocs and large particles were observed in OSA@PS, which showed the greater stability than that of OSA@NS. This phenomenon may be explained that OSA@PS with higher DS provided a large amount of OSA groups, which not only had the larger steric hindrance, but also formed the more rigid and dense interface layer.18,43
3.4 Determination of bioaccessibility of β-carotene
For better absorption by intestinal epithelial cells, the fat-soluble nutrients, embedded in the carriers, need to be released from carriers firstly, and penetrated into mixed micelles or vesicles.3 Seen from the digestive pathways in the body, it was found that the amount of fat-soluble nutrients transferred from food to the micellar phase was the key parameter, which determines absorption levels of nutrients by small intestine.44 Therefore, the degree of micellization was a key parameter to characterize the bioaccessibility of fat-soluble nutrients in vitro digestion.Many studies have proved that the OSA modified starch emulsions showed the great benefits on bioaccessibility of β-carotene. When the lipid layers were hydrolyzed gradually, more and more β-carotenes were released from the oil droplets. Meanwhile, many free fatty acids are produced during the hydrolysis of lipid, which could penetrate the mixed micelles. This could give rise to the higher solubility of β-carotenes in the mixed micelles.17,18 Besides, the higher DS of OSA modified starch may be beneficial to the stability of the emulsion in the digestive tract, which resulted in the more β-carotenes were released from oil droplets.30 Inspired by the better bioaccessibility caused by OSA modified starch, the bioaccessibility of β-carotene in the OSA@NS and OSA@PS emulsions with different DS were measured in detail, as shown in Fig. 9. It was found that availability of β-carotene enhanced along with the increasing DS of OSA modified starches, which was consistent with previous studies.18,30,45 For example, 5% OSA@PS sample have the excellent bioaccessibility, due to the DS up to 0.0289. Compared with OSA@NS samples, the bioaccessibility of OSA@PS emulsions showed almost twice than that of OSA@NS. As far as we know, there is still no report on the OSA modified porous starch. Moreover, OSA modified starch exhibited well-stabilizing effect for β-carotene. Therefore, OSA modified PS, which can obtain the higher DS than the native one, indeed was an excellent alternative for stabilize β-carotene emulsions.
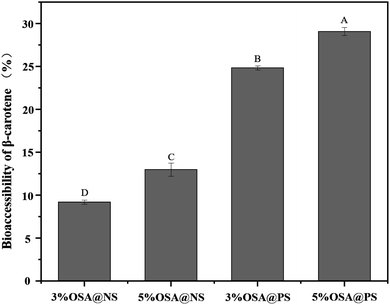 | ||
| Fig. 9 Bioaccessibility of β-carotene embedded in the emulsions after digestion in vitro. Different capital letters indicate a statistically significant difference (p < 0.01). | ||
In summary, OSA modified porous starches with different DS were synthesized successfully by esterification reaction between porous starch and OSA groups. The spectra of 13C solid-state NMR and FT-IR spectroscopy confirmed that ester linkage of OSA modified PS was successfully formed. The XRD patterns and SEM images suggested that the ordered crystalline configuration and porous structure of starch granules were not destroyed during the OSA modified process. Using the lower consumptions of PS as materials, the higher DS of OSA@PS with the DS of 0.0289 was obtained. Furthermore, OSA@PS possessing the excellent ability of emulsification was applied as an emulsion of β-carotene for the first time. In the simulated gastric juice, we found that the emulsions with the larger DS exhibited the less flocculation and coalescence, and the stability of the emulsion was positively correlated with the DS of OSA modified starch. It was also demonstrated that different DS of samples showed the great influences on the bioaccessibility of β-carotene in the emulsion, due to the variation of stability and particle sizes of the emulsions. Therefore, as a delivery system of food-grade, OSA@PS with higher DS could be applied as emulsions for stabilizing bioactive components.
Conflicts of interest
The authors declare no competing financial interest.Acknowledgements
This work was financially supported by the National Natural Science Foundation of China (No. 21965002), the Scientific Research Start-up Funds of Gansu Agricultural University (No. 2017RCZX-46) and Modern Agricultural Industry Technology System of Gansu Province (No. GARS-TSZ-4). The authors thank Prof. Wei Wang (Lanzhou University) for the assistance with 13C solid state NMR analysis and beneficial discussion.References
- A. V. Rao and L. G. Rao, Pharmacol. Res., 2007, 55, 207–216 CrossRef CAS PubMed.
- Y. Yonekura and A. Nagao, Mol. Nutr. Food Res., 2007, 51, 107–115 CrossRef PubMed.
- R. Liang, C. F. Shoemaker, X. Yang, F. Zhong and Q. Huang, J. Agric. Food Chem., 2013, 61, 1249–1257 CrossRef CAS PubMed.
- C. S. Boon, D. J. McClements, J. Weiss and E. A. Decker, Crit. Rev. Food Sci. Nutr., 2010, 50, 515–532 CrossRef CAS PubMed.
- E. Meroni and V. Raikos, Food Funct., 2018, 9, 320–330 RSC.
- Q. Lin, R. Liang, F. Zhong, A. Ye, Y. Hemar, Z. Yang and H. Singh, J. Agric. Food Chem., 2019, 67, 6614–6624 CrossRef CAS PubMed.
- C. P. Tan and M. Nakajima, Food Chem., 2005, 92, 661–671 CrossRef CAS.
- Y. Yuan, Y.-X. Gao, L. Mao and J. Zhao, Food Chem., 2008, 107, 1300–1306 CrossRef CAS.
- Y. Yuan, Y.-X. Gao, J. Zhao and L. Mao, Food Res. Int., 2008, 41, 61–68 CrossRef CAS.
- D. J. McClements and J. Rao, Crit. Rev. Food Sci. Nutr., 2011, 51, 285–330 CrossRef CAS PubMed.
- B. Ozturk and D. J. McClements, Curr. Opin. Food Sci., 2016, 7, 1–6 CrossRef.
- J. Yi, Y. Li, F. Zhong and W. Yokoyama, Food Hydrocolloids, 2014, 35, 19–27 CrossRef CAS.
- T. A. J. Verrijssen, L. G. Balduyck, S. Christiaens, A. M. Van Loey, S. Van Buggenhout and M. E. Hendrickx, Food Res. Int., 2014, 57, 71–78 CrossRef CAS.
- M. C. Sweedman, M. J. Tizzotti, C. Schafer and R. G. Gilbert, Carbohydr. Polym., 2013, 92, 905–920 CrossRef CAS PubMed.
- O. Torres, B. Murray and D. A. Sarkar, Trends Food Sci. Technol., 2016, 55, 98–108 CrossRef CAS.
- J. He, J. Liu and G. Zhang, Biomacromolecules, 2008, 9, 175–184 CrossRef CAS PubMed.
- S. Zhao, G. Tian, C. Zhao, C. Lu, Y. Bao, X. Liu and J. Zheng, Food Hydrocolloids, 2018, 85, 248–256 CrossRef CAS.
- Q. Lin, R. Liang and F. Zhong, Food Hydrocolloids, 2017, 73, 184–193 CrossRef CAS.
- Q. Lin, R. Liang, F. Zhong, A. Ye and H. Singh, Food Hydrocolloids, 2018, 84, 303–312 CrossRef CAS.
- H. Ruan, Q. Chen, M. Fu, Q. Xu and G. He, Food Chem., 2009, 114, 81–86 CrossRef.
- F. Gao, D. Li, C. Bi, Z. Mao and B. Adhikari, Carbohydr. Polym., 2014, 103, 310–318 CrossRef CAS PubMed.
- X. Ma, X. Liu, D. P. Anderson and P. R. Chang, Food Chem., 2015, 181, 133–139 CrossRef CAS PubMed.
- P. R. Chang, D. Qian, D. P. Anderson and X. Ma, Carbohydr. Polym., 2012, 88, 604–608 CrossRef CAS.
- A. Dura, W. Blaszczak and C. M. Rosell, Carbohydr. Polym., 2014, 101, 837–845 CrossRef CAS PubMed.
- B. Zhang, D. Cui, M. Liu, H. Gong, Y. Huang and F. Han, Int. J. Biol. Macromol., 2012, 50, 250–256 CrossRef CAS PubMed.
- X. Song, G. He, H. Ruan and Q. Chen, Starch, 2006, 58, 109–117 CrossRef CAS.
- M. J. Tizzotti, M. C. Sweedman, D. Tang, C. Schaefer and R. G. Gilbert, J. Agric. Food Chem., 2011, 59, 6913–6919 CrossRef CAS PubMed.
- S. J. Hur, E. A. Decker and D. J. McClements, Food Chem., 2009, 114, 253–262 CrossRef CAS.
- A. Sarkar, K. Goh, R. P. Singh and H. Singh, Food Hydrocolloids, 2009, 23, 1563–1569 CrossRef CAS.
- L. Salvia-Trujillo, C. Qian, O. Martín-Belloso and D. J. McClements, Food Chem., 2013, 141, 1472–1480 CrossRef CAS PubMed.
- Y. Zheng, L. L. Hu, N. Ding, P. Liu, C. Yao and H. X. Zhang, Int. J. Biol. Macromol., 2017, 94, 566–570 CrossRef CAS PubMed.
- R. Bhosale and R. Singhal, Carbohydr. Polym., 2007, 68, 447–456 CrossRef CAS.
- F. Ye, M. Miao, C. Huang, K. Lu, B. Jiang and T. Zhang, J. Agric. Food Chem., 2014, 62, 11696–11705 CrossRef CAS PubMed.
- Y. J. Bai, Y. C. Shi, A. Herrera and O. Prakash, Carbohydr. Polym., 2011, 83, 407–413 CrossRef CAS.
- Z. Liu, Y. Li, F. Cui, L. Ping, J. Song, Y. Ravee, L. Jin, Y. Xue, J. Xu, G. Li, Y. Wang and Y. Zheng, J. Agric. Food Chem., 2008, 56, 11499–11506 CrossRef CAS PubMed.
- S. Tian, Z. Wang, X. Wang and R. Zhao, RSC Adv., 2016, 6, 96182–96189 RSC.
- W. Liu, Y. Li, M. Chen, F. Xu and F. Zhong, J. Agric. Food Chem., 2018, 66, 9301–9308 CrossRef CAS PubMed.
- G. He, X. Song, H. Ruan and F. Chen, J. Agric. Food Chem., 2006, 54, 2775–2779 CrossRef CAS PubMed.
- M. Lopez-Silvaa, L. A. Bello-Pereza, E. Agama-Acevedoa and J. Alvarez-Ramirezb, Food Hydrocolloids, 2019, 97, 105–212 CrossRef.
- J. Wang, L. Su and S. Wang, J. Sci. Food Agric., 2009, 90, 424–429 Search PubMed.
- D. J. McClements and H. Xiao, Food Funct., 2012, 3, 202–220 RSC.
- K. Królikowska, S. Pietrzyk, T. Fortuna, P. Pająk and M. Witczak, Food Chem., 2019, 278, 284–293 CrossRef PubMed.
- H. Zhang, C. Schäfer, P. Wu, B. Deng, G. Yang, E. Li, R. G. Gilbert and C. Li, Food Hydrocolloids, 2018, 74, 168–175 CrossRef CAS.
- P. Wang, H. J. Liu, X. Y. Mei, M. Nakajima and L. J. Yin, Food Hydrocolloids, 2012, 26, 427–433 CrossRef CAS.
- S. Kokubun, I. Ratcliffe and P. A. Williams, Carbohydr. Polym., 2018, 194, 18–23 CrossRef CAS PubMed.
Footnotes |
| † Electronic supplementary information (ESI) available. See DOI: 10.1039/c9ra10079b |
| ‡ Haiyan Li and Yunxiang Ma contributed equally to this work. |
| This journal is © The Royal Society of Chemistry 2020 |

