 Open Access Article
A unimolecular DNA fluorescent probe for determination of copper ions based on click chemistry†
Yingfeng Qina,
Ming Lia,
Yingying Yanga,
Zhiying Gaoa,
Huaisheng Zhangb and
Jingjin Zhao *ab
*ab
aKey Laboratory of Ecology of Rare and Endangered Species and Environmental Protection (Guangxi Normal University), Ministry of Education, Guilin 541004, PR China. E-mail: jzhao12@163.com; Fax: +86-773-583-2294; Tel: +86-773-5846141
bDepartment of Chemistry and Biochemistry, Jackson State University, 1400 Lynch St., Jackson, MS 39217, USA
First published on 6th February 2020
Abstract
A homogenous fluorescence method was constructed for Cu2+ detection by employing DNA-templated click chemistry and exonuclease reaction. In this strategy, a dumbbell shaped DNA probe, which contained an alkyne group and an azide group at its ends, was designed as the template for the click chemistry reaction, and also the signal probe. In the absence of Cu2+, the DNA probe was digested into small oligonucleotide fragments by exonuclease, resulting in a low fluorescence background. However, this DNA probe can be sealed at its two ends by Cu2+-induced click chemistry ligation in the presence of Cu2+. This closed structure of DNA would remain stable after addition of exonuclease, and could then be stained by SYBR Green I. A strong fluorescence signal was observed, which was related to the concentration of Cu2+. This assay showed high selectivity and reached the detection limit of 39 nM. Moreover, the proposed strategy exhibited satisfactory detection results in real complex sample analysis, and has promising application in environmental monitoring and food safety.
1. Introduction
Copper (Cu2+) is an essential trace element which plays a critical role in human health and various physiological fundamental life processes.1 In addition, as an important transition metal, copper is involved in many biological processes as a structural component of certain proteins.2 However, excessive amounts of cooper lead to high toxicity in the human body. Some serious diseases have been found to be associated with the toxicity of cooper, such as Alzheimer's disease, Wilson's disease, Menkes disease, and hereditary aceruloplasminemia.3–5 The accumulation of copper in the human body is mainly attributed to food and drinking water, as well as some copper come from the ecosystem that may be caused by environmental pollution. Therefore, determination of Cu2+ in the environment and humans for ecosystem balance and human health is of great significance.To date, several approaches including atomic absorption spectroscopy (AAS),6,7 inductively coupled plasma atomic emission spectroscopy (ICP-AES),8 inductively coupled plasma mass spectrometry (ICP-MS),9 colorimetric methods,10 surface-enhanced Raman scattering spectroscopy,11 electrochemical assay,12 fluorescence methods,13,14 have been used for Cu2+ detection in environmental samples and human bodies. Among these, fluorescence methods have gained an increasing interest due to its high sensitivity, low cost, ease of handling, and fast analysis speed.
Cu+-catalyzed azide–alkyne cycloaddition (CuAAC) is considered as a representative reaction of “Click Chemistry”.15 It has gained an increasing interest in many fields due to its important merits such as high efficiency and selectivity, mild reaction conditions, and almost no byproducts.16 In addition, DNA-templated click chemistry reaction can be achieved by CuAAC as the linking tool to trigger azide and alkyne-modified DNA chemical ligation. Due to this merit, DNA-templated click chemistry reaction provides new signal conversion strategies17–20 for the detection of alkaline phosphatase activity, single nucleotide polymorphism, and protein, especially Cu2+. Nie's group developed a fluorescent method for Cu2+ detection based on DNA-templated click chemistry reaction and magnetic microparticle.21 Xiang's group reported a new glucometer-based sensing strategy using DNA-templated click chemistry reaction and multi-invertase loaded magnetic bead labels.22 Recently, our group established a novel fluorescence polarization assay based on DNA-templated click chemistry and silica nanoparticles-assisted fluorescence polarization enhancement.23 Nevertheless, some methods for Cu2+ analysis normally required tedious separation process, complex sequence design or coupling of nanoparticles. Thus, developing new DNA-templated click chemistry-based simple strategy for quantitative detection of Cu2+ is still needed.
Herein, we proposed a simple fluorescence assay for selectivity and sensitive detection of Cu2+ by DNA-templated click chemistry reaction and exonuclease digestion. A dumbbell shaped DNA (DS-DNA) is used as the DNA template and the signal probe, which bears an alkyne group and an azide group at its ends, respectively. In the presence of Cu2+, the DS-DNA can be closed to form a sealed structure through DNA-templated click chemistry reaction. This stable structure is able to resist to the digestion of exonuclease I (Exo I) and exonuclease III (Exo III). The fluorescence signal can be assessed using SYBR Green I (SG I) as the label-free fluorescent dye. The change of fluorescence signal is related to the quantitation of Cu2+. This method is not only simple, stable and specific, but also exhibits a good assay performance in complex samples.
2. Experimental
2.1 Reagents
The oligonucleotide (DS-DNA: 5′-CH![[triple bond, length as m-dash]](https://www.rsc.org/images/entities/char_e002.gif) CH-ATA TAT ATA TAT CGA CCC CCC TCG ATA TAT ATA TAT ATA TAT ATA TAT CGA CCC CCC TCG ATA TAT ATA TAT-N3-3′) was synthesized by Shanghai Sangon Biotech Co. Ltd (Shanghai, China) (https://www.sangon.com). Exonuclease III (Exo III), exonuclease I (Exo I) and 10× NEBuffer (10 mM Tris–HCl, 50 mM NaCl, 10 mM MgCl2, 1 mM dithiothreitol, pH = 7.9) were gained from New England Biolabs (Beijing, China) (https://www.neb-china.com). Tris(hydroxypropyltriazolylmethyl)amine (THPTA) was procured from Sigma-Aldrich (www.sigmaaldrich.com). SYBR Green I (SG I) (10
CH-ATA TAT ATA TAT CGA CCC CCC TCG ATA TAT ATA TAT ATA TAT ATA TAT CGA CCC CCC TCG ATA TAT ATA TAT-N3-3′) was synthesized by Shanghai Sangon Biotech Co. Ltd (Shanghai, China) (https://www.sangon.com). Exonuclease III (Exo III), exonuclease I (Exo I) and 10× NEBuffer (10 mM Tris–HCl, 50 mM NaCl, 10 mM MgCl2, 1 mM dithiothreitol, pH = 7.9) were gained from New England Biolabs (Beijing, China) (https://www.neb-china.com). Tris(hydroxypropyltriazolylmethyl)amine (THPTA) was procured from Sigma-Aldrich (www.sigmaaldrich.com). SYBR Green I (SG I) (10![[thin space (1/6-em)]](https://www.rsc.org/images/entities/char_2009.gif) 000×) and sodium ascorbate (NaVC) were purchased from Shanghai Sangon Biotech Co. Ltd (Shanghai, China) (https://www.sangon.com). GoldView II (5000×) was gained from solarbio (http://www.solarbio.com). All other reagents were of analytical grade. Ultrapure water (18.2 MΩ cm) was employed throughout the work.
000×) and sodium ascorbate (NaVC) were purchased from Shanghai Sangon Biotech Co. Ltd (Shanghai, China) (https://www.sangon.com). GoldView II (5000×) was gained from solarbio (http://www.solarbio.com). All other reagents were of analytical grade. Ultrapure water (18.2 MΩ cm) was employed throughout the work.
2.2 Assay of Cu2+ analysis
The DS-DNA was denatured in 10 mM Tris–HCl buffer (50 mM NaCl, 10 mM MgCl2) at 95 °C for 5 min and slowly cooled to room temperature to form dumbbell shaped structure. Then, 2 μL of 2 μM DS-DNA, different concentration of Cu2+, 1 μL of 10 mM THPTA, 1 μL of 10 mM NaVC and 10 μL 2× click chemistry reaction buffer (0.2 M Tris–HCl, 1.0 M NaCl, pH = 7.4) were incubated at the room temperature for 30 min in dark. After that, Exo III (15 U), Exo I (2 U) and 10 mM Tris–HCl buffer (50 mM NaCl, 10 mM MgCl2) were mixed and incubated at 37 °C for 60 min. Then 3.0 μL of SG I (50×) and ultrapure water were added with the final volume of 100 μL. The solutions were carried out at 37 °C for 30 min. Finally, the fluorescence spectra were measured by using an agilent G9800A fluorescence spectrometer (Agilent Technologies, USA) with the excitation wavelength at 480 nm. Fluorescence intensity at 525 nm was used to evaluate the assay performance.2.3 Agarose gel electrophoresis
Three samples were prepared as follows: (1) DS-DNA (1 μM) was used as sample one; (2) the mixture of DS-DNA (1 μM), Exo III (90 U) and Exo I (12 U) were incubated at 37 °C for 60 min was used as sample two; (3) DS-DNA (1 μM) and Cu2+ (80 μM) were incubated at the room temperature for 30 min in dark, and then added Exo III (90 U) and Exo I (12 U) to the mixture for incubating 60 min at 37 °C was used as sample three. The samples were stained by GoldView II (5×) for incubating 20 min at 37 °C. After adding loading buffer, the gel electrophoresis assay was carried out on 3% agarose gels and run in 0.5× TBE buffer (pH 8.3) at a 75 V constant voltage for 80 min. Then the gel was scanned and recorded by using the Tanon 1600 Gel imaging system.2.4 Analysis of the river sample
The river water samples were obtained from Xiangsi River near Guangxi Normal University (Guangxi Province, China). The samples were filtered through a 0.22 μm membrane filter. Then, Cu2+ spiked river water samples were prepared by adding different concentration of Cu2+ into the filtered river water samples. The followed procedure was the same as the experiment mentioned above for assay of Cu2+.3. Results and discussion
3.1 Principle of fluorescence assay
A fluorescent assay was developed for Cu2+ detection based on click chemistry and exonuclease, which used only one DNA probe. The principle of this proposed method was illustrated in Scheme 1. As can be seen, a dumbbell shaped DNA probe (DS-DNA) was designed as the DNA-template of click chemistry reaction, which was labeled with an alkyne group (–CH![[triple bond, length as m-dash]](https://www.rsc.org/images/entities/char_e002.gif) CH) at the 5′ end and an azide group (–N3) at the 3′ end, respectively. In the absence of Cu2+, the click chemistry reaction was hard to carry out because of lacking of the catalyst. So, the ends of DS-DNA were still exposed, and then was recognized by Exo III and Exo I. Exo III was able to catalyze double-stranded region of DS-DNA from 3′ → 5′ and Exo I could hydrolyze the single-stranded region of DS-DNA. Under the reaction of exonuclease, the DS-DNA was completely digested into small oligonucleotide fragments. Since SG I could not bind with the digestive products, a low fluorescence background signal was observed. On the contrary, the added Cu2+ was reduced to Cu+ by sodium ascorbate in the solution. Cu+ would catalyze the cycloaddition of click chemistry between 5′-CH
CH) at the 5′ end and an azide group (–N3) at the 3′ end, respectively. In the absence of Cu2+, the click chemistry reaction was hard to carry out because of lacking of the catalyst. So, the ends of DS-DNA were still exposed, and then was recognized by Exo III and Exo I. Exo III was able to catalyze double-stranded region of DS-DNA from 3′ → 5′ and Exo I could hydrolyze the single-stranded region of DS-DNA. Under the reaction of exonuclease, the DS-DNA was completely digested into small oligonucleotide fragments. Since SG I could not bind with the digestive products, a low fluorescence background signal was observed. On the contrary, the added Cu2+ was reduced to Cu+ by sodium ascorbate in the solution. Cu+ would catalyze the cycloaddition of click chemistry between 5′-CH![[triple bond, length as m-dash]](https://www.rsc.org/images/entities/char_e002.gif) CH and 3′-N3 of DS-DNA. Thus, the DS-DNA probe was sealed to form a closed structure, which resisted to the degradation by Exo III and Exo I. As a result, SG I could easily bind with double-stranded region of DS-DNA, obtaining a high fluorescence signal.
CH and 3′-N3 of DS-DNA. Thus, the DS-DNA probe was sealed to form a closed structure, which resisted to the degradation by Exo III and Exo I. As a result, SG I could easily bind with double-stranded region of DS-DNA, obtaining a high fluorescence signal.
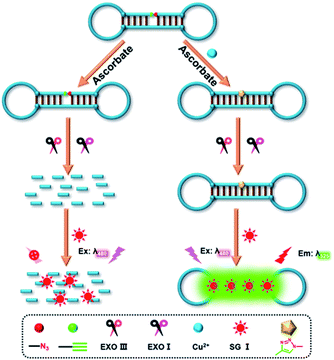 | ||
| Scheme 1 Schematic illustration of Cu2+ assay based on DNA-templated click chemistry reaction and exonuclease digestion. | ||
3.2 Feasibility study of the method
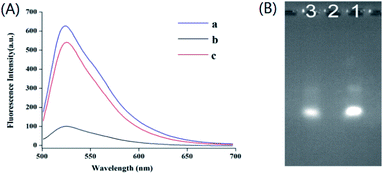
The feasibility of the method was verified by investigating the fluorescence emission spectra with and without Cu2+. As shown in Fig. 1A, a strong fluorescence signal was obtained when there was only one DS-DNA in the solution (curve a). However, DS-DNA was hydrolyzed into small oligonucleotide fragments after the addition of Exo III and Exo I, causing a low fluorescence intensity (curve b). As expected, when Cu2+ was added to the solution before exonuclease reaction, the fluorescence intensity decreased slightly (curve c). Because DS-DNA was sealed by Cu2+-catalyzed click ligation, which can stand up to exonuclease digestion. Curve b and curve c demonstrated that the fluorescence intensity change was attributed to Cu2+. Thus, the proposed method can be used for the detection of Cu2+.To further verify the viability of the proposed method, gel electrophoresis was carried out. The results are shown in Fig. 1B. DS-DNA exhibited a bright band (lane 1). Upon adding Exo III and Exo I, the band of DS-DNA disappeared (lane 2), repeatedly implying that exonuclease digestion happened. After adding Cu2+ into the systems, one bright band was obtained (lane 3), which exhibited the same migration shift compared with lane 1. The gel electrophoresis experiments confirmed that Cu2+-catalyzed click ligation could prevent exonuclease digestion.
3.3 Study of experimental conditions
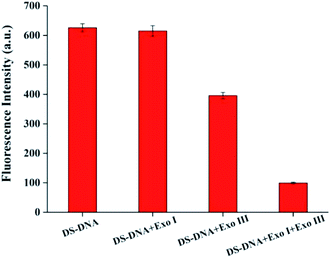
In order to achieve the best assay performance, some important conditions such as the digestion capacity of exonuclease, the concentrations of Exo III and Exo I, incubation time of exonuclease, reaction time of click chemistry and the amount of SG I were investigated. First, the digestive capacity of exonuclease plays an important role in the system. In the absence of Cu2+, the digestion capacity of exonuclease on DS-DNA was evaluated. As shown in Fig. 2, DS-DNA could be completely hydrolyzed only in the presence of both Exo I and Exo III.The concentrations and incubation time of Exo III and Exo I have substantial impact on the exonuclease digestion, which directly affects the change of fluorescence intensity ΔF (ΔF = F − F0, where F and F0 are the fluorescence intensity in the presence and absence of Cu2+, respectively). As shown in Fig. S1,† with increasing concentrations or incubation time of Exo III and Exo I, ΔF increases significantly and reach a constant at 15 U Exo III (Fig. S1A†) and 2 U Exo I (Fig. S1B†) for 60 min (Fig. S1C†), and these results were chosen and used in the following experiments.
As one of the main parameters, the reaction time of click chemistry is closely related to chemical ligation efficiency. The amount of fluorescence dye SG I also can affect the fluorescence intensity of system. The effects of these two parameters were shown in Fig. S2.† The change of fluorescence intensity (ΔF) increases with the reaction time of click chemistry from 0 min to 30 min and reaches a plateau after 30 min (Fig. S2A†), indicating that the click chemistry reaction almost finished with 30 min, and 30 min was chosen as the optimal click chemistry reaction time. The amount of SG I of 50× used was also investigated in Fig. S2B,† and ΔF increases markedly when SG I volume from 0 μL to 3 μL. Consequently, the optimal amount of SG I used was selected to be 3 μL in this system.
3.4 Assay performance
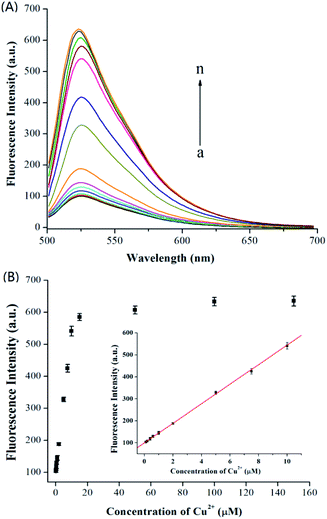
The assay performance of the proposed method was investigated under the optimal conditions by using a series of different concentrations of Cu2+. Fig. 3A displays the fluorescence emission spectra obtained, and Fig. 4B shows the fluorescence intensity at 525 nm arises as increasing concentration of Cu2+. A good linear correlation was achieved between the fluorescence intensity and Cu2+ concentration in the range from 0.1 μM to 10 μM (Fig. 3B, inset). The corresponding equation is F = 44.169C + 100.864 (F is the fluorescence intensity; C is the Cu2+ concentration, μM) with a correlation coefficient of 0.9980. The detection limit was estimated to be 39 nM (S/N = 3). The sensitivity of the proposed assay was comparable to or better than that of previously reported click chemistry reaction and magnetic microparticle-based fluorescence method,21 carbon dots-based fluorescence method,24 DNAzyme signal amplification-based lateral flow assay,25 gold nanoparticles-based colorimetric assay,26 and gold nanoclusters-based colorimetric assay.27 Additionally, the proposed method is more convenience compared with these methods.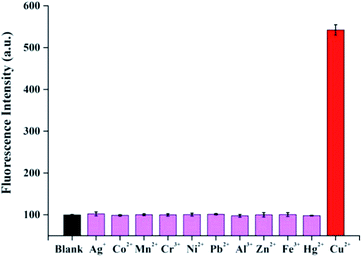 | ||
| Fig. 4 Selectivity test of the proposed method for Cu2+. The concentration of Cu2+ was 10 μM and other metal ions was 100 μM. Each experiment was performed three times. | ||
3.5 Analysis of selectivity and river samples
To evaluate the selectivity of the proposed method, other metal ions (Ag+, Co2+, Mn2+, Cr3+, Ni2+, Pb2+, Al3+, Zn2+, Fe3+, Hg2+) were investigated as controlled experiments under the same experimental conditions. As shown in Fig. 4, only Cu2+ resulted in a remarkable increase in the fluorescence intensity, while other metal ions could not cause obvious fluorescence intensity change, even they are 10 times concentration than copper. These results indicated this assay exhibits an excellent selectivity for discriminating Cu2+ from other metal ions.To further demonstrate the applicability of the developed method in complex matrixes, recovery experiments were carried out in river water samples. The obtained results are shown in Table 1, the recovery rates were in the range of 97.0–104.3% and the relative standard deviations (RSDs) were lower than 5%. In addition, the recoveries of standard addition were 101.4%, 98.5%, 99.6% and 102.3%, respectively for Cu2+ concentrations of 0.50, 2.00, 5.00 and 8.00 μM using ICP-MS method. The results obtained by the proposed method are comparable to ICP-MS, indicating the promising potential of this method for Cu2+ in real samples.
| Samples | Add (μM) | Found (μM) | Recovery (%) | RSD (%, n = 3) |
|---|---|---|---|---|
| 1 | 0.50 | 0.52 | 104.0 | 2.2 |
| 2 | 2.00 | 1.94 | 97.0 | 1.6 |
| 3 | 5.00 | 4.86 | 97.2 | 4.3 |
| 4 | 8.00 | 8.34 | 104.3 | 2.8 |
4. Conclusions
The proposed fluorescence assay for Cu2+ detection is based on click chemistry and exonuclease reaction. It designed only one dumbbell shaped DNA probe in the whole system, which served as both a template for click ligation and a signal probe for fluorescence dye. Compared with most of other reported methods, this assay is convenient without troublesome synthesis of materials, separation procedures and fluorescence dye labeling. Moreover, the proposed strategy shows high specificity by click chemistry reaction to recognize Cu2+. In addition, the developed assay exhibits satisfactory detection results in real complex sample analysis. The above merits allow this method to hold the potential applications in environmental and biological fields.Conflicts of interest
There are no conflicts to declare.Acknowledgements
This work was supported by the Project for Guangxi College Young and Middle-aged Teachers Basic Capability Improvement (No. 2019KY0082), Natural Science Foundation of Guangxi Province (No. 2017GXNSFFA198014) and BAGUI Scholar Program.Notes and references
- D. Denoyer, S. Masaldan, S. La Fontaine and M. A. Cater, Metallomics, 2015, 7, 1459–1476 RSC.
- B. E. Kim, T. Nevitt and D. J. Thiele, Nat. Chem. Biol., 2008, 4, 176–185 CrossRef CAS.
- P. G. Georgopoulos, A. Roy, M. J. Yonone-Lioy, R. E. Opiekun and P. J. Lioy, J. Toxicol. Environ. Health, Part B, 2001, 4, 341–394 CAS.
- D. R. Brown and H. Kozlowski, Dalton Trans., 2004, 13, 1907–1917 RSC.
- G. J. Brewer, Biofactors, 2012, 38, 107–113 CrossRef CAS PubMed.
- T. W. Lin and S. D. Huang, Anal. Chem., 2001, 73, 4319–4325 CrossRef CAS PubMed.
- D. Citak and M. Tuzen, Food Chem. Toxicol., 2010, 48, 1399–1404 CrossRef CAS PubMed.
- M. D. Ioannidou, G. A. Zachariadis, A. N. Anthemidis and J. A. Stratis, Talanta, 2005, 65, 92–97 CAS.
- N. G. Beck, R. P. Franks and K. W. Bruland, Anal. Chim. Acta, 2002, 455, 11–22 CrossRef CAS.
- Y. Guo, Z. Wang, W. Qu, H. Shao and X. Jiang, Biosens. Bioelectron., 2011, 26, 4064–4069 CrossRef CAS PubMed.
- F. Li, J. Wang, Y. Lai, C. Wu, S. Sun, Y. He and H. Ma, Biosens. Bioelectron., 2013, 39, 82–87 CrossRef CAS PubMed.
- B. Kumar Jena and C. Retna Raj, Anal. Chem., 2008, 80, 4836–4844 CrossRef PubMed.
- C. Lei, Z. Wang, Z. Nie, H. Deng, H. Hu, Y. Huang and S. Yao, Anal. Chem., 2015, 87, 1974–1980 CrossRef CAS PubMed.
- P. Yang, Y. Zhao, Y. Lu, Q. Xu, X. Xu, L. Dong and S. Yu, ACS Nano, 2011, 5, 2147–2154 CrossRef CAS.
- V. V. Rostovtsev, L. G. Green, V. V. Fokin and K. B. Sharpless, Angew. Chem., Int. Ed., 2002, 41, 2596–2599 CrossRef CAS.
- Q. Wang, T. R. Chan, R. Hilgraf, V. V. Fokin, K. B. Sharpless and M. G. Finn, J. Am. Chem. Soc., 2003, 125, 3192–3193 CrossRef CAS.
- D. Yang, Z. Guo, Y. Tang and P. Miao, ACS Appl. Nano Mater., 2018, 1, 168–174 CrossRef CAS.
- Q. Y. Zhou, F. Yuan, X. H. Zhang, Y. L. Zhou and X. X. Zhang, Chem. Sci., 2018, 9, 3335–3340 RSC.
- D. X. Wen, Q. R. Liu, Y. Cui, J. M. Kong, H. X. Yang and Q. Y. Liu, Sens. Actuators, B, 2018, 276, 279–287 CrossRef CAS.
- L. Zhou, Q. Shen, P. Zhao, B. Xiang, Z. Nie, Y. Huang and S. Yao, Methods, 2013, 64, 299–304 CrossRef CAS PubMed.
- Q. Shen, S. Tang, W. Li, Z. Nie, Z. Liu, Y. Huang and S. Yao, Chem. Commun., 2012, 48, 281–283 RSC.
- J. Su, J. Xu, Y. Chen, R. Yuan and Y. Chai, Biosens. Bioelectron., 2013, 45, 219–222 CrossRef CAS PubMed.
- S. Liao, J. Zhao, Y. Qin and S. Zhao, RSC Adv., 2017, 7, 55668–55672 RSC.
- J. Zong, X. Yang, A. Trinchi, S. Hardin, I. Cole, Y. Zhu and G. Wei, Biosens. Bioelectron., 2014, 51, 330–335 CrossRef CAS PubMed.
- Y. Wang, L. Wang, C. Zhang and F. Liu, Microchim. Acta, 2019, 186, 82 CrossRef PubMed.
- Z. Weng, H. Wang, J. Vongsvivut, R. Li, A. M. Glushenkov, J. He, Y. Chen, C. J. Barrow and W. Yang, Anal. Chim. Acta, 2013, 803, 128–134 CrossRef CAS PubMed.
- Y. Liu, D. Ding, Y. Zhen and R. Guo, Biosens. Bioelectron., 2017, 92, 140–146 CrossRef CAS PubMed.
Footnote |
| † Electronic supplementary information (ESI) available. See DOI: 10.1039/c9ra10174h |
| This journal is © The Royal Society of Chemistry 2020 |

