 Open Access Article
Creative Commons Attribution 3.0 Unported Licence
Effects of a forming process on the properties and structure of RANEY®-Ni catalysts for the hydrogenation of 1,4-butenediol
Xianlong Gaoa,
Wenlong Mo *a,
Fengyun Ma*a,
Tsubaki Noritatsu
 b,
Hongli Wua and
Xing Fana
aKey Laboratory of Coal Clean Conversion & Chemical Engineering Process (Xinjiang Uyghur Autonomous Region), College of Chemistry and Chemical Engineering, Xinjiang University, Urumqi, Xinjiang 830046, China. E-mail: mowenlong@xju.edu.cn; ma_fy@126.com
bDepartment of Applied Chemistry, School of Engineering, University of Toyama, Gofuku 3190, Toyama 930-8555, Japan
First published on 5th February 2020
Abstract
Three commercial Ni–Al alloys formed by a vacuum atomization method (NAV), atmospheric atomization method (NAA) and high-temperature melting method (NAH) were leached by 10 wt% NaOH solution to prepare three RANEY®-Ni catalysts (RNAV, RNAA and RNAH, correspondingly). The effects of a forming process on the structure of Ni–Al alloys and the corresponding RANEY®-Ni catalysts were investigated via XRD, XPS, SEM, TEM, NH3-TPD, N2 adsorption–desorption and EDX-mapping studies. Also, the as-prepared RANEY®-Ni catalysts were evaluated via the hydrogenation of 1,4-butenediol (BED) to produce 1,4-butanediol (BDO). The results showed that the specific surface areas and surface morphologies of the Ni–Al alloys present significant differences. Meanwhile, the RNAA sample presented a comparatively regular morphology, similar to a small piece of sugar cane. The weak and medium acid peak areas of the RNAA catalyst were lower than those of the other samples. RNAV showed higher weak and medium acid peak areas, demonstrating the higher number of acid centers on the surface of the catalyst. The surface of the RNAA catalyst obtained from NAA contained more active component-Ni, about 90 wt% on the surface, and the specific surface area of the sample was 75 times that of its precursor Ni–Al alloy powder (NAA). The evaluation results present that the RNAA catalyst shows better hydrogenation performance, with BED conversion of 100%, both BDO selectivity and yield of 46.11%.
Introduction
Selective hydrogenation of carbon–carbon double bonds to single bonds is important to produce valuable or fine chemicals. 1,4-Butanediol (BDO) is one of the most important organic and fine chemical raw materials; its derivatives are widely used in medicine, fiber and engineering plastics.1–6 The main process of BDO production is the Reppe method, which includes two steps;7,8 the production of 1,4-butynediol (BYD) from acetylene and formaldehyde and the hydrogenation of 1,4-butenediol (BED) to prepare 1,4-butanediol occur by two sequential processes, namely BYD to BED and BED to BDO. However, depth hydrogenation of BED is accompanied by side reactions, including double migration, hydrogenolysis, and isomerization, to form 4-hydroxybutanal (HALD), tetrahydrofuran, 1-ene-3-octanol, 2-hydroxytetrahydrofuran (HTHF), and 2-(4-hydroxybutoxy)-tetrahydrofuran (HBOTHF) by-products. Therefore, tuneable hydrogenation ability of BED to BDO is a crucial method for industrial use. The most commonly used catalyst is RANEY®-Ni. However, there are few reports considering catalysts prepared from alloys for BED hydrogenation.Zhang et al.9 adopted low pressure plasma spray (LPPS), high velocity oxygen fuel (HVOF) and low temperature high velocity oxygen fuel (LT-HVOF) to prepare Ni–Cr–Al–Y alloys on nickel-base superalloy K438 substrate. The results, from the standpoints of microstructure, element distribution, phase composition and basic properties, showed that the LPPS alloy presented a dense layered structure with high microhardness and good oxidation resistance; meanwhile, the HVOF alloy showed a typical layered structure with low microhardness and poor oxidation resistance, and the LT-HVOF alloy presented greatly decreased microhardness and good oxidation resistance. Cui et al.10 prepared Ag–25Ni alloy by powder metallurgy (PM), mechanical alloying (MA) and liquid phase reduction (LPR) methods. The electrochemical corrosion properties of the three alloys in 0.3 mol L−1 sodium chloride solution were investigated. The results showed that the corrosion current density of Ag–25Ni alloys decreased in the order of LPR Ag–25Ni, PM Ag–25Ni and MA Ag–25Ni. The passivation films formed by the three alloys were ascribed to n-type semiconductors; also, the passivation performance and chemical stability of MA Ag–25Ni alloy were better, which was attributed to the small grain size of MA Ag–25Ni alloy and the good solid solubility between Ag and Ni. Sun et al.11 carried out ultrasonic testing on FGH4096 alloys derived from different forming processes (hot isostatic pressing + forging and direct hot isostatic pressing). The results showed that the alloy obtained from the hot isostatic pressing + forging process demonstrated obvious defect signals, while the direct hot isostatic pressing alloy presented no defect signals. Therefore, the physical and chemical properties of materials obtained from various molding processes showed great differences.
There are many reports on the preparation process of RANEY®-Ni catalyst precursor (Ni–Al alloy).12,13 Wang et al.14 treated Ni–Al alloy with a high energy ball-milling machine and leached it with NaOH solution to produce RANEY®-Ni catalyst. The crystal structures and surface morphologies of the Ni–Al alloy and the corresponding RANEY®-Ni catalyst changed greatly compared to those of the untreated sample. The performance of the catalyst was investigated by hydrogenation of cyclohexanone. The results showed that the content of NiAl3 species in the Ni–Al alloys decreased with increasing ball milling time, while the content of Ni2Al3 crystal increased gradually. The treated RANEY®-Ni catalyst with a ball milling time of 12 h demonstrated better hydrogenation performance, with cyclohexanone conversion of 3.8%. Lee et al.15 investigated the structures of RANEY®-Ni catalysts prepared from Ni–Al alloys with different Ni contents (42 wt%, 50 wt% and 60 wt%). XRD characterization showed that the samples exhibited different phases with increasing Ni content. Ni42 and Ni50 were mainly composed of three phases of NiAl3, Ni2Al3 and eutectic Al. Ni50 contained more Ni2Al3 crystal and a small amount of NiAl3 phase, while Ni60 presented only Ni2Al3 phase. This study signified that Ni2Al3 phase demonstrated higher strength and NiAl3 phase showed better activity.16 The preparation of RANEY®-Ni catalysts with both good strength and activity is worthy of further study.
In the traditional BED hydrogenation process, noble metal (Ru,17 Pt,18 Pd,19 etc.) catalysts exhibit high catalytic activity. However, noble metals are scarce and expensive, which limits their large-scale application in industry. In order to meet the industrial demand, it is necessary to develop economical catalysts, such as RANEY®-Ni. It is reported that skeleton structure catalysts (catalysts prepared from alloys) can display superior catalytic properties (e.g. activity, selectivity and stability) during the hydrogenation process to those of nickel-based catalysts.20,21 Ni–Al alloys from different forming processes were leached by NaOH solution (vacuum atomization method, atmospheric atomization method and high temperature melting method) to prepare corresponding RANEY®-Ni catalysts, which were characterized by EDX, XRD N2-adsorption desorption, XPS, TEM and NH3-TPD methods. The effects of the different forming processes on the structure of Ni–Al alloy and the corresponding RANEY®-Ni catalyst were studied to achieve an optimized catalyst design and reach a maximum efficiency for the catalytic hydrogenation of 1,4-butenediol to 1,4-butanediol.
Experimental
Material synthesis
Ni–Al alloys (100 to 120 mesh) produced by different forming processes (vacuum atomization method, atmospheric atomization method (both from Qinghe County Aerospace Metal Materials Co., Ltd., China) and high-temperature melting method (Liaoning Zhongli Catalysts Technology Co., Ltd., China)) were leached by 10 wt% NaOH solution and stirred in a water bath at 80 °C for 90 min. The mixture was washed with absolute ethanol several times until the washing solution was neutral, then finally stored in absolute ethanol; thus, the RANEY®-Ni catalyst was obtained. The prepared RANEY®-Ni catalysts were named RNAA, RNAH and RNAV according to their forming processes.Material characterization
X-ray diffraction (XRD) analysis was carried out on an X-ray diffraction device (Rigaku D/Max-2500, Japan) using nickel filtered Cu Kα (λ = 0.15406 nm) radiation. The scan rate, diffraction range, tube voltage and tube current were 8° min−1, 5° to 80°, 40 kV and 100 mA, respectively. Nitrogen adsorption–desorption profiles at −196 °C were obtained by a Quantachrome Automated Gas Sorption apparatus (Micromeritics ASAP 2020). X-ray energy dispersive (EDX) analysis was carried out on a LEO 1530VP spectrometer from Germany with an accelerating voltage of 20 kV, working distance of 15 mm and acquisition time of 120 s. Scanning electron microscopy (SEM) images were obtained on a Hitachi H-600 microscope with an accelerated voltage of 100 kV. Transmission electron microscopy (TEM) micrographs were obtained using a JEOL JEM-2100 election microscope operating at 200 kV. The acidic properties of the catalysts were measured via temperature-programmed desorption of ammonia (NH3-TPD) using a Quantachrome Chemisorb instrument. A Thermo Fisher Scientific instrument (USA) was used for the X-ray photoelectron spectroscopy (XPS). The model is ESCALAB 250Xi, and the X-ray source was a monochromator, Al K alpha 1486.6 eV.Catalytic performance
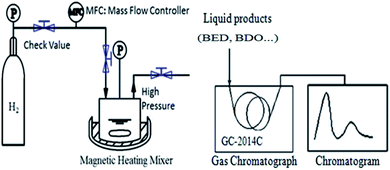
BED hydrogenation was conducted in a 50 mL high-pressure reactor (Dalian Tongda reactor factory, CJF-605, China), and the products were analyzed by a GC (GC 2014, Shimadzu Japan) equipped with an FID detector and an SH-RtxWax capillary column (30 m × 0.53 mm i.d.). The quantitative method for the GC analysis was calibrated with 1,3-propanediol as an internal standard. Fig. 1 shows a schematic of the hydrogenation and product analysis system setup. BED hydrogenation was carried out at 393 K under 5.0 MPa for 3 h, with a stirring rate of 400 rpm and catalyst addition of 0.4 g. The feedstock was 30 mL aqueous solution containing 35 wt% 1,4-butenediol.1,4-Butanediol, 1,4-butenediol, butyric anhydride, C8H16O and tetrahydrofuran were the main substances in the catalytic hydrogenation product of 1,4-butenediol; these were detected by a SH-Rtx-Wax capillary column. The performance of a hydrogenation catalyst is evaluated by its BED conversion, BDO selectivity and yield, which can be calculated by eqn (1), (2) and (3), respectively.
Performance of the catalyst:
| BED conversion, X (%) = 1 − (C2/(C1 + C2 + C3 + C4 + C5)) × 100 | (1) |
| BDO selectivity, S (%) = C1/(C1 + C3 + C4 + C5) × 100 | (2) |
| BDO yield, Y (%) = X × S × 100 | (3) |
Results and discussion
Textural characteristics
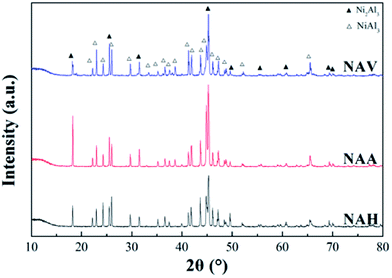
Fig. 2 shows the XRD patterns of the Ni–Al alloys obtained from different forming methods. All the samples were composed of two crystal phases of NiAl3 and Ni2Al3.22,23 The diffraction peak positions of NiAl3 and Ni2Al3 for the three samples were the same, indicating that the forming method did not change the crystal composition of the Ni–Al alloy. Meanwhile, the diffraction peak intensities and half-peak widths of the two crystals were quite different, demonstrating that the grain sizes of the two species were different. NAA produced by the atmospheric atomization method demonstrated a high diffraction peak intensity and low half-peak width of NiAl3 phase and Ni2Al3 phase, indicating that its crystal structure was more complete. According to Scherrer's law (D = 0.89λ/(β![[thin space (1/6-em)]](https://www.rsc.org/images/entities/char_2009.gif) cos
cos![[thin space (1/6-em)]](https://www.rsc.org/images/entities/char_2009.gif) θ)), the grain sizes of Ni2Al3 and NiAl3 were calculated at 2θ = 18.2° and 2θ = 24.5°, and the results are shown in Table 1.
θ)), the grain sizes of Ni2Al3 and NiAl3 were calculated at 2θ = 18.2° and 2θ = 24.5°, and the results are shown in Table 1.
| Sample | Size of Ni2Al3 (nm) | Size of NiAl3 (nm) |
|---|---|---|
| a Calculated by the Scherrer formula at the 2 theta angles of Ni2Al3 and NiAl3. | ||
| NAV | 1.05 | 1.29 |
| NAA | 1.49 | 1.16 |
| NAH | 1.23 | 1.56 |
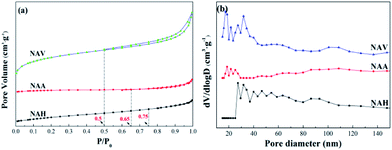
The N2 adsorption–desorption characterization results are shown in Fig. 3. According to the International Union of Theoretical and Applied Chemistry (IUPAC) classification, it can be seen that the adsorption isotherms can be ascribed to type III, which is a feature of weak gas–solid interactions on a solid surface. The corresponding hysteresis loops are type H3, and the morphology may be a sheet structure.24
Fig. 3(a) depicts the N2 adsorption–desorption isotherms of the Ni–Al alloys. The three samples present large differences in the areas of their hysteresis loops. The hysteresis loops of NAA and NAH are extremely small, and their isothermal adsorption lines and desorption lines nearly coincide. Also, the three samples show large differences in their adsorption and desorption curve closure points, with NAH closing at P/P0 = 0.75, NAA at P/P0 = 0.65 and NAV at P/P0 = 0.5. The pore structures of the samples are quite different; NAH and NAA contain more mesopores,25 while NAV showed a certain number of macropores,26 which is consistent with the pore size distributions shown in Fig. 4(b).
Fig. 3(b) shows the pore size distributions of the three samples obtained from the different forming methods. According to the principle of N2 adsorption–desorption isotherms, a high dV/dlog![[thin space (1/6-em)]](https://www.rsc.org/images/entities/char_2009.gif) D value indicates more pores in the corresponding pore size range. The pore diameter peaks of all the samples were in the range of 10 to 50 nm, demonstrating that the three samples are mesoporous materials.27 The most probable pore diameters of the samples were quite different; those of the NAV and NAH samples were about 30 nm, while that of NAA was nearly 20 nm.
D value indicates more pores in the corresponding pore size range. The pore diameter peaks of all the samples were in the range of 10 to 50 nm, demonstrating that the three samples are mesoporous materials.27 The most probable pore diameters of the samples were quite different; those of the NAV and NAH samples were about 30 nm, while that of NAA was nearly 20 nm.
According to the N2 adsorption–desorption isotherms, the specific surface areas of the samples were calculated by the BET equation and the pore volumes and average pore diameters were calculated by the BJH equation, as shown in Table 2. The average pore sizes of NAV and NAH were about 6.0 nm, and that of NAA was about 13.4 nm; these are not consistent with the results of the most probable pore sizes in the N2 adsorption–desorption curves (Fig. 3(b)). Because the pore structure parameters were calculated from the microporous portions of the materials, the N2 physical adsorption results show only the mesoporous sizes. Thus, the pore size distribution only includes pores greater than 10 nm, and no microporous pores were included. The specific surface areas of all the samples also displayed large differences, with 0.86 m2 g−1 for NAA and 12.15 m2 g−1 for NAV; this may be due to the fact that the sample used in the vacuum atomization method was a liquid metal or alloy with gas supersaturation during the preparation process. The gas can expand to transform the liquid metal or alloy into powder under vacuum conditions; this forms a large amount of pores, resulting in a larger specific surface area.28,29 The melting process fused the metals, nickel and aluminum, in the melting furnace; the obtained melt was quenched and cooled, then pulverized into uniform fine particles. The atmospheric atomization method uses a high-speed air stream or liquid stream to directly crush the liquid metal or alloy to obtain metal powder; this process involves almost no pore formation and presents low specific surface areas.30
| Samples | Specific surface areaa (m2 g−1) | Pore volumeb (cm3 g−1) | Average pore diameterc (nm) |
|---|---|---|---|
| a Calculated by the Brunauer–Emmett–Teller (BET) equation.b Barrett–Joyner–Halenda (BJH) desorption average pore diameter.c Barrett–Joyner–Halenda (BJH) desorption pore volume. | |||
| NAV | 12.15 | 0.011 | 5.66 |
| NAA | 0.86 | 0.002 | 13.39 |
| NAH | 2.78 | 0.003 | 5.86 |
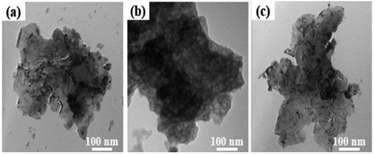
Fig. 4 shows TEM images of the Ni–Al alloys at a magnification of 100![[thin space (1/6-em)]](https://www.rsc.org/images/entities/char_2009.gif) 000. All the samples showed a sheet morphology. The alloy produced by the vacuum atomization method and high-temperature melting process presented a petal-like morphology. For the NAA sample, the porous surface structure can be clearly observed, which may be related to its crystal phase properties (composed of Ni2Al3, NiAl3, Ni3Al, etc.).31,32
000. All the samples showed a sheet morphology. The alloy produced by the vacuum atomization method and high-temperature melting process presented a petal-like morphology. For the NAA sample, the porous surface structure can be clearly observed, which may be related to its crystal phase properties (composed of Ni2Al3, NiAl3, Ni3Al, etc.).31,32
EDX analysis was carried out for the prepared catalysts, and the results are given in Table 3. It can be seen from Table 3 that the relative Ni content of each sample was more than 87 wt%, which was 1.81 times higher than the Ni content (48 wt%) in the alloy powder; this indicates that a large amount of Al element was washed away during the leaching process (① Al + OH− → [Al(OH)4]−, ② [Al(OH)4]− → Al(OH)3 + OH−, with the production of aluminum hydroxide and hydrated alumina). Some aluminum was also retained. Once Al element was completely leached, the skeleton structure of the RANEY®-Ni catalyst was seriously damaged, resulting in crystal agglomeration and decreasing the activity of the catalyst.33,34 More Ni species on the RNAA catalyst were detected with a content of 90 wt%, showing that it possesses more active sites. Additionally, the atomic ratio of Ni/Al of each sample is shown in Table 3. It can be seen from Table 3 that the RNAA sample presented a large Ni/Al molar ratio, which may be related to a certain degree of agglomeration of Ni (Fig. 5). The ratio of RNAA was large (3.93), which may be derived from the better dispersion of Ni on the surface of the catalyst (Fig. 5).
| Sample | Al/wt% | Ni/wt% | N(Ni)/n(Al) |
|---|---|---|---|
| RNAH | 12.94 | 87.06 | 3.09 |
| RNAA | 10.47 | 89.53 | 3.93 |
| RNAV | 11.48 | 88.52 | 3.55 |
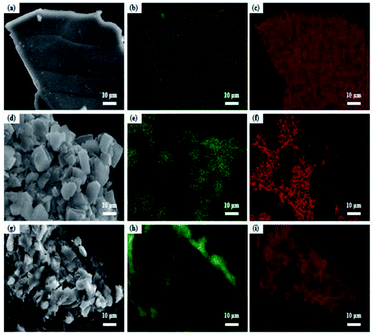 | ||
| Fig. 5 EDX-mapping photos of the catalysts: (a) RNAV; (b) RNAV-Al; (c) RNAV-Ni; (d) RNAA; (e) RNAA-Al; (f) RNAA-Ni; (g) RNAH; (h) RNAH-Al; (i) RNAH-Ni. | ||
To verify the distribution of each element on the RANEY®-Ni surface, EDX-mapping tests were performed, and the results are shown in Fig. 5. It can be seen from the mapping diagram that Ni and Al are distributed uniformly, and the Al element on the surface of RNAV was relatively sparse compared to the distribution of Ni element.35
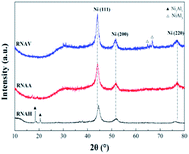
Fig. 6 shows the XRD patterns of the three RANEY®-Ni catalysts. All the catalysts presented characteristic diffraction peaks at 2θ = 44.1°, 51.3° and 76.3°, corresponding to Ni(111), Ni(200) and Ni(220), respectively.36 There were no Ni2Al3 or NiAl3 diffraction peaks for the RNAA sample, indicating that the leaching process was relatively complete (with a Ni/Al ratio as high as 3.93). For the RNAH sample, the diffraction peaks of Ni2Al3 species were observed at 2θ = 18.4° and 20.5°. Also, the diffraction peaks of the NiAl3 species were detected in RNAV at 2θ = 65.0° and 66.7°.
For RNAH, the diffraction peak intensity of Ni was lower than those of RNAV and RNAA, and the half-peak width (β) was larger. According to Scherrer's formula (D = 0.89λ/(β![[thin space (1/6-em)]](https://www.rsc.org/images/entities/char_2009.gif) cos
cos![[thin space (1/6-em)]](https://www.rsc.org/images/entities/char_2009.gif) θ)), it is obvious that the Ni crystal in RNAH is small in size.
θ)), it is obvious that the Ni crystal in RNAH is small in size.
According to Scherrer's law (D = 0.89λ/(β![[thin space (1/6-em)]](https://www.rsc.org/images/entities/char_2009.gif) cos
cos![[thin space (1/6-em)]](https://www.rsc.org/images/entities/char_2009.gif) θ)), the grain sizes of Ni crystal were calculated at 2θ = 44.1°, and the results are shown in Table 4.
θ)), the grain sizes of Ni crystal were calculated at 2θ = 44.1°, and the results are shown in Table 4.
| Sample | Before reaction with Ni (nm) | After reaction with Ni (nm) |
|---|---|---|
| a Calculated by the Scherrer formula at the 2 theta angle of Ni(111). | ||
| RNAH | 0.136 | 0.088 |
| RNAA | 0.166 | 0.097 |
| RNAV | 0.170 | 0.116 |
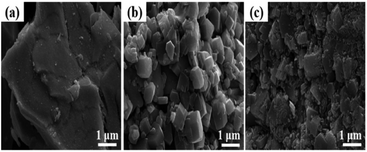
Fig. 7 shows the SEM images of the catalysts. Relatively fragmented, irregularly shaped particles can be clearly observed on the surface of the RNAH catalyst. Meanwhile, the RNAA sample presents a comparatively regular morphology, similar to a small piece of sugar cane.30 In addition, there are some finer particles on the surface of the RNAV sample.
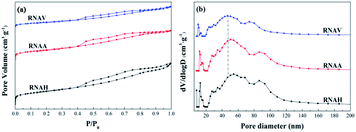
Fig. 8 shows the N2 adsorption–desorption isotherms (a) and pore size distributions (b) of the prepared catalysts. According to the IUPAC classification, the isothermal adsorption lines of the three catalysts can be ascribed to type III, indicating that the adsorption heat of N2 on the catalyst is lower than its liquefaction heat. Also, the adsorption isotherm type of each sample was almost the same, and there are obvious H3 hysteresis loops in the range of P/P0 = 0.4 to 1.0.
Fig. 8(a) shows that the area of the hysteresis loop is different for each catalyst. Also, the hysteresis loop area of RNAH is larger than that of RNAV. Fig. 8(b) describes the pore size distributions of the prepared catalysts. Compared with the pore size distribution of Ni–Al alloy, the most probable pore size varied significantly. Because of the leaching process with NaOH solution, the pore size of each sample showed three-stage distribution characteristics of 10 to 20 nm, 40 to 70 nm and 80 to 100 nm, which is a typical feature of mesoporous–mesoporous–macroporous multi-level pore distribution.
The specific surface areas of the prepared catalysts were calculated by the BET equation, and the pore volumes and average pore diameters were calculated by the BJH equation, as shown in Table 5. The areas of the three samples were between 35 m2 g−1 and 85 m2 g−1, the pore volumes were 0.05 to 0.10 cm3 g−1, and the average pore diameters were 4 to 6 nm, indicating that the prepared catalysts are mesoporous materials. Compared with the corresponding Ni–Al alloy, the surface area of RNAA increased greatly, to 75 times that of NAA. This may be because the surface of the RNAA sample presented a relatively porous structure (TEM), and the average pore size changed greatly from 13.39 nm (NAA) to 4.29 nm.
| Sample | Specific surface areaa (m2 g−1) | Pore volumeb (cm3 g−1) | Average pore diameterc (nm) |
|---|---|---|---|
| a Calculated by the Brunauer–Emmett–Teller (BET) equation.b Barrett–Joyner–Halenda (BJH) desorption average pore diameter.c Barrett–Joyner–Halenda (BJH) desorption pore volume. | |||
| RNAV | 37.43 | 0.05 | 4.90 |
| RNAA | 65.50 | 0.07 | 4.29 |
| RNAH | 84.36 | 0.10 | 5.17 |
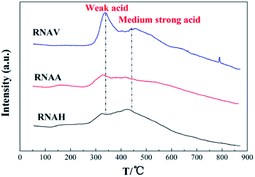
Fig. 9 shows the NH3-TPD diagrams of the catalysts. It was observed that all the samples presented two distinct NH3 desorption peaks around 330 °C and 450 °C, indicating that there are two kinds of acid centers on the surface of the samples; the former is located in the low temperature zone (250 °C to 380 °C), corresponding to weak acid centers.37–39 The latter is located in the medium temperature area (380 °C to 500 °C), corresponding to medium acid centers.40–42
It can also be seen that the surface acidities are quite different for the catalysts prepared from different Ni–Al alloys. The weak and medium acid peak areas of the RNAA catalyst were lower than those of the others, indicating that the amount of acid centers available for adsorbing ammonia is low. RNAV, with higher weak and medium acid peak areas, demonstrated more acid centers.
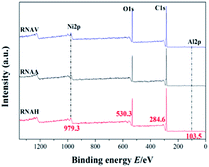
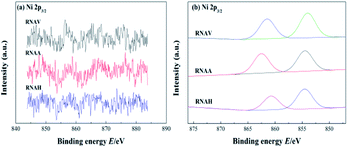
To research the valence state of each metal element on the catalyst surface, XPS analysis was carried out, as shown in Fig. 10. There are four peaks centered at 103.5, 284.6, 530.3 and 979.3 eV, attributed to Al 2p, C 1s, O 1s and Ni 2p, respectively.43–45 Nearly identical intensities of the Ni 2p peak at 979 eV for the different catalysts were detected, indicating that the RANEY®-Ni catalysts from the Ni–Al alloys prepared by different forming methods demonstrate almost the same interactions between Ni and the surrounding metal–Al.
Fig. 11(a) shows the XPS spectrum of Ni 2p3/2 of each catalyst. The peaks in the range of 840 to 890 eV were attributed to Ni 2p3/2; fitting of this peak was performed, and the fitting results are shown in Fig. 11(b) and Table 6.46,47
| Samples | Ni 2p3/2-1 (±0.3 eV) | Ni 2p3/2-2 (±0.3 eV) |
|---|---|---|
| RNAV | 861.4 | 854.0 |
| RNAA | 862.4 | 854.6 |
| RNAH | 860.6 | 854.5 |
There were two Ni 2p3/2 peaks, Ni 2p3/2-1 and Ni 2p3/2-2, in each catalyst. The former was located in the lower binding energy region (850 to 857 eV), and the latter was located in the higher region (857 to 865 eV). The binding energies of Ni 2p3/2-1 and Ni 2p3/2-2 for RNAA were 862.4 and 854.6 eV, respectively; these are higher than those of the other two catalysts, indicating that the active metal–Ni was more stable.
Fig. 12 shows the evaluation results of the performance of the prepared RANEY®-Ni catalysts in the hydrogenation of 1,4-butenediol (BED). It can be seen from Fig. 12 that the BED conversion of each catalyst was as high as 100%. Also, the selectivity of BDO obviously changed due to the different structure morphology of each catalyst. 1,4-Butenediol selectivity follows the following sequence: RNAA > RNAV > RNAH. RNAA showed better selectivity, with BED conversion of 100%, both BDO selectivity and BDO yield of 46.11%. According to catalyst characterization, the reason for the better performance of the RNAA sample may be related to the following factors: regular surface morphology, relatively complete leaching process (without Ni2Al3 and NiAl3 phases), high Ni/Al molar ratio and weak surface acidity. It is thought that the Ni/Al molar ratio, morphology and acidity strength are the most important factors. In addition, the selectivity for BDO of 46.11% is not beneficial for separating and purifying the product, and the catalyst preparation and reaction conditions should be further adjusted to increase the selectivity for the desired product.
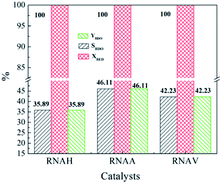 | ||
| Fig. 12 Catalytic properties of RANEY®-Ni catalysts for the hydrogenation of 1,4-butenediol. Reaction conditions: 5.0 MPa (pure H2), 393 K, 0.5 g catalyst, 30 mL 1,4-butenediol (35 wt% in water). | ||
Fig. 13 shows the selectivity distributions of the hydrogenation products. The selectivities for 1,4-butanediol (BDO), 4-hydroxybutyraldehyde (HALD), tetrahydrofuran (THF), 1-ene-3-octanol (C8H16O) and other species, such as 2-hydroxytetrahydrofuran (HTHF) and 2-(4-hydroxybutoxy) tetrahydrofuran (HBOTHF), were compared. Each sample has good selectivity for 1,4-butanediol. It can also be seen from Fig. 13 that the selectivity of tetrahydrofuran was high (20%), next to BDO. Also the selectivities for 1,4-butanediol, tetrahydrofuran, butyric anhydride (BA) and 1-ene-3-octanol (C8H16O, EO) followed the order of BDO > THF > BA > EO.
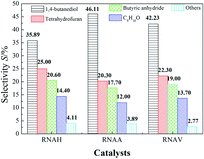 | ||
| Fig. 13 BED selectivities of the different catalysts. Reaction conditions: 5.0 MPa (pure H2), 393 K, 0.5 g catalyst, 30 mL 1,4-butenediol (35 wt% in water). | ||
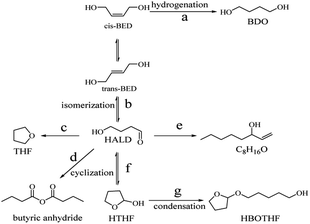
Based on previous reports7,8 and the current experimental results, a possible reaction pathway is proposed in Fig. 14. The raw material was a mixture of cis-1,4-butenediol and trans-1,4-butenediol, of which some was hydrogenated to obtain the target product 1,4- butanediol. The other part was isomerized to produce 4-hydroxybutyraldehyde. In addition, tetrahydrofuran, 1-ene-3-octanol (C8H16O) and butyric anhydride were obtained by a series of chemical reactions. There was also a very small amount of HALD to produce 1-hydroxyl cyclobutyl ether by cyclization and to form HBOTHF by a condensation reaction.
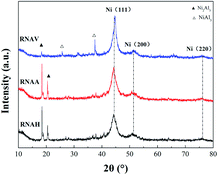
The used catalysts were subjected to XRD characterization, and the results are shown in Fig. 15. Diffraction peaks of the active component Ni still appear at 2θ = 44.1°, 51.3° and 76.3°. Compared with the fresh catalyst, the Ni(220) diffraction peaks detected in RNAA and RNAV at 2θ = 75.6° were weaker and more diffuse. This may be because the above two catalysts were subjected to high speed stirring for 3 h in the reactor, which may decrease the degree of Ni dispersion and destroy its crystal structure. For RNAH, Ni2Al3 diffraction peaks were detected at 2θ = 17.9° and 21.3°. The active component Ni and the structural promoter “Ni2Al3 crystal” did not significantly change compared with the fresh sample.48,49 For RNAA, the Ni2Al3 diffraction peaks were clearly detected at 2θ = 17.9° and 21.3°; this may also be derived from the stirring of the sample for 3 h at 120 °C and 400 rpm, which exposed the Ni2Al3 crystal and enabled it to be detected by XRD.
Conclusions
The structure and properties of RANEY®-Ni catalysts obtained from different forming processes of Ni–Al alloy leached by 10 wt% NaOH solution were investigated. Based on previous reports9–11 and current experimental results, the properties of the materials obtained from various molding process and their physical and chemical properties showed great differences. It was found that the surface morphology, crystal structure, Ni/Al molar ratio and surface acidity of Ni–Al alloy and the corresponding catalysts varied greatly. Evaluation experiments showed that the RNAA catalyst from Ni–Al alloy by the atmospheric atomization method presented well catalytic performance with BED conversion of 100%, both BDO selectivity and BDO yield of 46.11%. The well performance might be related to the following factors: ① regular surface morphology; ② uniform crystal structure; ③ high Ni/Al ratio; and ④ weak surface acidity.Abbreviations
| XRD | X-ray diffraction |
| SEM | Scanning electron microscopy |
| TEM | Transmission electron microscopy |
| NH3-TPD | NH3 temperature programmed desorption |
| XPS | X-ray photoelectron spectroscopy |
| EDX | Energy dispersive X-ray |
| BED | 1,4-Butenediol |
| BDO | 1,4-Butanediol |
| BET | Brunauer–Emmett–Teller |
| IUPAC | International Union of Pure and Applied Chemistry |
| BJH | Barrett–Joyner–Halenda |
| L | Length, m |
| t | Time, s |
| m | Quality, g |
| SBET | Specific surface area, m2 g−1 |
| D | Diameter, nm |
| V | Volume per unit mass, mL g−1 |
| P | Pressure, MPa |
| ν | Rotate speed, rpm |
Conflicts of interest
There are no conflicts to declare.Acknowledgements
This work was supported by the Xinjiang Uygur Autonomous Region Key R&D Program (2017B02012) and Xinjiang University Natural Science Foundation Project (BS160221).References
- I. Miklóssy, Z. Bodor, R. Sinkler, K. C. Orban, S. Lanyi and B. Albert, In silico and in vivo stability analysis of a heterologous biosynthetic pathway for 1,4-butanediol production in metabolically engineered, J. Biomol. Struct. Dyn., 2016, 35(9), 1–16 Search PubMed.
- S. Fei, G. B. Li, H. L. Sun and F. C. Wang, Kinetics of Transesterification of 1,4-Butanediol With Methyl Acetate by the Ion-exchange Resin, Bull. Korean Chem. Soc., 2017, 38(3), 369–377 CrossRef.
- H. T. Li, Y. L. Xu, C. G. Gao and Y. X. Zhao, Structural and textural evolution of Ni/γ-Al2O3 catalyst under hydrothermal conditions, Catal. Today, 2010, 158(3–4), 475–480 CrossRef CAS.
- F. Y. Gao, X. L. Tang, H. H. Yi, J. Y. Li, S. Z. Zhao, J. G. Wang, C. Chu and C. L. Li, Promotional mechanisms of activity and SO2 tolerance of Co or Ni-doped MnOx–CeO2 catalysts for SCR of NOx with NH3 at low temperature, Chem. Eng. J., 2017, 317, 20–31 CrossRef CAS.
- H. T. Li, Y. X. Zhao, C. G. Gao, Y. Z. Wang, Z. J. Sun and X. Y. Liang, Study on deactivation of Ni/Al2O3 catalyst for liquid phase hydrogenation of crude 1,4-butanediol aqueous solution, Chem. Eng. J., 2012, 181(1), 501–507 CrossRef.
- Z. J. Sun, H. T. Li, Y. L. Xu, J. B. Wu and Y. X. Zhao, Effects of the promoter on catalytic activity and hydrothermal stability of Ni/γ-Al2O3 catalysts, Ind. Catal., 2012, 20(5), 14–18 CAS.
- E. V. Pyatnitsyna, I. M. El'Chaninov and M. M. El'Chaninov, Chemical method for removal of impurities impairing the quality of commercial 1,4-butanediol produced by the Reppe method, Russ. J. Appl. Chem., 2014, 87(1), 104–107 CrossRef CAS.
- P. D. G. N. Schrauzer, P. Glockner and S. Eichler, Coordination Chemistry and Catalysis. Investigations on the Synthesis of Cyclooctatetraene by the Method of W. Reppe, Angew. Chem., Int. Ed., 2010, 3(3), 185–191 CrossRef.
- X. G. Zhang, C. G. Deng, C. M. Deng, H. Z. Pei and X. F. Zhang, Coating and properties of Ni–Cr–Al–Y alloy prepared by different processes, Met. Sci. Heat Treat., 2015, 40(08), 79–83 Search PubMed.
- T. L. Cui, X. Gu, Z. Q. Jia, X. T. Yin, Z. Q. Cao and K. Zhang, Corrosion behavior of nanocrystalline Ag–25Ni Alloy prepared by different processes in NaCl solution, Mater. Guide, 2018, 32(16), 2798–2802+2815 Search PubMed.
- Z. K. Sun, R. H. Lv, J. Jia, S. B. Han, Y. W. Zhang and L. Xie, Effect of different forming processes on ultrasonic defect signal of Nickel-Based powder superalloy, Powder Metall. Ind., 2018, 28(2), 12–17 Search PubMed.
- H. V. Tümer, R. O. Feuge and E. R. Cousins, Raney nickel catalyst of improved stability and reactivity in the hydrogenation of triglycerides, J. Am. Oil Chem. Soc., 1964, 41(3), 212–214 CrossRef.
- S. Knies, M. Berweiler, P. Panster, H. E. Exner and D. J. Ostgard, The effects of Raney alloy structure on the activation process and the properties of the resulting catalyst, Stud. Surf. Sci. Catal., 2000, 130(11), 2249–2254 CrossRef.
- M. H. Wang, X. Y. Wang and H. Lei, High energy ball milling refinement of Ni–Al Alloy and Its Raney-Ni catalyst for hydrogenation of cyclohexanone, Shenyang University, 2015, 27(6), 431–434 Search PubMed.
- G. D. Lee, C. S. Suh, J. H. Park, S. S. Park and S. S. Hong, Raney Ni catalysts derived from different alloy precursors (I) morphology and characterization, Korean J. Chem. Eng., 2005, 22(3), 375–381 CrossRef CAS.
- X. Ye, Y. An and G. Xu, Kinetics of 9-ethylcarbazole hydrogenation over Raney-Ni catalyst for hydrogen storage, J. Alloys Compd., 2011, 509(1), 156 CrossRef.
- Y. J. Ma, J. Li, J. X. Ye, D. L. Liu and W. B. Zhang, Synthesis of chiral chromanols via a RuPHOX–Ru catalyzed asymmetric hydrogenation of chromones, Chem. Commun., 2018, 54(96), 13571–13574 RSC.
- Q. Wang, Z. G. Hou, B. Zhang, J. Liu, W. Y. Song, D. S. Xue, L. Z. Liu, D. Wang and X. G. Chen, Preparation of a highly efficient Pt/USY catalyst for hydrogenation and selective ring-opening reaction of tetralin, Pet. Sci., 2018, 15(3), 605–612 CrossRef CAS.
- B. Rohit, B. P. Dennis, M. B. Nicholas, R. N. Rajesh and R. K. Marc, Structural control and catalytic reactivity of peptide-templated Pd and Pt nanomaterials for olefin hydrogenation, J. Phys. Chem. C, 2013, 117(35), 18053–18062 CrossRef.
- G. H. Luo, Y. L. Wang, D. M. Sun, X. Xu and H. B. Jin, Effect of preparation process on compressive strength and hydrogenation performance of Raney-Ni/Al2O3 catalyst, China Pet. Process. Petrochem. Technol., 2017, 19(2), 14–20 Search PubMed.
- X. J. Shen, J. L. Wen, P. L. Huang, K. Zheng, S. F. Wang, Q. Y. Liu, C. Adam and R. C. Sun, Efficient and product-controlled depolymerization of lignin oriented by Raney-Ni cooperated with CsxH3−xPW12O40, BioEnergy Res., 2017, 10(4), 1–8 CrossRef.
- Z. Q. Wen, Y. H. Zhao, H. Hua, J. Z. Tian and P. D. Han, First-principles studied Ni–Al intermetallic compounds under various temperature and pressure, Superlattices Microstruct., 2017, 103, 9–18 CrossRef CAS.
- X. X. Meng, C. Li, X. F. Liu, Y. C. Liu, L. M. Yu and H. J. Li, Morphological transition of eutectic NiAl3 phase in Al–Mg2Si cast alloys, Ferroelectr, 2017, 521(1), 108–115 CrossRef CAS.
- D. Imeson, Studies of supported metal catalysts using high resolution secondary electron imaging in a STEM, J. Microsc., 2011, 147(1), 65–74 CrossRef.
- C. H. Lu, Z. F. Ning, Q. Wang and M. Q. Chen, Application of NMR T2 to Pore Size Distribution and Movable Fluid Distribution in Tight Sandstones, Energy Fuels, 2018, 32(2), 1395–1405 CrossRef.
- D. C. Hu, J. J. Gao, P. Yuan, L. H. Jia, P. Gunawan, Z. Y. Zhong, G. W. Xu, F. N. Gu and F. B. Su, Enhanced investigation of CO methanation over Ni/Al2O3 catalysts for synthetic natural gas production, Ind. Eng. Chem. Res., 2012, 51(13), 4875–4886 CrossRef CAS.
- E. W. Hansen, S. A. Michael and R. Schmidt, Low-Temperature Phase Transition of Water Confined in Mesopores Probed by NMR. Influence on Pore Size Distribution, J. Phys. Chem., 2010, 100(6), 2195–2200 CrossRef.
- L. Jin and M. Yan, Novel Flower-like Hyperbranched ZnTe Nanostructures Prepared via Catalyst-assisted Vacuum Thermal Evaporation, Ceram. Int., 2017, 43(15), 11715–11721 CrossRef.
- F. A. Cabralesnavarro and P. Pereiraalmao, Catalytic Steam Cracking of a Deasphalted Vacuum Residue Using a Ni/K Ultradispersed Catalyst, Energy Fuels, 2017, 31(3), 3121–3131 CrossRef CAS.
- M. M. U. Rehman, K. T. Kim, K. H. Na and K. H. Choi, Atmospheric deposition process for enhanced hybrid organic–inorganic multilayer barrier thin films for surface protection, Appl. Surf. Sci., 2017, 422, 273–282 CrossRef.
- A. Elsayed, R. Ibrahim, M. Bahlol and O. Dawood, Synthesis of Cu–Ni–Al Shape Memory Alloy by Powder Metallurgy, Mater. Sci. Forum, 2018, 941, 1618–1622 Search PubMed.
- X. Liu, X. H. Mao, H. W. Xie and X. Cai, Influence of process parameters on characteristics of Fe–Si–Ni–Al–Ti soft magnetic alloy powder prepared by inert-gas atomization, Powder Metall Technol, 2015, 21(3), 184–188 Search PubMed.
- S. Knies, M. Berweiler, P. Panster, H. E. Exner and D. J. Ostgard, The effects of Raney alloy structure on the activation process and the properties of the resulting catalyst, Stud. Surf. Sci. Catal., 2000, 130(11), 2249–2254 CrossRef.
- B. W. Hoffer, E. Crezee, F. Devred, P. R. M. Mooijman, W. G. Sloof and P. J. Kooyman, The role of the active phase of Raney-type Ni catalysts in the selective hydrogenation of D-glucose to D-sorbitol, Appl. Catal., A, 2003, 253(2), 437–452 CrossRef CAS.
- J. X. Song, Z. X. Yu, M. L. Gordin, S. Hu, R. Yi, D. H. Tang, T. Walter, M. Ragula, D. Choi, X. L. Li, A. Manivannan and D. H. Wang, Chemically Bonded Phosphorus/Graphene Hybrid as a High Performance Anode for Sodium-Ion Batteries, Nano Lett., 2014, 14(11), 6329–6335 CrossRef CAS PubMed.
- A. L. Wang, H. B. Yin, H. H. Lu, J. J. Xue, M. Ren and T. S. Jiang, Effect of organic modifiers on the structure of nickel nanoparticles and catalytic activity in the hydrogenation of p-nitrophenol to p-aminophenol, Langmuir, 2009, 25(21), 12736–12741 CrossRef CAS PubMed.
- T. Annette and H. Bernd, Characterization of Acidic OH Groups in Y-Type Zeolites by Means of Different Methods of Temperature-Programmed Desorption (TPD) of Ammonia, Top. Catal., 2002, 19(3–4), 215–223 Search PubMed.
- M. Stanciulescu, P. Bulsink, G. Caravaggio and L. N. Burich, NH3-TPD-MS study of Ce effect on the surface of Mn- or Fe-exchanged zeolites for selective catalytic reduction of NOx by ammonia, Appl. Surf. Sci., 2014, 300(5), 201–207 CrossRef CAS.
- S. X. Wang, R. T. Guo, W. G. Pan, M. Y. Li, P. Sun, S. M. Liu, S. W. Liu, X. Sun and J. Liu, The deactivation mechanism of Pb on the Ce/TiO2 catalyst for the selective catalytic reduction of NOx with NH3: TPD and DRIFT studies, Phys. Chem. Chem. Phys., 2017, 19(7), 5333–5342 RSC.
- S. I. Tanaka, N. Hirose, T. Tanaki and Y. H. Ogata, Effect of Ni–Al precursor Alloy on the catalytic Activity for a Raney-Ni cathode, J. Electrochem. Soc., 2000, 147(6), 2242 CrossRef CAS.
- H. Bernd, H. Matthias, L. A. Clark and Q. S. Randall, Characterization of Acidic OH groups in zeolites of different types:
![[thin space (1/6-em)]](https://www.rsc.org/images/entities/char_2009.gif) An interpretation of NH3-TPD results in the light of confinement effects, J. Phys. Chem. B, 2016, 106(15), 21–36 Search PubMed.
An interpretation of NH3-TPD results in the light of confinement effects, J. Phys. Chem. B, 2016, 106(15), 21–36 Search PubMed. - G. Bagnasco, L. Beneš, P. Galli, M. Massucci, P. Patrono, M. Turco and V. Zima, TG/DTA, XRD and NH3-TPD characterization of layered VOPO4·2H2O and its Fe3+-substituted compound, J. Therm. Anal. Calorim., 1998, 52(2), 615–630 CrossRef CAS.
- S. V. P. Vattikuti, B. P. Reddy, C. Byon and J. Shim, Carbon/CuO nanosphere-anchored g-C3N4, nanosheets as ternary electrode material for supercapacitors, J. Solid State Chem., 2018, 262(6), 106–111 CrossRef CAS.
- L. Zhang, M. N. Ou, H. C. Yao, Z. H. Li, D. Y. Qu, F. Liu, J. C. Wang, J. S. Wang and Z. J. Li, Enhanced supercapacitive performance of graphite-like C3N4 assembled with NiAl-layered double hydroxide, Electrochim. Acta, 2015, 186, 292–301 CrossRef CAS.
- B. B. Wei, H. F. Liang, R. R. Wang, D. F. Zhang, Z. B. Qi and Z. C. Wang, One-step synthesis of graphitic-C3N4/ZnS composites for enhanced supercapacitor performance, J. Energy Chem., 2018, 27(2), 472–477 CrossRef.
- J. K. Kesavan, I. Luisetto, S. Tuti, C. Meneghini, C. Battocchio and G. Lucci, Ni supported on YSZ: XAS and XPS characterization and catalytic activity for CO2 methanation, J. Mater. Sci., 2017, 52(17), 1–10 CrossRef.
- V. A. Bharathan, R. Jain, C. S. Gopinath and C. P. Vinod, Diverse reactivity trends of Ni surfaces in Au@Ni core-shell nanoparticles probed by near ambient pressure (NAP) XPS, Catal. Sci. Technol., 2017, 7(19), 4489–4498 RSC.
- S. V. Oleg, V. F. Olga and V. R. Ira, Crystal structure and stability of Ni-rich synthetic tourmaline. Distribution of divalent transition-metal cations over octahedral positions, Mineral. Mag., 2015, 79(4), 997–1006 CrossRef.
- N. N. Li, M. Z. Wang, Z. Gong, P. Li, Y. S. Li and G. Chen, Ni2Al3 intermetallic coating: microstructure and mechanical properties, Adv Mater Process Technol, 2017, 2(4), 255–261 Search PubMed.
| This journal is © The Royal Society of Chemistry 2020 |

