 Open Access Article
Binuclear and tetranuclear Zn(II) complexes with thiosemicarbazones: synthesis, X-ray crystal structures, ATP-sensing, DNA-binding, phosphatase activity and theoretical calculations†
Piyali Adaka,
Bipinbihari Ghosha,
Antonio Bauzá b,
Antonio Frontera
 *b,
Steven R. Herronc and
Shyamal Kumar Chattopadhyay
 *a
*a
aDepartment of Chemistry, Indian Institute of Engineering Science and Technology, Shibpur, Howarh-711 103, India. E-mail: shch20@hotmail.com
bDepartment of Chemistry, University of the Balearic Islands, Carretera de Valldemossa km 7.5, 07122 Palma de Mallorca, IllesBalears, Spain
cDepartment of Chemistry, Utah Valley University, 800W University Pkwy, Orem UT 84058, USA
First published on 30th March 2020
Abstract
Two Zinc(II) complexes [Zn4(L1)4]·2H2O (1) and [Zn2(L2)2]·2H2O (2) of pyruvaldehydethiosemicarbazone ligands are reported. The complexes were characterized by elemental analysis, IR, NMR, UV-vis spectroscopy and by single-crystal X-ray crystallography. X-ray crystal structure determinations of the complexes show that though Zn![[thin space (1/6-em)]](https://www.rsc.org/images/entities/char_2009.gif) :
:![[thin space (1/6-em)]](https://www.rsc.org/images/entities/char_2009.gif) ligand stoichiometry is 1
ligand stoichiometry is 1![[thin space (1/6-em)]](https://www.rsc.org/images/entities/char_2009.gif) :
:![[thin space (1/6-em)]](https://www.rsc.org/images/entities/char_2009.gif) 1 in both the complexes, the molecular unit is tetranuclear for 1 and binuclear for 2. Both the complexes show selective sensing of ATP at pH 7.4 (0.01 M HEPES) in CH3CN–H2O (9
1 in both the complexes, the molecular unit is tetranuclear for 1 and binuclear for 2. Both the complexes show selective sensing of ATP at pH 7.4 (0.01 M HEPES) in CH3CN–H2O (9![[thin space (1/6-em)]](https://www.rsc.org/images/entities/char_2009.gif) :
:![[thin space (1/6-em)]](https://www.rsc.org/images/entities/char_2009.gif) 1) medium in the presence of other anions like AcO−, NO3−, F−, Cl−, H2PO4−, HPO42− and P2O72−. The UV-titration experiments of complexes 1 and 2 with ATP results in binding constants of 2.0(±0.07) × 104 M−1 and 7.1(±0.05) × 103 M−1 respectively. The calculated detection limits of 6.7 μM and 1.7 μM for 1 and 2 respectively suggest that the complexes are sensitive detectors of ATP. High selectivity of the complexes is confirmed by the addition of ATP in presence of an excess of other anions. DFT studies confirm that the ATP complexes are more favorable than those with the other inorganic phosphate anions, in agreement with the experimental results. Phosphatase like activity of both complexes is investigated spectrophotometrically using 4-nitrophenylphosphate (NPP) as a substrate, indicating the complexes possess significant phosphate ester hydrolytic efficiency. The kinetics for the hydrolysis of the substrate NPP was studied by the initial rate method at 25 °C. Michaelis–Menten derived kinetic parameters indicate that rate of hydrolysis of the P–O bond by complex 1 is much greater than that of complex 2, the kcat values being 212(±5) and 38(±2) h−1 respectively. The DNA binding studies of the complexes were investigated using electronic absorption spectroscopy and fluorescence quenching. The absorption spectral titrations of the complexes with DNA indicate that the CT-DNA binding affinity (Kb) of complex 1 (2.10(±0.07) × 106 M−1) is slightly greater than that of 2 (1.11(±0.04) × 106 M−1). From fluorescence spectra the apparent binding constant (Kapp) values were calculated and they are found to be 5.41(±0.01) × 105 M−1 for 1 and 3.93(±0.02) × 105 M−1 for 2. The molecular dynamics simulation demonstrates that the Zn(II) complex 1 is a good intercalator of DNA.
1) medium in the presence of other anions like AcO−, NO3−, F−, Cl−, H2PO4−, HPO42− and P2O72−. The UV-titration experiments of complexes 1 and 2 with ATP results in binding constants of 2.0(±0.07) × 104 M−1 and 7.1(±0.05) × 103 M−1 respectively. The calculated detection limits of 6.7 μM and 1.7 μM for 1 and 2 respectively suggest that the complexes are sensitive detectors of ATP. High selectivity of the complexes is confirmed by the addition of ATP in presence of an excess of other anions. DFT studies confirm that the ATP complexes are more favorable than those with the other inorganic phosphate anions, in agreement with the experimental results. Phosphatase like activity of both complexes is investigated spectrophotometrically using 4-nitrophenylphosphate (NPP) as a substrate, indicating the complexes possess significant phosphate ester hydrolytic efficiency. The kinetics for the hydrolysis of the substrate NPP was studied by the initial rate method at 25 °C. Michaelis–Menten derived kinetic parameters indicate that rate of hydrolysis of the P–O bond by complex 1 is much greater than that of complex 2, the kcat values being 212(±5) and 38(±2) h−1 respectively. The DNA binding studies of the complexes were investigated using electronic absorption spectroscopy and fluorescence quenching. The absorption spectral titrations of the complexes with DNA indicate that the CT-DNA binding affinity (Kb) of complex 1 (2.10(±0.07) × 106 M−1) is slightly greater than that of 2 (1.11(±0.04) × 106 M−1). From fluorescence spectra the apparent binding constant (Kapp) values were calculated and they are found to be 5.41(±0.01) × 105 M−1 for 1 and 3.93(±0.02) × 105 M−1 for 2. The molecular dynamics simulation demonstrates that the Zn(II) complex 1 is a good intercalator of DNA.
1. Introduction
The coordination chemistry of nitrogen–sulphur donor ligands towards transition metal ions1,2 has attracted much attention and the interest arises in part from the fact that S-ligated transition metal complexes mimic the coordination environment of many biological systems. As a class of nitrogen–sulfur donor ligands, the synthesis of compounds incorporating thiosemicarbazones has attracted widespread attention of chemists as well as biologists, because of the interesting chemical, biological, structural and electronic properties of their metal complexes.3–9 Again, Zn(II) ions play important roles in medicinal, chemical and biological events, and it is the second most abundant transition metal next to the iron ion in the body (human beings contain an average of 2–3 g of zinc), being vital in many cellular processes,10 including gene expression,11 apoptosis,12 enzyme regulation13 and neurotransmission.14 It has been suggested that the anti-Alzheimer medicine clioquinol, a 8-hydroxyquinoline derivative, functions by way of chelating Zn(II) along with Cu(II), the two metal ions which are critically associated with protein aggregation and degeneration processes in the brain.15 Zinc complexes with N,S-donor sets are potential mimics of various zinc-containing metalloproteins.16 The biological activity and the DNA-binding ability of zinc complexes have been the subject of a large number of studies.17–19The design and synthesis of chemosensors for selective recognition and sensing of a particular anion is an area of immense importance.20,21 Sensors that can detect and sense biologically important anions in aqueous environments and under physiological pH are of special significance owing to their potential applications in biological field.22 Among various anions, recognition of phosphates, pyrophosphate, nucleotides, and nucleosides is important in this regard.23,24 Among many phosphate anions, adenosine triphosphate (ATP) is most important as a molecular currency of intracellular energy transfer.25
Studies on the interaction of small molecules with DNA continue to attract considerable attention due to their importance in cancer therapy and molecular biology.26–31 Over the last few decades, transition metal complexes that are capable of binding DNA under physiological conditions are of interest in the development of metal-based anticancer agents.32–36 These complexes are used in DNA-footprinting studies, as sequence specific DNA binding agents, diagnostic agents in medicinal applications and for genomic research.37–42
On the other hand, over the years, much effort has been devoted to the development of metal complexes as models for metallo-enzymes catalyzing phosphate ester hydrolysis.43 A number of zinc enzymes with multinuclear sites are known to be responsible for the hydrolysis of the phosphate esters.44–53
Herein we report the synthesis, characterization, and DNA binding property of two neutral tetranuclear and binuclear zinc(II) complexes which can be used to bind ATP in aqueous medium at physiological pH. These two zinc complexes effectively hydrolyses p-nitrophenylphosphate to p-nitrophenolate. The propensity of these complexes to bind to CT (calf-thymus) DNA has been investigated with UV-vis spectroscopic titration and their intrinsic binding constants, Kb, with CT-DNA have been determined. Competitive binding studies with ethidium bromide (EB), one of the most widely used intercalative agents and fluorescence probes for DNA structure, have been used in the study of the interaction of the complexes with CT-DNA in order to investigate a potential intercalative binding mode.
2. Experimental
2.1. Materials and methods
Pyruvic aldehyde, Zn(CH3COO)2·2H2O were purchased from Aldrich. All other chemicals and solvents were of reagent grade and used as such. Solvents for spectroscopic and cyclic voltammetry were of HPLC grade obtained from Merck or Aldrich. Elemental analyses were performed on a PerkinElmer 2400 C, H, N analyzer. Infrared spectra were recorded as KBr pellets on a JASCO FT-IR-460 spectrophotometer. UV-vis spectra were recorded using a JASCO V-530 UV-vis spectrophotometer. 1H NMR spectra were recorded on a Bruker AVANCE DPX 300 MHz spectrometer using, Si(CH3)4 as internal standard. ESI-MS spectra of the samples were recorded on JEOL JMS 600 instrument.2.2 Synthesis of ligand (HL)
The 4-(aryl)thiosemicarbazides were prepared from the corresponding aryl amines by the published procedure.54 The thiosemicarbazones were prepared by refluxing (2 h) a methanolic solution of thiosemicarbazide with pyruvic aldehyde in 2![[thin space (1/6-em)]](https://www.rsc.org/images/entities/char_2009.gif) :
:![[thin space (1/6-em)]](https://www.rsc.org/images/entities/char_2009.gif) 1 molar proportion.
1 molar proportion.
Yield: ∼80–90%.
![[double bond, length as m-dash]](https://www.rsc.org/images/entities/char_e001.gif) N), 755 (νC
N), 755 (νC![[double bond, length as m-dash]](https://www.rsc.org/images/entities/char_e001.gif) S) (Fig. S13 in ESI†).
S) (Fig. S13 in ESI†).![[double bond, length as m-dash]](https://www.rsc.org/images/entities/char_e001.gif) N), 730 (νC
N), 730 (νC![[double bond, length as m-dash]](https://www.rsc.org/images/entities/char_e001.gif) S) (Fig. S14 in ESI†).
S) (Fig. S14 in ESI†).2.3 Synthesis of the complexes
![[thin space (1/6-em)]](https://www.rsc.org/images/entities/char_2009.gif) 690), 460(39
690), 460(39![[thin space (1/6-em)]](https://www.rsc.org/images/entities/char_2009.gif) 847). Selected IR bands (cm−1): 3290(νNH), 1600(νC
847). Selected IR bands (cm−1): 3290(νNH), 1600(νC![[double bond, length as m-dash]](https://www.rsc.org/images/entities/char_e001.gif) N), 1545(νC
N), 1545(νC![[double bond, length as m-dash]](https://www.rsc.org/images/entities/char_e001.gif) N) (Fig. S13 in ESI†).
N) (Fig. S13 in ESI†).![[thin space (1/6-em)]](https://www.rsc.org/images/entities/char_2009.gif) 964). Selected IR bands (cm−1): 3151(νNH), 2952(νNH), 1589(νC
964). Selected IR bands (cm−1): 3151(νNH), 2952(νNH), 1589(νC![[double bond, length as m-dash]](https://www.rsc.org/images/entities/char_e001.gif) N) (Fig. S14 in ESI†). Single crystals suitable for X-ray structural analysis were obtained from the slow evaporation of the filtrate.
N) (Fig. S14 in ESI†). Single crystals suitable for X-ray structural analysis were obtained from the slow evaporation of the filtrate.2.4 UV-vis titrations for anion sensing
Stock solutions of the Zn(II) complexes were prepared (1 × 10⁻⁵ M) in CH3CN![[thin space (1/6-em)]](https://www.rsc.org/images/entities/char_2009.gif) :
:![[thin space (1/6-em)]](https://www.rsc.org/images/entities/char_2009.gif) H2O (9
H2O (9![[thin space (1/6-em)]](https://www.rsc.org/images/entities/char_2009.gif) :
:![[thin space (1/6-em)]](https://www.rsc.org/images/entities/char_2009.gif) 1, v/v) at pH 7.4 by using 20 mM HEPES buffer. The solution of the guest anion was prepared (2 × 10⁻⁴ M) in CH3CN
1, v/v) at pH 7.4 by using 20 mM HEPES buffer. The solution of the guest anion was prepared (2 × 10⁻⁴ M) in CH3CN![[thin space (1/6-em)]](https://www.rsc.org/images/entities/char_2009.gif) :
:![[thin space (1/6-em)]](https://www.rsc.org/images/entities/char_2009.gif) H2O (1
H2O (1![[thin space (1/6-em)]](https://www.rsc.org/images/entities/char_2009.gif) :
:![[thin space (1/6-em)]](https://www.rsc.org/images/entities/char_2009.gif) 1, v/v) at pH 7.4 by using 20 mM HEPES buffer. The spectroscopic titrations were carried out by incremental addition of 0.02 ml (2 × 10⁻⁴ M) of anion solutions to the solution of the complexes 1 and 2 (1 × 10⁻⁵ M).
1, v/v) at pH 7.4 by using 20 mM HEPES buffer. The spectroscopic titrations were carried out by incremental addition of 0.02 ml (2 × 10⁻⁴ M) of anion solutions to the solution of the complexes 1 and 2 (1 × 10⁻⁵ M).
2.5 DNA-binding experiments
![[thin space (1/6-em)]](https://www.rsc.org/images/entities/char_2009.gif) :
:![[thin space (1/6-em)]](https://www.rsc.org/images/entities/char_2009.gif) 1, indicating that the DNA was sufficiently free from protein.55 The DNA concentration per nucleotide and polynucleotide concentration were determined by absorption spectroscopy using the molar extinction coefficient (6600 M−1 cm−1) at 260 nm.56 The intrinsic binding constant Kb for the interaction of these metal (II) complexes with DNA has been calculated from the absorption spectral titration data. The intrinsic binding constant Kb was determined from,57
1, indicating that the DNA was sufficiently free from protein.55 The DNA concentration per nucleotide and polynucleotide concentration were determined by absorption spectroscopy using the molar extinction coefficient (6600 M−1 cm−1) at 260 nm.56 The intrinsic binding constant Kb for the interaction of these metal (II) complexes with DNA has been calculated from the absorption spectral titration data. The intrinsic binding constant Kb was determined from,57The ‘apparent’ extinction coefficient (εa) was obtained by calculating Aobs/[Zn]. The symbols εf and εb correspond to the extinction coefficients of free (unbound) and the fully bound complexes. A plot of [DNA]/(εa − εf) versus [DNA] will give a slope 1/(εb − εf) and an intercept of 1/Kb (εb − εf). Therefore Kb can be calculated from the ratio of the slope and intercept.58
2.6 Catalytic hydrolysis of 4-nitrophenyl phosphate
In order to study the phosphatase activity of the complexes, 10−4 M solutions of 1 and 2 in DMF were treated with 100 equiv. of 4-nitrophenyl phosphate in DMF–water(1![[thin space (1/6-em)]](https://www.rsc.org/images/entities/char_2009.gif) :
:![[thin space (1/6-em)]](https://www.rsc.org/images/entities/char_2009.gif) 1) mixture under aerobic conditions at room temperature. The absorbance versus wavelength (wavelength scan) of these solutions was recorded at regular time intervals of 2 min in the wavelength range of 300–600 nm. To determine the dependence of the rate on the substrate concentration and various kinetic parameters, a 10−5 M solution of complex was treated with 10, 20, 30, 40, 50 and 100 equiv. of substrate. The reactions were followed spectrophotometrically by monitoring the increase in the absorbance at 427 nm (4-nitrophenolate band maximum) as a function of time (time scan).
1) mixture under aerobic conditions at room temperature. The absorbance versus wavelength (wavelength scan) of these solutions was recorded at regular time intervals of 2 min in the wavelength range of 300–600 nm. To determine the dependence of the rate on the substrate concentration and various kinetic parameters, a 10−5 M solution of complex was treated with 10, 20, 30, 40, 50 and 100 equiv. of substrate. The reactions were followed spectrophotometrically by monitoring the increase in the absorbance at 427 nm (4-nitrophenolate band maximum) as a function of time (time scan).
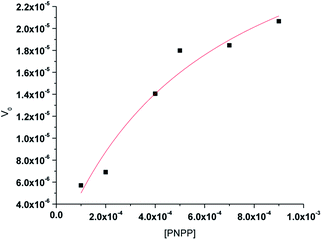
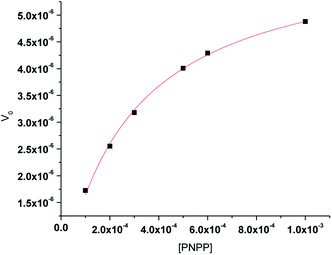
The kinetics for the hydrolysis of the substrate NPP was determined by the initial rate method at 25 °C. The concentration of the substrate NPP was always kept at least 10 times larger than that of the complex and the increase of the 4-nitrophenol concentration was determined at 429 and 427 nm, respectively for the two complexes. For this purpose, 10−5 M solution of a complex was treated with the substrate solution having concentration ranging between 10-fold and 100-fold than that of the complex. Each kinetic experiment at a given substrate concentration was repeated thrice and average of the three values are taken. The dependence of the initial rate on the concentration of the substrates was monitored spectrophotometrically at the respective wavelengths. The initial rate method follows a first-order dependence on complex concentration since it showed saturation kinetics at higher substrate concentrations. For this reason, a treatment based on the Michaelis–Menten model was applied. The values of the Michaelis binding constant (KM), maximum velocity (Vmax) and rate constant for the dissociation of the substrate (i.e., turnover number, kcat) were calculated for each complex by non-linear curve fitting using Michaelis–Menten equation:
2.7 X-ray crystallography
Data for both the complexes were collected on a Burker APEX diffractometer at 293(2) K, using a graphite-monochromated Mo–Kα radiation. The data were solved by direct method and refined by full matrix least squares on F2 using SHELX 97.64 The non-hydrogen atoms were refined with anisotropic displacement parameters. All hydrogen atoms were placed at calculated positions and refined as riding atoms using isotropic displacement parameters. Corrections for Lorentz polarization effects and semiempirical absorptions were applied. A summary of the crystallographic data and the refinement details are summarized in Table 1. Important bond distances and bond angles are collected in Table 2.| Formula | C68H64N24O2S8Zn4 | C44H54N14O2S4Zn2 |
| Formula weight | 1767.48 | 1069.99 |
| Crystal size(mm3) | 0.22 × 0.20 × 0.10 | 0.26 × 0.20 × 0.12 |
| Temperature | 293(2) K | 273(2) K |
| Crystal system | Triclinic | Monoclinic |
| Space group | P![[1 with combining macron]](https://www.rsc.org/images/entities/char_0031_0304.gif) |
P21/c |
| a (Å) | 10.454(3) | 21.767(4) |
| b (Å) | 10.621(4) | 17.713(3) |
| c (Å) | 19.648(6) | 13.738(2) |
| α (°) | 75.017(8) | 90 |
| β (°) | 82.443(8) | 103.454(4) |
| γ (°) | 67.822(8) | 90 |
| dcal | 1.503 | 1.380 |
| Z | 1 | 4 |
| μ(mm−1) | 1.490 | 1.144 |
| F(000) | 902 | 2224 |
| Total reflections | 12![[thin space (1/6-em)]](https://www.rsc.org/images/entities/char_2009.gif) 001 001 |
81![[thin space (1/6-em)]](https://www.rsc.org/images/entities/char_2009.gif) 426 426 |
| Unique reflections | 3952 | 8614 |
| Observed data [I >2σ(I)] | 2508 | 5368 |
| R(int) | 0.0737 | 0.0958 |
| R1, wR2 [I >2σ(I)] | 0.0610, 0.1617 | 0.0752, 0.1343 |
| R1, wR2 (all data) | 0.1023, 0.1932 | 0.1391, 0.1675 |
| Data/restraints/parameters | 3952/0/480 | 8614/4/635 |
| Goodness-of-fit (GOF) on F2 | 1.011 | 1.137 |
| 1 | |||
|---|---|---|---|
| Bond distances (Å) | |||
| Zn1–N3 | 2.115(8) | Zn2–N9 | 2.090(8) |
| Zn1–N4 | 2.124(8) | Zn2–N10 | 2.104(8) |
| Zn1–S2 | 2.330(3) | Zn2–S3 | 2.374(3) |
| Zn1–S1 | 2.347(3) | Zn2–S4 | 2.381(3) |
| Zn1–S3 | 2.545(3) | Zn2–S4 | 2.599(3) |
![[thin space (1/6-em)]](https://www.rsc.org/images/entities/char_2009.gif) |
|||
| Bond angles (°) | |||
| N3–Zn1–N4 | 73.8(4) | N9–Zn2–N10 | 74.6(3) |
| N3–Zn1–S2 | 146.4(2) | N9–Zn2–S3 | 80.8(3) |
| N4–Zn1–S2 | 80.5(3) | N10–Zn2–S3 | 148.8(2) |
| N3–Zn1–S1 | 80.3(3) | N9–Zn2–S4 | 154.4(3) |
| N4–Zn1–S1 | 152.4(3) | N10–Zn2–S4 | 80.6(2) |
| S2–Zn1–S1 | 118.73(10) | S3–Zn2–S4 | 119.97(10) |
| N3–Zn1–S3 | 103.5(2) | N9–Zn2–S4 | 93.8(2) |
| N4–Zn1–S3 | 94.3(2) | N10–Zn2–S4 | 99.5(2) |
| S2–Zn1–S3 | 99.58(10) | S3–Zn2–S4 | 101.02(9) |
| S1–Zn1–S3 | 100.97(10) | S4–Zn2–S4 | 96.18(8) |
| 2 | |||
|---|---|---|---|
| Bond distances (Å) | |||
| Zn1–N10 | 2.093(6) | Zn2–N3 | 2.094(5) |
| Zn1–N9 | 2.120(6) | Zn2–N4 | 2.113(5) |
| Zn1–S4 | 2.322(2) | Zn2–S1 | 2.4468(19) |
| Zn1–S3 | 2.447(2) | Zn2–S2 | 2.316(2) |
| Zn1–S1 | 2.454(2) | Zn2–S3 | 2.454(2) |
![[thin space (1/6-em)]](https://www.rsc.org/images/entities/char_2009.gif) |
|||
| Bond angles (°) | |||
| N10–Zn1–N9 | 74.4(2) | N3–Zn2–N4 | 74.9(2) |
| N10–Zn1–S4 | 81.65(18) | N3–Zn2–S2 | 80.67(16) |
| N9–Zn1–S4 | 148.91(17) | N4– Zn2– S2 | 147.36(17) |
| N10–Zn1–S3 | 147.50(18) | N3–Zn2–S1 | 147.40(16) |
| N9–Zn1–S3 | 78.24(17) | N4–Zn2–S1 | 78.40(16) |
| S4–Zn1–S3 | 115.98(7) | S2–Zn2–S1 | 114.84(7) |
| N10–Zn1–S1 | 105.95(17) | N3–Zn2–S3 | 107.01(17) |
| N9–Zn1–S1 | 100.75(18) | N4–Zn2–S3 | 100.86(16) |
| S4–Zn1–S1 | 104.71(8) | S2–Zn2–S3 | 106.80(8) |
| S3–Zn1–S1 | 95.99(6) | S1–Zn2–S3 | 96.00(6) |
2.8 Theoretical methods
2.8.2 Molecular dynamics calculation
A sequence of twelve base pairs of the oligonucleotide, d[GCGCGGAAGCGC]2 like a model of calf thymus DNA was chosen and constructed in the double-helix B-DNA conformation by Discover Studio 4.0 of Accelrys inc. To create the intercalation pocket in the starting DNA structure, the torsion angles α–ξ of the sugar backbone were modified. The complex was intercalated in the major groove between 6th and 7th base pairs. We have used amber tools 12.0 (ref. 69) to create all input files to run the molecular dynamics simulations in Gromacs70,71 software package. Molecular dynamics were performed using the amber14ipq Field to describe all parameters of the dodecamer. Partial charges for the Zn-complex were obtained using the restrained electrostatic fit (RESP) scheme. Electrostatic potentials were computed using the ab initio HF/6-31G(d) calculations using the Gaussian03 package.72 All parameters of these molecules were taken from the general amber force field (GAFF) when we use the antechamber73 software. Finally, all systems were neutralized with the addition of Na+ ions and then were completed with a tetrahedral box of TIP3P waters to a depth of 1.0 nanometre on each side of the solutes.74Preliminary energies minimizations were run with the steepest descent algorithm, during which the system (oligonucleotide and the 1 complex) was restrained with a force constant of 1000 kJ mol−1 nm−2, gradually relaxed to 100 kJ mol−1 nm−2. Afterwards, a 100 ps equilibration step (NVT) was carried out using the modified Berendsen75 thermostat to increase the temperature of the system at 300 K. A second 100 ps equilibration step was performed using the Parrinello–Rahman76 pressure coupling model to equilibrate the pressure of the system at 1 atm. After the NVT and NPT steps, we run 500 ns molecular dynamic, enough to obtain well equilibrated MD trajectories of each system.
3. Results and discussion
3.1 Synthesis of complexes
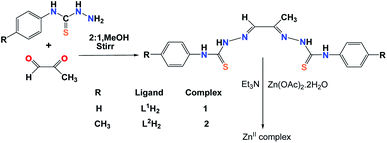
The Schiff base ligands used in this study were prepared following same method by stirring appropriate thiosemicarbazide derivatives with pyruvic aldehyde in 2![[thin space (1/6-em)]](https://www.rsc.org/images/entities/char_2009.gif) :
:![[thin space (1/6-em)]](https://www.rsc.org/images/entities/char_2009.gif) 1 molar ratio. The Zn(II) complexes were obtained in moderately good yield by reaction of the thiosemicarbazone Schiff bases with Zn(OAc)2·2H2O in presence of triethyl amine in 1
1 molar ratio. The Zn(II) complexes were obtained in moderately good yield by reaction of the thiosemicarbazone Schiff bases with Zn(OAc)2·2H2O in presence of triethyl amine in 1![[thin space (1/6-em)]](https://www.rsc.org/images/entities/char_2009.gif) :
:![[thin space (1/6-em)]](https://www.rsc.org/images/entities/char_2009.gif) 1
1![[thin space (1/6-em)]](https://www.rsc.org/images/entities/char_2009.gif) :
:![[thin space (1/6-em)]](https://www.rsc.org/images/entities/char_2009.gif) 2 molar proportion in methanol at room temperature (Scheme 1). The ligands were characterized by elemental analysis, mass, IR and 1H-NMR spectroscopy. For the ligand L1H2 tetranuclear Zn(II) complex was obtained, whereas for the ligand L2H2 binuclear Zn(II) complex was obtained. The solution stability of the complexes were ensured by measuring ESI-MS, NMR and UV-vis spectra of the complexes 8–10 hours after dissolution when the spectral data remain unchanged.
2 molar proportion in methanol at room temperature (Scheme 1). The ligands were characterized by elemental analysis, mass, IR and 1H-NMR spectroscopy. For the ligand L1H2 tetranuclear Zn(II) complex was obtained, whereas for the ligand L2H2 binuclear Zn(II) complex was obtained. The solution stability of the complexes were ensured by measuring ESI-MS, NMR and UV-vis spectra of the complexes 8–10 hours after dissolution when the spectral data remain unchanged.
3.2 Description of X-ray crystal structure
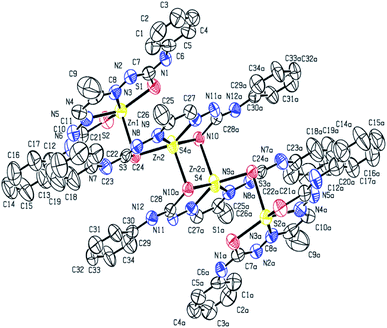
X-ray crystal structure determination of complex 1 (Fig. 1 and 2) shows that though Zn![[thin space (1/6-em)]](https://www.rsc.org/images/entities/char_2009.gif) :
:![[thin space (1/6-em)]](https://www.rsc.org/images/entities/char_2009.gif) ligand stoichiometry is 1
ligand stoichiometry is 1![[thin space (1/6-em)]](https://www.rsc.org/images/entities/char_2009.gif) :
:![[thin space (1/6-em)]](https://www.rsc.org/images/entities/char_2009.gif) 1, the molecular unit is tetranuclear. The two central Zn(II) ions are bridged by two thiolato sulfur atoms in axial–equatorial mode, while each of the two terminal Zn(II) ions are connected to a central Zn(II) by a single thiolato bridge. Each of the four Zn(II) ions is in a square pyramidal N2S3-coordination environment, the equatorial position being occupied by one dideprotonated tetradentate ligand, and the axial position is occupied by a sulfur atom of a ligand attached to a neighbouring Zn(II) atom. Both the thiolato sulfur atoms belonging to the ligand attached to each of the central Zn(II) atoms participate in bridging while the sulfur atoms coordinated to the terminal Zn(II) atoms do not participate in bridging. The tetranuclear complex [Zn4(L1)4]·2H2O (1) results from the pairing of two dinuclear units related by crystallographic centre of inversion, by two thiolato bridges. The distance between two central Zn(II) atom is 3.330(2) Å while the distance between the terminal and its adjacent Zn(II) atoms is 3·716(2) Å. The C–S bond distance lying between 1.734(10)–1.776(10) Å indicates the bis-thiosemicarbazone ligand binds through thiolate-like than thione-like. Sum of the different angles between the terminal metal centre and the donor atoms in its equatorial plane is 353.33(10)°, while that for the central metal center is 355.973(10)°, indicating the planarity of the tetradentate ligand. The coordination polyhedrons around Zn(II) centers may be described as axially elongated square pyramid with τ parameter being 0.09–0.10. The apical site of the coordination polyhedron is occupied by a bridging thiolato S-atom with Zn–S distance 2.545(3)–2.599(3) Å which is considerable longer than the Zn–S bond length (2.330(3)–2.381(3) Å)found in the basal plane.
1, the molecular unit is tetranuclear. The two central Zn(II) ions are bridged by two thiolato sulfur atoms in axial–equatorial mode, while each of the two terminal Zn(II) ions are connected to a central Zn(II) by a single thiolato bridge. Each of the four Zn(II) ions is in a square pyramidal N2S3-coordination environment, the equatorial position being occupied by one dideprotonated tetradentate ligand, and the axial position is occupied by a sulfur atom of a ligand attached to a neighbouring Zn(II) atom. Both the thiolato sulfur atoms belonging to the ligand attached to each of the central Zn(II) atoms participate in bridging while the sulfur atoms coordinated to the terminal Zn(II) atoms do not participate in bridging. The tetranuclear complex [Zn4(L1)4]·2H2O (1) results from the pairing of two dinuclear units related by crystallographic centre of inversion, by two thiolato bridges. The distance between two central Zn(II) atom is 3.330(2) Å while the distance between the terminal and its adjacent Zn(II) atoms is 3·716(2) Å. The C–S bond distance lying between 1.734(10)–1.776(10) Å indicates the bis-thiosemicarbazone ligand binds through thiolate-like than thione-like. Sum of the different angles between the terminal metal centre and the donor atoms in its equatorial plane is 353.33(10)°, while that for the central metal center is 355.973(10)°, indicating the planarity of the tetradentate ligand. The coordination polyhedrons around Zn(II) centers may be described as axially elongated square pyramid with τ parameter being 0.09–0.10. The apical site of the coordination polyhedron is occupied by a bridging thiolato S-atom with Zn–S distance 2.545(3)–2.599(3) Å which is considerable longer than the Zn–S bond length (2.330(3)–2.381(3) Å)found in the basal plane.
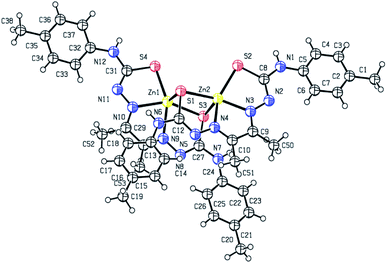
The structure of the binuclear complex is similar to the two doubly bridged central Zn(II) atoms of the tetranuclear complex with the terminal zinc centers being stripped off (Fig. 2). The Zn⋯Zn distance is 3.250(1) Å compared to 3.330(2) Å for the central Zn(II) atoms in the tetranuclear complex. The C–S bind distances lie in the range 1.739(8)–1.779(8) Å, with the bridging thiolate having slightly longer bond length. The Zn–N distances are almost identical in both the complexes, while the Zn–S distances are on an average slightly shorter in the binuclear complex.
3.3 Electronic spectra
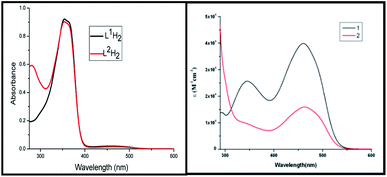
The electronic spectra of the ligands and the complexes are depicted in Fig. 3. The free ligands show two bands, a strong sharp band at 350 nm and a very weak broad band at 460 nm. These bands are probably π → π* (higher energy band) or n → π* (lower energy band) in origin. In the complexes there is a strong transition at 460 nm. Extensive delocalization on deprotonation followed by complexation lowers the energy of the LUMO which is a π*-orbital. The 460 nm band can have its origin in a new π → π* transition or a LLCT transition from thiolate pπ to imine π* orbital. The 350 nm band remains almost unaltered in complex 1 but in complex 2 it now appears as a shoulder.3.4 ATP binding study
![[thin space (1/6-em)]](https://www.rsc.org/images/entities/char_2009.gif) :
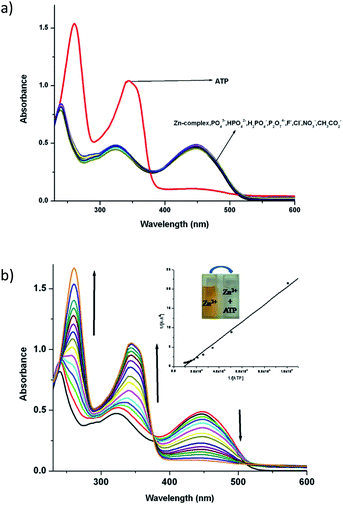
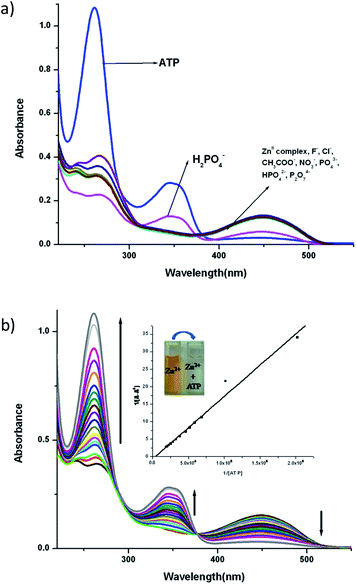
:![[thin space (1/6-em)]](https://www.rsc.org/images/entities/char_2009.gif) 1) at a concentration of 10−5 M by adding salts of different anions. Fig. 4 and 5 display the notable changes in the UV-vis spectrum of 1 and 2 (10−5 M) on the addition of AcO−, NO3−, F−, Cl−, H2PO4−, HPO42−, P2O72− and ATP ions. Spectral changes were observed only when ATP is added to the solution. Moreover, the colour of the solutions 1 and 2 changed from yellow to colourless. However, no detectable spectral responses and colour changes were observed even after adding large amount of AcO−, NO3−, F−, Cl−, H2PO4−, HPO42− and P2O72− ions. These results suggest that 1 and 2 can distinguish ATP from other anions.
1) at a concentration of 10−5 M by adding salts of different anions. Fig. 4 and 5 display the notable changes in the UV-vis spectrum of 1 and 2 (10−5 M) on the addition of AcO−, NO3−, F−, Cl−, H2PO4−, HPO42−, P2O72− and ATP ions. Spectral changes were observed only when ATP is added to the solution. Moreover, the colour of the solutions 1 and 2 changed from yellow to colourless. However, no detectable spectral responses and colour changes were observed even after adding large amount of AcO−, NO3−, F−, Cl−, H2PO4−, HPO42− and P2O72− ions. These results suggest that 1 and 2 can distinguish ATP from other anions.
To explore further about the applicability of 1 and 2 for ATP sensing, the UV-vis titrations were performed at pH 7.4 in CH3CN–H2O (9![[thin space (1/6-em)]](https://www.rsc.org/images/entities/char_2009.gif) :
:![[thin space (1/6-em)]](https://www.rsc.org/images/entities/char_2009.gif) 1). The presence of ATP resulted in the significant increase of intensity of the absorbance band at 343 nm while the absorbance band at 450 nm decreases and the peak at 239 nm shifted to 260 nm with an increase in intensity for 1 (Fig. 4b). Upon the addition of ATP to 2, the absorbance at 261 nm increases while the absorption at 450 nm gradually decreases. Moreover, a new absorption band appears at 349 nm, and its absorbance gradually increases with the addition of ATP (Fig. 5b). The competitive binding ability of ATP by the complexes in presence of three fold excess of other biologically important anions is shown in Fig. S16 in ESI.† It is clear from these two figures that both the complexes show high selectivity towards ATP.
1). The presence of ATP resulted in the significant increase of intensity of the absorbance band at 343 nm while the absorbance band at 450 nm decreases and the peak at 239 nm shifted to 260 nm with an increase in intensity for 1 (Fig. 4b). Upon the addition of ATP to 2, the absorbance at 261 nm increases while the absorption at 450 nm gradually decreases. Moreover, a new absorption band appears at 349 nm, and its absorbance gradually increases with the addition of ATP (Fig. 5b). The competitive binding ability of ATP by the complexes in presence of three fold excess of other biologically important anions is shown in Fig. S16 in ESI.† It is clear from these two figures that both the complexes show high selectivity towards ATP.
The association constant (Ka) with ATP, as determined using a spectrophotometric titration method, for complexes 1 and 2 is found to be 2.0(±0.07) × 104 M−1 (R2 = 0.988) and 7.1(±0.05) × 103 M−1 (R2 = 0.979) respectively by using the Benesi–Hildebrand equation (Fig S17†). The calculated detection limits at 6.7 μM and 1.7 μM suggest that the complexes 1 and 2 are potentially very good sensors of ATP (Fig S18†).
3.5 DNA binding studies
ΔG = −RT![[thin space (1/6-em)]](https://www.rsc.org/images/entities/char_2009.gif) ln ln![[thin space (1/6-em)]](https://www.rsc.org/images/entities/char_2009.gif) K K
| (1) |
![[thin space (1/6-em)]](https://www.rsc.org/images/entities/char_2009.gif) :
:![[thin space (1/6-em)]](https://www.rsc.org/images/entities/char_2009.gif) 1} at pH 7.4, the DNA-induced emission intensity of EB decreased (Fig. 7). Addition of a second DNA binding molecule would quench the EB emission by either accepting an excited state electron from EB or replacing the DNA-bound EB (if it binds to DNA more strongly than EB).
1} at pH 7.4, the DNA-induced emission intensity of EB decreased (Fig. 7). Addition of a second DNA binding molecule would quench the EB emission by either accepting an excited state electron from EB or replacing the DNA-bound EB (if it binds to DNA more strongly than EB).
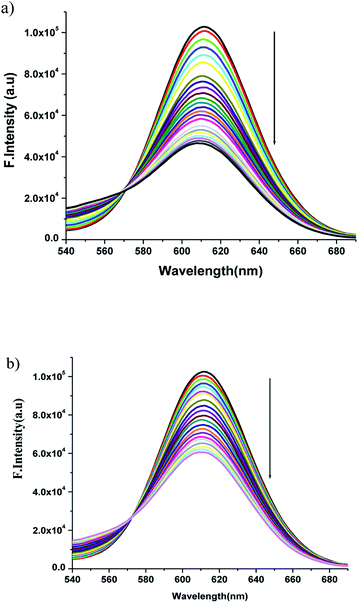 | ||
| Fig. 7 Emission spectra of EB bound DNA with increasing amounts of the (a) complex 1 and (b) complex 2. Arrow shows the intensity changes upon increasing the complex concentration. | ||
The emission spectra were monitored by keeping the excitation at 520 nm and the emission was monitored in the range of 540–690 nm. The emission was observed at 611 nm. The quenching constant KSV was determined from the classical Stern–Volmer equation:77
| Complex | Electronic spectra | Fluorescence spectra | ||||
|---|---|---|---|---|---|---|
| λmax (nm) | Change in absorption | Kb(M−1) | λmax (nm) | KSV | Kapp | |
| 1 | 460 | Hypochromism | 2.10(±0.07) × 106 | 611 | 1.09(±0.007) × 104 | 5.41(±0.01) × 105 |
| 2 | 463 | Hypochromism | 1.11(±0.04) × 106 | 611 | 5.87(±0.09) × 103 | 3.93(±0.02) × 105 |
3.6 Kinetics of the hydrolysis of the phosphate ester PNPP
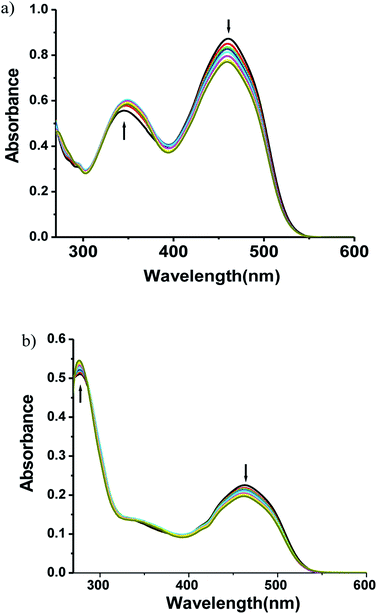
The phosphate ester hydrolysis ability of the complexes was evaluated using PNPP (4-nitrophenyl phosphate) as substrate. The reactions were carried out in DMF at 25 °C under aerobic conditions and were monitored by means of UV-vis spectroscopy. The time dependent spectral changes of the complexes 1 and 2 upon addition of NPP in DMF are shown in Fig. 8, which clearly demonstrate the gradual increment of the concentration of 4-nitro phenol (λmax = 400 nm) with time (Fig. 8). These results suggest that both the complexes are active in catalyzing the hydrolysis of PNPP.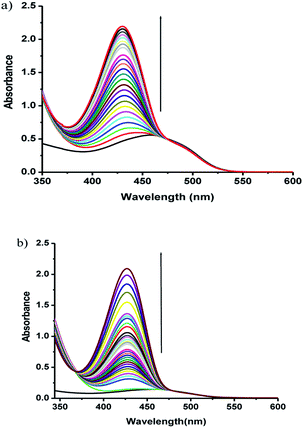 | ||
| Fig. 8 UV-vis spectral changes of complexes 1 (a), 2 (b) in DMF upon addition of 100 fold excess of NPP, observed at fixed intervals of time. | ||
The enzyme kinetics data are listed in Table 4 and the kinetic plots are given in Fig. 9 and 10. The kinetic study indicated that complex 1 exhibits more than five times greater catalytic activity than complex 2. Control experiments with PNPP only and PNPP mixed with zinc acetate solution shows negligible hydrolysis (Fig. S21†), confirming the efficacy of the complexes 1 and 2 as catalysts for the model phosphate ester hydrolysis reaction.
| Complex | Wavelength (nm) | Vmax (M min−1) | KM (M) | R2 | kcat (h−1) |
|---|---|---|---|---|---|
| 1 | 429 | 3.54(±0.67) × 10−5 | 6.08(±0.22) × 10−4 | 0.947 | 212 (±5) |
| 2 | 427 | 6.25(±0.11) × 10−6 | 2.81(±0.13) × 10−4 | 0.997 | 38(±2) |
3.7 Theoretical calculations
We have divided the theoretical study into two different parts to analyze interesting aspects of the title compounds. First, we have analyzed the binding mechanism of the complex 1 to DNA by means of molecular dynamics simulations. Second, the binding geometries and energies of the ATP and related anions to complex 1 have been computed using DFT calculations in solution to rationalize its selectivity.3.8 Molecular dynamics studies
Molecular dynamics (MD) simulations of the DNA oligonucleotide has been used to investigate the intercalative binding of the complex 1 to DNA. The MD simulations of complex 1 like a model were conducted up to 500 ns in order to investigate if the metal complex stays in the intercalation site (Fig. 11). The complex was intercalated initially in the major grove. The nitrogenous bases sequence pair chosen around the complex were: G–C and A–T. After the first 75 ns of the simulation time, the complex finds the ideal orientation with respect to the nitrogenous bases. As we can see in the Fig. 12 one part of the complex intercalated perfectly within DNA, where there are interactions with one phenyl and formaldehyde thiosemicarbazone groups with the nitrogenous bases of the pocket. On the other hand, the other phenyl is orientated outside the double helix. It is preserving this conformation for the remaining time of the simulation. In our case, the DNA oligonucleotide does not exhibit a significant mobility, especially the central nitrogen bases.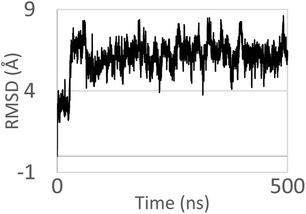 | ||
| Fig. 11 RMSD obtained for the calf thymus DNA model and complex 1 up to 500 ns of MD simulations. RMSD of 6.070 ± 1.050 Å. | ||
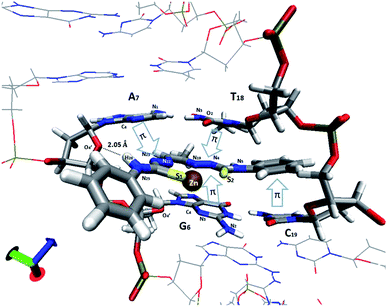 | ||
| Fig. 12 View of the intercalation scheme of [Zn(L1)] complex between G–C (6th and 7th residues, respectively) and A–T bases in the MD simulation. π–π stacking interactions are indicated with arrows. | ||
An analysis of the statistical structures within the MD was carried out, finding three different bonding types between the Zn(II) complex 1 and the nucleobases: π–π stacking, metal–nucleobase bonding and hydrogen bonding interactions. Using the radial distribution function (g(r)), we calculate the complex–nitrogen base average distances throughout the simulation time. Fig. 12 and 13 represent these set of bonding between the complex and the bases around it.
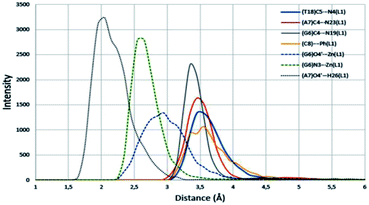 | ||
| Fig. 13 Radial distribution functions of principal interactions between ZnL1 complex and DNA. π–π stacking, metal bonding and hydrogen bonding are represented by solid, discontinues and points lines respectively. Average distances throughout the all simulation time. | ||
The four nucleobases in the pocket present π–π stacking with some fraction of the complex intercalated. These interactions do not have the same intensity level. The cytosine base presents π–π stacking with a phenyl group with an average distance of 3.5 Å (yellow line in Fig. 13). This distance is in good agreement with the interplanar distance of 3.4–3.6 Å of benzene dimer. The remaining nucleobases (G, A, T) present similar average distances with the different thiosemicarbazone groups in the complex (blue arrows in Fig. 12 and grey, red and blue solid lines in Fig. 13, respectively). The guanine intensity in the radial distribution function is slightly higher than the intensity of the other nucleobases. This fact establishes that π–π stacking interactions are the most general in the pocket of the calf thymus DNA. Jointly, the guanine base presents two maximum intensity picks on a 2.6 Å and 2.9 Å average distances (discontinues green and blue lines). This maximum in the function corresponds to the average distance of N3 group of guanine and O4′ of the sugar of the guanine. Interestingly, only this base shows bonding with the Zn in the complex. Finally, a strong and enduring hydrogen bond (2.0 Å average distance) in the MD simulation between the O4′ sugar of the adenine and H26 of the ligand complex is established.
The MD simulation demonstrates that the complex 1 is a good intercalator of DNA. The pocket design has been chosen in order to simulate the different bases within the DNA structure, finding an ideal orientation without needing a specific repetitive sequence in the oligonucleotide. Guanine base has a greater ability to interact with the complex through the Zn and π–π stacking and we assume that the presence of this nucleobase is necessary for the complex to interleave.
3.9 DFT study of the ATP binding to compound 1
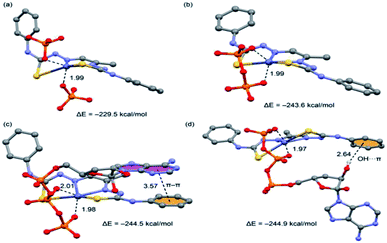
We have studied the energetic and geometric features of complexes of compound 1 with ATP and also other phosphate anions (HPO42− and P2O74−) for comparison purposes. The optimized complexes and binding energies are summarized in Fig. 14. It can be observed that the ATP complexes are more favorable than those with the other phosphorous inorganic anions, in agreement with the experimental results. The binding mode of the ATP is governed by two types of interactions, first, two strong Zn(II)⋯O interactions (coordination bonds) fix the geometry and explain the large binding energies obtained for the complexes. Moreover, the ATP presents additional interactions that explain its higher affinity to compound 1. In fact, we have found two possible orientations for the ribose–adenine fragment that are almost isoenergetic and present different ancillary interaction. First, the adenine forms a stacking interaction with one phenyl ring of the organic ligand (Fig. 14(c)) and, second, one hydroxyl group of the sugar establishes an OH⋯π interaction with the organic ligand (Fig. 14(d)).4. Conclusions
A tetranuclear and a binuclear complex of two tetradentate thiosemicarbazone ligands were synthesized, characterized and their sensing, DNA binding and catalytic properties were evaluated. The two zinc complexes can be used as ATP sensors at biological pH. The DNA binding experiment through UV-vis, fluorescence titrations suggest that the interaction between the complex and DNA is intercalative and the result suggest that complex 1 is more efficient than complex 2 to bind DNA at biological pH. The intercalation of compound 1 to DNA has been further demonstrated by means of molecular dynamics simulations. Both the complexes catalyze the hydrolysis of 4-nitrophenylphosphate to 4-nitrophenol.Conflicts of interest
The authors declare no competing financial interest.Acknowledgements
PA thanks University Grants Commission (New Delhi) and BG thanks IIEST, Shibpur for their research fellowships. SKC thanks DST (West Bengal) for partial funding of this study.References
- T. C. Harrop and P. K. Mascharak, Acc. Chem. Res., 2004, 37, 253–260 CrossRef CAS PubMed
.
- T. Bal-Demirci, Polyhedron, 2008, 27, 440–446 CrossRef CAS
.
- M. J. M. Campbell, Coord. Chem. Rev., 1975, 15, 279–319 CrossRef CAS
.
- S. Padhye and G. B. Kauffman, Coord. Chem. Rev., 1985, 63, 127–160 CrossRef CAS
.
- D. X. West, S. B. Padhye and P. B. Sonowane, Struct. Bonding, 1991, 76, 1–50 CrossRef CAS
.
- D. X. West, A. E. Liberta, S. B. Chikate, P. B. Sonowane, A. S. Kumbhar and R. G. Yerande, Coord. Chem. Rev., 1993, 123, 49–71 CrossRef CAS
.
- T. S. Lobana, R. Sharma, G. Bawa and S. Khanna, Coord. Chem. Rev., 2009, 253, 977–1055 CrossRef CAS
.
- S. K. Chattopadhyay, in Ruthenium: Properties, Production and Applications, ed. D. B. Watson, Nova Publishers, 2011, pp. 293–310 Search PubMed
.
- D. H. Petering, Bioinorg. Chem., 1972, 1, 255–271 CrossRef
.
- B. L. Vallee and K. H. Falchuk, Physiol. Rev., 1993, 73, 79–118 CrossRef CAS PubMed
.
- K. H. Falchuk, Biochem, 1998, 188, 41–48 CAS
.
- P. D. Zalewski, I. J. Forbes and W. H. Betts, Biochem. J., 1993, 296, 403–408 CrossRef CAS PubMed
.
- W. Maret, C. Jacob and B. L. Vallee, Proc. Natl. Acad. Sci. U.S.A., 1999, 96, 1936–1940 CrossRef CAS PubMed
.
- M. P. Cuajungco and G. J. Lees, Neurobiol. Dis., 1997, 4, 137169 CrossRef PubMed
.
- M. Di Vaira, C. Bazzicalupi, P. Orioli, L. Messori, B. Bruni and P. Zatta, Inorg. Chem., 2004, 43, 3795–3797 CrossRef CAS PubMed
.
- A. Patra, S. Sarkar, R. Chakraborty, M. G. B. Drew and P. Chattopadhyay, J. Coord. Chem., 2010, 63, 1913–1920 CrossRef CAS
.
- M. E. Anderson, A. G. M Barrett and B. M. Hoffman, J. Inorg. Biochem., 2000, 80, 257–260 CrossRef CAS PubMed
.
- D. H. Tjahjono, S. Mima, T. Akutsu and N. Yoshioka, J. Inorg. Biochem., 2001, 85, 219–228 CrossRef CAS PubMed
.
- T. Biver, F. Secco, M. R. Tine, M. Venturini, A. Bencini, A. Bianchi and C. Giorni, J. Inorg. Biochem., 2004, 98, 1531–1538 CrossRef CAS PubMed
.
-
(a) R. Martınez-Manez and F. Sancenon, Chem. Rev., 2003, 103, 4419–4476 CrossRef PubMed
; (b) C. Suksai and T. Tuntulani, Chem. Soc. Rev., 2003, 32, 192–202 RSC
; (c) P. D. Beer and P. A. Gale, Angew. Chem., Int. Ed., 2001, 40, 486–516 CrossRef CAS
; (d) A. P. de Silva, H. Q. N. Gunaratne, T. Gunnlaugson, A. J. M. Huxley, C. P. McCoy, J. T. Rademacher and T. E. Rice, Chem. Rev., 1997, 97, 1515–1566 CrossRef CAS PubMed
; (e) P. A. Gale, Acc. Chem. Res., 2006, 39, 465–475 CrossRef CAS PubMed
.
-
(a) D. A. Jose, D. K. Kumar, B. Ganguly and A. Das, Org. Lett., 2004, 6, 3445–3448 CrossRef CAS PubMed
; (b) D. A. Jose, D. K. Kumar, B. Ganguly and A. Das, Tetrahedron Lett., 2005, 46, 5343–5346 CrossRef CAS
.
-
(a) B. S. Khakh and R. A. North, Nature, 2006, 442, 527–532 CrossRef CAS PubMed
; (b) N. StojanovicMilan, US Pat. Appl. Publ., US 2006172320, 2006
; (c) Z. Kejík, K. Záruba, D. Michalík, J. Sebek, J. Dian, S. Pataridis, K. Volka and V. Král, Chem. Commun., 2006, 1533–1535 RSC
; (d) A. Jaime, R. Belin and D. Astruc, Angew. Chem., Int. Ed., 2006, 45, 132–136 CrossRef PubMed
; (e) D. H. Lee, S. Y. Kim and J.-I. Hong, Angew. Chem., Int. Ed., 2004, 43, 4777–4780 CrossRef CAS PubMed
; (f) M. S. Han and D. H. Kim, Angew. Chem., Int. Ed., 2002, 41, 3809–3811 CrossRef CAS
; (g) A. Ojida, M. Yoshifumi, W. Jirarut, T. Shun-ichi, K. Sada and I. Hamachi, Chem. - Asian J., 2006, 1, 555–563 CrossRef CAS PubMed
.
-
(a) A. K. H. Hirsch, F. R. Fischer and F. Diederich, Angew. Chem., Int. Ed., 2007, 46, 338–352 CrossRef CAS PubMed
; (b) Y. J. Jang, E. J. Jun, Y. J. Lee, Y. S. Kim, J. S. Kimand and J. Yoon, J. Org. Chem., 2005, 70, 9603–9606 CrossRef CAS PubMed
; (c) H. K. Cho, D. H. Lee and J.-I. Hong, Chem. Commun., 2005, 1690–1692 RSC
; (d) D. H. Lee, J. H. Im, S. U. Son, Y. K. Chung and J.-I. Hong, J. Am. Chem. Soc., 2003, 125, 7752–7753 CrossRef CAS PubMed
; (e) S. Mizukami, T. Nagano, Y. Urano, A. Odani and K. Kikuchi, J. Am. Chem. Soc., 2002, 124, 3920–3925 CrossRef CAS PubMed
; (f) L. Fabbrizzi, N. Marcotte, F. Stomeo and A. Taglietti, Angew. Chem., Int. Ed., 2002, 41, 3811–3814 CrossRef CAS
.
-
(a) J. K. Kwon, N. J. Singh, H. N. Kim, S. K. Kim, K. S. Kim and J. Yoon, J. Am. Chem. Soc., 2004, 126, 8892–8893 CrossRef CAS PubMed
; (b) A. Ojida, Y. Mito-oka, K. Sada and I. Hamachi, J. Am. Chem. Soc., 2004, 126, 2454–2463 CrossRef CAS PubMed
.
- P. Ritter, Biochemistry, 1999, 36, 1996 Search PubMed
.
- L. R. Kelland, Eur. J. Cancer, 2005, 41, 971–979 CrossRef CAS PubMed
.
- C. Metcalfe and J. A. Thomas, Chem. Soc. Rev., 2003, 32, 215–224 RSC
.
- A. Ray, G. M. Rosair, R. Kadam and S. Mitra, Polyhedron, 2009, 28, 796–806 CrossRef CAS
.
- K. H. Thompson and C. Orvig, Dalton Trans., 2006, 761–764 RSC
.
- Y. Chen, Y. J. Liu, Q. Li and K. Z. Wang, J. Inorg. Biochem., 2009, 103, 1395–1404 CrossRef CAS PubMed
.
- F. Li, W. Chen, C. Tang and S. Zhang, Talanta, 2008, 77, 1–8 CrossRef CAS PubMed
.
- F. A. Beckford, J. Thessing, A. Stott, A. A. Holder, O. G. Poluektov, L. Li and N. P. Seeram, Inorg. Chem. Commun., 2012, 15, 225–229 CrossRef CAS PubMed
.
- J. G. Liu, B. H. Ye, H. Li, Q. X. Zhen, L. N. Ji and Y. H. Fu, J. Inorg. Biochem., 1999, 76, 265–271 CrossRef CAS
.
- B. Cvek, V. Milacic, J. Taraba and Q. P. Dou, J. Med. Chem., 2008, 51, 6256–6258 CrossRef CAS PubMed
.
- V. Milacic, D. Chen, L. Giovagnini, A. Diez, D. Fregona and Q. P. Dou, Toxicol. Appl. Pharmacol., 2008, 231, 24–33 CrossRef CAS PubMed
.
- N. Farrell, Compr. Coord. Chem. II, 2003, 9, 809–840 Search PubMed
.
- M. D. Kuwabara, C. Yoon, T. E. Goyne, T. Thederahn and D. S. Sigman, Biochemistry, 1986, 25, 7401–7408 CrossRef CAS PubMed
.
- N. Raman, S. Sobha and A. Thamaraichelvan, Spectrochim. Acta, Part A, 2011, 78, 888–898 CrossRef CAS PubMed
.
- F. R. Keene, J. A. Smith and J. G. Collins, Coord. Chem. Rev., 2009, 253, 2021–2035 CrossRef CAS
.
- B. H. Geierstanger, M. Mrksich, P. B. Dervan and D. E. Wemmer, Science, 1994, 266, 646–650 CrossRef CAS PubMed
.
- P. Krishnamoorthy, P. Sathyadevi, A. H. Cowley, R. R. Butorac and N. Dharmaraj, Eur. J. Med. Chem., 2011, 46, 3376–3387 CrossRef CAS PubMed
.
- R. C. Sharma and V. K. Varshney, J. Inorg. Biochem., 1991, 41, 299–304 CrossRef CAS
.
- R. Krämer, Coord. Chem. Rev., 1999, 182, 243–261 CrossRef
.
-
(a) D. Gani and J. Wilkie, Chem. Soc. Rev., 1995, 55–63 RSC
; (b) W. N. Lipscomb and N. Strater, Chem. Rev., 1996, 96, 2375–2484 CrossRef CAS PubMed
; (c) D. E. Wilcox, Chem. Rev., 1996, 96, 2435–2458 CrossRef CAS PubMed
.
- H. Steinhagen and G. Helmchen, Angew. Chem., Int. Ed. Engl., 1996, 35, 2339–2342 CrossRef CAS
.
- N. Strater, W. N. Lipscomb, T. Klabunde and B. Kerbs, Angew. Chem., Int. Ed. Engl., 1996, 35, 2024–2055 CrossRef
.
- P. Gettins and J. E. Coleman, J. Biol. Chem., 1984, 259, 4991–4997 CAS
.
- L. Ma, T. T. Tibbitts and E. R. Kantrowitz, Protein Sci., 1995, 4, 1498–1506 CrossRef CAS PubMed
.
- F. Hollfelder and D. Herschlag, Biochemistry, 1995, 34, 1225512264 CrossRef PubMed
.
- J. E. Murphy, T. T. Tibbitts and E. RKantrovitz, J. Mol. Biol., 1995, 253, 604–617 CrossRef CAS PubMed
.
- E. Hough, L. K. Hansen, B. Birkens, K. Jynge, S. Hansen, A. Hardvik, C. Little, E. Dodson and Z. Derewenda, Nature, 1989, 338, 357 CrossRef CAS PubMed
.
- E. E. Kim and H. W. Wyckoff, J. Mol. Biol., 1991, 218, 449–464 CrossRef CAS PubMed
.
- J. E. Coleman, Annu. Rev. Biophys. Biomol. Struct., 1992, 21, 441–483 CrossRef CAS PubMed
.
- A. B. Sen and S. K. Sengupta, J. Indian Chem. Soc., 1962, 39, 628 CAS
.
- S. Satyanarayana, J. C. Dabrowiak and J. B. Chaires, Biochemistry, 1993, 32, 2573–2584 CrossRef CAS PubMed
.
- J. K. Barton, J. M. Goldberg, C. V. Kumar and N. J. Turro, J. Am. Chem. Soc., 1986, 108, 2081–2088 CrossRef CAS
.
- A. M. Pyle, J. P. Rehmann, R. Meshoyrer, C. V. Kumar, N. J. Turro and J. K. Barton, J. Am. Chem. Soc., 1989, 111, 3051–3058 CrossRef CAS
.
- P. R. Reddy, A. Shilpa, N. Raju and P. Raghavaiah, J. Inorg. Biochem., 2011, 105, 1603–1612 CrossRef CAS PubMed
.
- A. K. Patra, S. Roy and A. R. Chakravarty, Inorg. Chim. Acta, 2009, 362, 1591–1599 CrossRef CAS
.
- G. J. Chen, X. Qiao, P. Q. Qiao, G. J. Xu, J. Y. Xu, J. L. Tian, W. Gu, X. Liu and S. P. Yan, J. Inorg. Biochem., 2011, 105, 119–126 CrossRef CAS PubMed
.
- C. L. Liu, J. Y. Zhou and H. B. Xu, J. Inorg. Biochem., 1998, 71, 1–6 CrossRef CAS PubMed
.
- S. Mahadevan and M. Palaniandavar, Inorg. Chem., 1998, 37, 3927–3934 CrossRef CAS PubMed
.
- X. M. Xu, J. H. Yao, Z. W. Mao, K. B. Yu and L. N. Ji, Inorg. Chem. Commun., 2004, 7, 803–805 CrossRef CAS
.
- G. M. Sheldrick, Acta Crystallogr., Sect. A: Found. Crystallogr., 2008, 64, 112–122 CrossRef CAS PubMed
.
- B. Delley, J. Chem. Phys., 2000, 113, 7756 CrossRef CAS
.
- B. Delley, J. Phys. Chem., 1996, 100, 6107–6110 CrossRef CAS
.
- Y. Zhao and D. G. Truhlar, J. Chem. Phys., 2006, 125, 194101 CrossRef PubMed
.
- B. Delley, J. Chem. Phys., 1990, 92, 508 CrossRef CAS
.
- D. A. Case, T. A. Darden, T. E. Cheatham III, C. L. Simmerling, J. Wang, R. E. Duke, R. Luo, R. C. Walker, W. Zhang, K. M. Merz, B. Roberts, S. Hayik, A. Roitberg, G. Seabra, J. Swails, A. W. Götz, I. Kolossváry, K. F. Wong, F. Paesani, J. Vanicek, R. M. Wolf, J. Liu, X. Wu, S. R. Brozell, T. Steinbrecher, H. Gohlke, Q. Cai, X. Ye, J. Wang, M. J. Hsieh, G. Cui, D. R. Roe, D. H. Mathews, M. G. Seetin, R. Salomon-Ferrer, C. Sagui, V. Babin, T. Luchko, S. Gusarov, A. Kovalenko and P. A. Kollman , AMBER 12, University of California, San Francisco, 2012 Search PubMed
.
- D. van der Spoel, E. Lindahl, B. Hess, G. Groenhof, A. E. Mark and H. J. C. Berendsen, J. Comput. Chem., 2005, 26(16), 1701–1718 CrossRef CAS PubMed
.
- B. Hess, C. Kutzner, D. van der Spoel and E. Lindahl, J. Chem. Theor. Comput., 2008, 4(3), 435–447 CrossRef CAS PubMed
.
- M. J. Frisch, G. W. Trucks, H. B. Schlegel, G. E. Scuseria, M. A. Robb, J. R. Cheeseman Jr, J. A. Montgomery, T. Vreven, K. N. Kudin, J. C. Burant, J. M. Millam, S. S. Iyengar, J. Tomasi, V. Barone, B. Mennucci, M. Cossi, G. Scalmani, N. Rega, G. A. Petersson, H. Nakatsuji, M. Hada, M. Ehara, K. Toyota, R. Fukuda, J. Hasegawa, M. Ishida, T. Nakajima, Y. Honda, O. Kitao, H. Nakai, M. Klene, X. Li, J. E. Knox, H. P. Hratchian, J. B. Cross, V. Bakken, C. Adamo, J. Jaramillo, R. Gomperts, R. E. Stratmann, O. Yazyev, A. J. Austin, R. Cammi, C. Pomelli, J. W. Ochterski, P. Y. Ayala, K. Morokuma, G. A. Voth, P. Salvador, J. J. Dannenberg, V. G. Zakrzewski, S. Dapprich, A. D. Daniels, M. C. Strain, O. Farkas, D. K. Malick, A. D. Rabuck, K. Raghavachari, J. B. Foresman, J. V. Ortiz, Q. Cui, A. G. Baboul, S. Clifford, J. Cioslowski, B. B. Stefanov, G. Liu, A. Liashenko, P. Piskorz, I. Komaromi, R. L. Martin, D. J. Fox, T. Keith, M. A. Al-Laham, C. Y. Peng, A. Nanayakkara, M. Challacombe, P. M. W. Gill, B. Johnson, W. Chen, M. W. Wong, C. Gonzalez, and J. Pople, A, Gaussian 03, Revision C.02, Gaussian, Inc., Wallingford CT, 2004 Search PubMed
.
- J. Wang, W. Wang, P. A. Kollman and D. A. Case, J. Mol. Graphics Modell., 2006, 25(2), 247–260 CrossRef CAS
.
- W. L. Jorgensen, J. Chandrasekhar, J. D. Madura, R. W. Impey and M. L. Klein, J. Chem. Phys., 1983, 79(2), 926 CrossRef CAS
.
- H. J. C. Berendsen, J. P. M. Postma, W. F. Vangunsteren, A. Dinola and J. R. Haak, J. Chem. Phys., 1984, 81(8), 3684 CrossRef CAS
.
- M. Parrinello and A. Rahman, J. Appl. Phys., 1981, 52(12), 7182 CrossRef CAS
.
- P. X. Xi, Z. H. Xu, X. H. Liu, F. J. Chen and Z. Z. Zeng, Chem. Pharm. Bull., 2008, 56, 541–546 CrossRef CAS PubMed
.
- M. Lee, A. L. Rhodes, M. D. Wyatt, S. Forrow and J. A. Hartley, Biochemistry, 1993, 32, 4237–4245 CrossRef CAS PubMed
.
Footnote |
| † Electronic supplementary information (ESI) available. CCDC 1911646 and 1911647. For ESI and crystallographic data in CIF or other electronic format see DOI: 10.1039/c9ra10549b |
| This journal is © The Royal Society of Chemistry 2020 |


