 Open Access Article
Enhanced osteogenic differentiation of BMSCs and M2-phenotype polarization of macrophages on a titanium surface modified with graphene oxide for potential implant applications†
Qingfan Liab,
Anfeng Shenc and
Zuolin Wang *ab
*ab
aShanghai Engineering Research Center of Tooth Restoration and Regeneration, Department of Oral Implant, School of Stomatology, Tongji University, 399 Yanchang Road, Shanghai, 200072, China. E-mail: zuolin@tongji.edu.cn; Fax: +86-21-66524025; Tel: +86-21-66313725
bDepartment of Oral Implant, School of Stomatology, Hospital of Stomatology, Tongji University, Shanghai, 200092, China
cSchool of Materials Science and Engineering, University of Shanghai for Science and Technology, Shanghai, 200093, China
First published on 27th April 2020
Abstract
Osseointegration at the bone–implant interface is a complex biological process that is triggered by the immune-inflammatory response and mediated by various cell types such as, bone-forming cells and immune cells, especially macrophages. The polarization of macrophages to inflammatory/regenerative (M1/M2) phenotypes, as well as the osteogenic differentiation of bone marrow mesenchymal stem cells (BMSCs) at the bone–implant interface, significantly affects implant osseointegration and even causes implant failure. Graphene oxide (GO) is a promising candidate for performing implant surface functionalization to modulate the interactions between implants and cells. Herein, we explored the effects of a GO coating on the osteogenic differentiation of BMSCs and the polarization of macrophages to enhance the application of GO surface modification in improving bone–implant integration. In the present study, a large particle sandblasting and acid etching (SLA) surface that is commonly used in clinical practice was selected as the control group, and GO was deposited on the SLA surface by the ultrasonic atomization spraying technique. The surface characteristics of these two groups, including the surface morphology, roughness, wettability, protein adsorption capacity and cell compatibility, were assessed. Then, the effects of GO surface modification on the osteogenic differentiation of BMSCs and the polarization of macrophages were evaluated. The results showed that the GO coating was successfully fabricated on the titanium substrates, which endowed the SLA surface with improved hydrophilicity and protein adsorption capacity and reduced roughness. Compared with the SLA surface, the GO-modified surface significantly enhanced the osteogenic differentiation of BMSCs and the M2-phenotype polarization of macrophages in vitro. This dual-regulatory role is of great significance in achieving rapid osseointegration as well as resolving the poor osseointegration associated with macrophage-related inflammation.
1. Introduction
Titanium implants are widely used as bone inserts due to their excellent mechanical properties, good corrosion resistance and favorable biocompatibility.1–4 However, systemic diseases such as osteoporosis or diabetes, and even the aseptic inflammation associated with the “foreign body” properties of the implant, often lead to poor osseointegration, which seriously affects the success of the implant. Therefore, the focus of bone implant research is still to improve the efficiency of osseointegration through surface modification. The main methods of implant surface modification are as follows: physical subtraction, chemical addition and biomimetic alteration.5 These methods are based on changing the physical, chemical or biological activity of the material surface and regulating the interactions between the biomaterial and cells to achieve enhanced osteogenesis. In a systematic review, it was noted that more than 90% of all studies in the field of biomaterial osseointegration focus on the effects of biomaterials on BMSCs and osteoblasts.6 However, the implant as a “foreign body” inevitably triggers an immune-inflammatory response, and osseointegration is a complex healing process that involves various factors. Therefore, implant surface modification research should focus on its effect on bone-forming cells as well as immune inflammatory cells after implantation.Macrophages, which are the first cells to come into contact with the implant surface after insertion, play a decisive role in bone–implant integration.7,8 Studies in the past two decades have suggested that macrophages not only have phagocytic functions, but also actively participate in tissue repair and reconstruction by secreting chemokines and cytokines.9 Macrophages become activated after migrating to the injury site and show two functional polarization states, the M1 phenotype, which promote inflammatory response, and the M2 phenotype, which alleviates inflammatory response and enhances tissue repair.10 A clinical study on the failure of orthopedic implants showed that the presence of excessive M1-polarized macrophages around pure titanium artificial joints is an important factor related to the failure of implant materials and could lead to absorption of the surrounding bone and loosening of the implants.11 Therefore, regulating macrophage polarization towards an anti-inflammatory, pro-healing phenotype (M2) is essential for bone repair and bone–implant integration, as is promoting osteogenic differentiation of BMSCs. Previous studies have revealed that implant surface changes in roughness and morphology could indirectly influence macrophage function, including survival, adhesion, gene expression and secretion.12–14 In addition, a disordered nanoscale surface of the implant can regulate the expression of inflammatory and osteogenic genes more strongly than the microscale surface.15 These studies suggest that macrophages are sensitive to certain modifications on the surface of the implant and that it is necessary to construct favorable nanometer modifications on the implant surface to further promote osseointegration through M1/M2 polarization.
Graphene oxide (GO) is an oxygen-containing derivative of graphene. Research on the application of GO in the field of biomedicine, particularly in tissue regeneration, has been extensive in recent years.16–18 For example, GO–carrageenan composites exhibited good cellular activities, including cell attachment, cell proliferation and calcium deposition.19 Moreover, GO–calcium phosphate nanocomposites significantly facilitated the osteogenesis of human MSCs and further enhanced calcium deposition by osteoblasts.20 GO has excellent mechanical performance, stable chemical properties, good biocompatibility, and many other advantages, such as the ability to interact with other biomolecules for regenerative medicine and tissue engineering.21 These results suggest that GO is a promising candidate for performing implant surface functionalization to modulate the interactions between implants and cells. Moreover, although previous studies have explored cell responses to GO biomaterials, the effect of GO modification on the SLA-treated titanium substrates on the osteogenic differentiation of BMSCs remains to be further investigated, and the interactions between GO and macrophages have not been well reported.
Guided by these considerations, we first constructed a control surface structure on a titanium substrate by SLA, and then an ultrasonic atomization spraying technique was applied to coat nano-GO onto it to develop the GO-modified material surface. Then, rat BMSCs were inoculated on the material surface to evaluate the role of GO modification on the osteogenic differentiation of BMSCs. RAW264.7 macrophages were inoculated on the material surface, and the effect of GO modification on macrophage polarization was evaluated. According to the experimental results, the GO modification developed here endowed the SLA substrate with the ability to enhance osteogenic differentiation of BMSCs and the M2 phenotype polarization of macrophages, which could ultimately contribute to improving the osseointegration and long-term behavior of the implants.
2. Materials and methods
2.1. Preparation of the GO-modified titanium substrates
All 10 × 10 × 2 mm3 samples of pure titanium substrates were first treated with large particle sandblasting and acid etching at the Shanghai Institute of Ceramics, Chinese Academy of Sciences (Shanghai, China). The specific method was as follows. Under a pressure of 4 bar, Al2O3 particles with a diameter of 0.5 mm were used for sandblasting perpendicular to the titanium base. After that, the substrates were immersed in a mixture of hydrochloric acid and sulfuric acid and etched in a water bath at 60 °C for 8 h.22 The resulting samples treated with only SLA were used as controls and are referred to as the SLA samples. To prepare the GO coating, half of the SLA-treated materials were immersed in a 3% solution of (3-aminopropyl)triethoxysilane (APTES) for 1 h to introduce positive amine groups onto the material surface.23 Then, ethanol and ultrapure water were used for cleaning. GO was purchased from Zhejiang Carbon Valley Materials Technology Company (Zhejiang, China), where it was synthesized by a modified Hummers' method. A GO dispersion with a concentration of 0.05% (w/v) was prepared by magnetic agitation and then sonicated for 30 min. The GO coating was developed on the surface of a pure titanium substrate treated with SLA by an ultrasonic atomization spraying apparatus (Siansonic, China) at the University of Shanghai for Science and Technology (Shanghai, China). The GO dispersion was pumped to the nozzle at 250 μL min−1. The spraying distance (from the atomizer outlet to the material surface) was 10 cm, and the spraying time was 90 s. The SLA-treated samples coated with GO are referred to as the SLA/GO samples.2.2. Surface characterization of the GO-modified titanium substrates
Transmission electron microscopy (TEM, TECNAI, FEI, USA) and X-ray photoelectron spectroscopy (XPS, PHI 5000C ESCA system, PHI, USA) were used to evaluate the GO used in this experiment. XPS was used to identify the successful modification of APTES on the SLA surface before GO coating. A field emission scanning electron microscope (FE-SEM, S-4800, Hitachi, Japan) with an accelerating voltage of 2.0 kV was used to investigate the surface topography. The surface roughness and morphology of various samples were assessed by atomic force microscopy (AFM, NanoScope MultiMode IIIa, Veeco, USA). Raman spectra from 1000 to 3000 cm−1 were evaluated using a Raman microscope system (Lab-RAM, Horiba Jobin Yvon, France) with an Ar-ion laser at 20 mm, and the wavelength was set at 532 nm. A contact angle instrument (DSA100, Kruss, Germany) was applied to determine the wettability of the various surfaces. The protein adsorption capacity of the material surface was determined as follows. After the materials were immersed in a 1 mg mL−1 bovine serum albumin (BSA, Biosharp, China) solution in a 24-well cell culture plate for 24 h, the unadhered proteins were washed with phosphate-buffered saline (PBS), the proteins adhered to the material surface were washed with 2% sodium dodecyl sulfate (SDS, Sigma, USA), and the protein concentration was determined by a BCA protein quantitation assay kit (Beyotime, China).2.3. Cell culture
Flow cytometry was used to detect known markers on the cell surface for BMSCs identification. The cells were stained with antibodies against APC-CD29, FITC-CD90, PE-CD3, PE-CD11b and PE-CD45 (all from BD, USA). Quantitative fluorescence analysis was performed with a flow cytometer (BD, USA), and Flow Jo 7.6 software was used to analyze expression levels. In addition, to test the multipotency of the cells, the cells were cultured with osteogenic, chondrogenic or adipogenic media (Cyagen, USA) for 21 days. Standard Alizarin red, Oil Red O and Alcian Blue staining were used to identify osteoblasts, cartilage and adipocyte-like cells, respectively.
2.4. Cytotoxicity of the GO coating
To assess the cytotoxicity of the GO coating, count of live/dead cells after seeding on the substrates was determined with a Live/Dead Double Staining Kit (Yeasen, China). The BMSCs were inoculated on the material surface and cultured for 48 h. After the cells were washed with PBS 3 times, a working solution that included calcein-AM and propidium iodide (PI), was added into the cell culture plates for 30 min, and the plates were protected from light according to the manufacturer's instructions. The cell fluorescence images were obtained with a fluorescence microscope at excitation/emission wavelengths of 490/515 nm for live cells and 535/617 nm for dead cells, respectively. The percentage of live cells was calculated using ImageJ software.2.5. Cell viability
Cell viability of BMSCs at 1, 3, 7 and 14 days and macrophages at 1, 3 and 7 days was determined using a Cell Counting Kit-8 (CCK-8, Dojindo, Japan) as detailed elsewhere,24 based on the measurement of mitochondrial activity. In brief, the cell culture on the material surfaces was terminated at specific time points, and the samples were transferred to a new 24-well plate. After rinsing with PBS 3 times, the CCK-8 solution was mixed with complete medium at a 1![[thin space (1/6-em)]](https://www.rsc.org/images/entities/char_2009.gif) :
:![[thin space (1/6-em)]](https://www.rsc.org/images/entities/char_2009.gif) 10 ratio and added to the cell culture plate, and the cells were incubated for 3 h at 37 °C according to the manufacturer's instructions. The 150 μL of supernatant from each well was transferred to a 96-well plate and the absorbance at 450 nm was recorded using a microplate reader (BioTek, USA).
10 ratio and added to the cell culture plate, and the cells were incubated for 3 h at 37 °C according to the manufacturer's instructions. The 150 μL of supernatant from each well was transferred to a 96-well plate and the absorbance at 450 nm was recorded using a microplate reader (BioTek, USA).
2.6. Cell morphology
The cytoskeleton of the cells was stained with a fluorescent F-actin stain to observe the cell morphology. After 24 h of culture, the cells were rinsed 3 times with PBS, fixed with 4% paraformaldehyde (PFA) and permeabilized with 0.1% Triton X-100. After that, the cytoskeleton was labeled with FITC-phalloidin (Sigma, USA) for 45 min, and the nucleus was labeled with 4′,6-diamidino-2-phenylindole (DAPI, Sigma, USA) for 15 min. Finally, the cells were observed using a confocal laser scanning microscopy (CLSM, Leica, Germany).2.7. Osteogenic differentiation of BMSCs
![[thin space (1/6-em)]](https://www.rsc.org/images/entities/char_2009.gif) 000 rpm for 10 min at 4 °C. The total protein concentration was measured with a BCA protein quantitation assay kit. Then, a commercial ALP activity assay kit (Jiancheng, China) was used to measure the ALP activity of BMSCs in accordance with the manufacturer's instructions.
000 rpm for 10 min at 4 °C. The total protein concentration was measured with a BCA protein quantitation assay kit. Then, a commercial ALP activity assay kit (Jiancheng, China) was used to measure the ALP activity of BMSCs in accordance with the manufacturer's instructions.| Gene | Primer sequences (F: forward primer; R: reverse primer) |
|---|---|
| RUNX2 | F: 5′-CCATAACGGTCTTCACAAATCCT-3′ |
| R: 5′-TCTGTCTGTGCCTTCTTGGTTC-3′ | |
| ALP | F: 5′-AACGTGGCCAAGAACATCATCA-3′ |
| R: 5′-TGTCCATCTCCAGCCGTGTC-3′ | |
| OCN | F: 5′-GGTGCAGACCTAGCAGACACCA-3′ |
| R: 5′-AGGTAGCGCCGGAGTCTATTCA-3′ | |
| OPN | F: 5′-GCGGTGAGTCTAAGGAGTCCC-3′ |
| R: 5′-TCAGATCCACGACGGACACA-3′ | |
| GAPDH | F: 5′-GGCACAGTCAAGGCTGAGAATG-3′ |
| R: 5′-ATGGTGGTGAAGACGCCAGTA-3′ |
2.8. Macrophage polarization
| Gene | Primer sequences (F: forward primer; R: reverse primer) |
|---|---|
| TNF-α | F: 5′-CTGTAGCCCACGTCGTAGCAA-3′ |
| R: 5′-TGTCTTTGAGATCCATGCCGTT-3′ | |
| iNOS | F: 5′-ACGCTTCACTTCCAATGCAAC-3′ |
| R: 5′-CAGCCTCATGGTAAACACGTTC-3′ | |
| IL-10 | F: 5′-GAGAAGCATGGCCCAGAAATC-3′ |
| R: 5′-GAGAAATCGATGACAGCGCC-3′ | |
| Arg-1 | F: 5′-ATCAACACTCCCCTGACAACC-3′ |
| R: 5′-TCGCAAGCCAATGTACACGAT-3′ | |
| GAPDH | F: 5′-AGAACATCATCCCTGCATCCAC-3′ |
| R: 5′-TCAGATCCACGACGGACACA-3′ |
2.9. Statistical analysis
The data are expressed as the average ± standard deviation. Statistical analysis between two samples was performed by one-way ANOVA, and a p value less than 0.05 was considered statistically significant.3. Results and discussion
3.1. Preparation of the GO-modified titanium substrates
TEM and XPS were applied to identify GO used in this experiment. The TEM images presented a wrinkled structure of the GO (Fig. S1a†). The XPS analysis results are showed in Fig. S1b.† C and O element were detected by full-spectrum XPS, in addition, the C 1s spectra of GO indicate the presence of three types of carbon bonds: C–C (284.5 eV), C–OH (286.2 eV) and C![[double bond, length as m-dash]](https://www.rsc.org/images/entities/char_e001.gif) O (287.8 eV). This result is consistent with other study.25 To prepare the GO coating, APTES was used to introduce positive amino groups onto the SLA-treated surface in advance. This strategy was motivated by electrostatic interactions.26,27 The aqueous GO sheets were moderately charged (negative, because of ionized carboxyl groups),28 but they were metastable and tended to precipitate onto titanium substrates that were precharged with APTES, which is rich in amino groups. As a result, GO bound to the APTES-modified titanium substrates, initiating the formation of the GO layer. XPS results showed that the titanium substrate appeared the wave peaks of Si and N element after modification with APTES, which confirmed that APTES was grafted on the material surface successfully (Fig. S2†).
O (287.8 eV). This result is consistent with other study.25 To prepare the GO coating, APTES was used to introduce positive amino groups onto the SLA-treated surface in advance. This strategy was motivated by electrostatic interactions.26,27 The aqueous GO sheets were moderately charged (negative, because of ionized carboxyl groups),28 but they were metastable and tended to precipitate onto titanium substrates that were precharged with APTES, which is rich in amino groups. As a result, GO bound to the APTES-modified titanium substrates, initiating the formation of the GO layer. XPS results showed that the titanium substrate appeared the wave peaks of Si and N element after modification with APTES, which confirmed that APTES was grafted on the material surface successfully (Fig. S2†).
After that, GO coating was prepared on the titanium substrates by ultrasonic atomization spraying. The GO dispersion was atomized by high-frequency ultrasonic oscillation and then sent to the object surface by a specified amount of carrier gas. Compared with other methods for preparing coatings, such as immersion, drop-casting and spin-coating, the coating formed by ultrasonic spraying has the advantages of a simple application, good distribution direction and controllable coating thickness.29–31 Therefore, ultrasonic atomization spraying is a simple and efficient method for preparing GO coatings in the field of biomaterial surface modification.
3.2. Surface characterization of the GO-modified titanium substrates
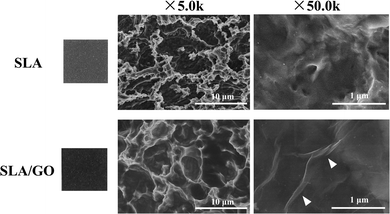
As shown in the macroscopic photos, the color of the material surface after GO coating was darker than that of the SLA surface. According to the SEM images shown in Fig. 1, after SLA, the titanium substrates showed an irregular rough surface with visible pits of uneven size at the microscale. The GO-modified SLA surface also presented a pitted structure at low magnification (5.0k). When it was magnified 50.0k times, the characteristic wrinkle-like structure of GO (as shown by the white arrow) was spread on the sample surface, indicating that the material surface was successfully coated with GO, which produces wrinkled structures.A more subtle surface microstructure was observed by AFM, and the results are shown in Fig. 2. In addition, the roughness parameters were analyzed; the mean roughness (Ra) of the SLA and SLA/GO samples was 127 nm and 36 nm, and the root-mean-square of the Z data (Rq) was 163 nm and 43.6 nm, respectively. These results showed that the roughness of the material surface coated with GO decreased drastically.
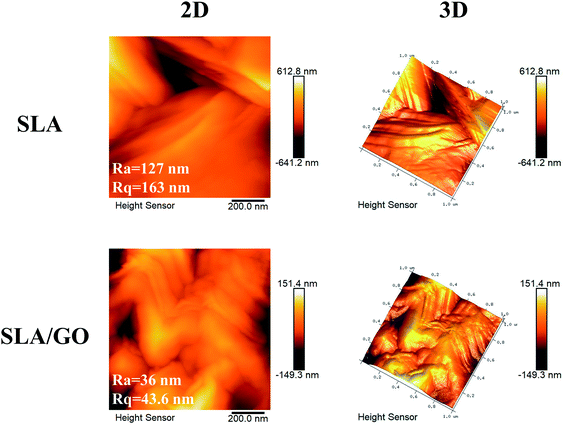 | ||
| Fig. 2 AFM analysis of the SLA and SLA/GO samples surface. Two-dimensional (2D) and three-dimensional (3D) surface microstructures and the roughness parameters (Ra and Rq) were detected. | ||
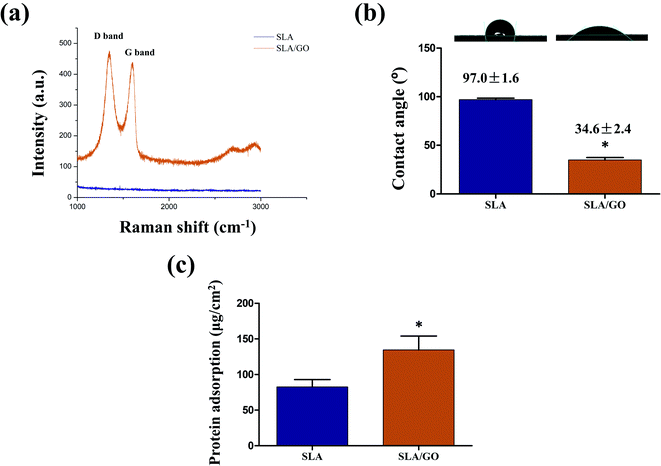
Raman spectroscopy was also used to analyze the characteristics of GO (Fig. 3a). The Raman spectrum of the SLA surface showed a straight line with no obvious peaks. After GO coating, the characteristic peaks of GO, such as a D band at ∼1350 cm−1 and a G band at ∼1580 cm−1, clearly appeared.32 This finding suggests that the original structure of GO in solution was not changed after being coated on the material surface by ultrasonic atomization spraying.
The hydrophilic and hydrophobic properties of the material surface were evaluated by contact angle detection (Fig. 3b). The contact angles of SLA and SLA/GO were 97.0 ± 1.6° and 34.6 ± 2.4°, respectively, indicating that the titanium surface treated with SLA was hydrophobic. The unavoidable deposition of carbon from the atmosphere onto titanium surfaces in the form of hydrocarbons is an important reason for the hydrophobic characteristics of the SLA surface.33 After GO coating, the surface of the material became hydrophilic as a result of the presence of hydrophilic carboxylic ends on GO.26 Several studies have shown that hydrophilic biomaterials promote the osteogenic differentiation of BMSCs and osteoblasts34,35 and simultaneously inhibit the adhesion, fusion, survival and inflammatory factor secretion of mononuclear macrophages.36–38
Furthermore, increased initial protein adsorption on the GO coating was observed (Fig. 3c). The physicochemical characteristics and wettability of a surface are the main factors that affect protein adsorption. Here, the GO coating was more hydrophilic than the SLA surface, thus facilitating protein adsorption. In addition, the GO coating facilitates protein adsorption due to electrostatic forces and hydrogen bonds, which promote the interactions with proteins.39
3.3. Identification of BMSCs
Known surface markers on the cells were identified by flow cytometry. The cells were positive for MSC markers, such as CD29 and CD90, and negative for CD11b (a monocyte marker), CD3 (a lymphocyte marker) and CD45 (a hematopoietic progenitor and endothelial cell marker) (Fig. S3a†). In addition, the cells were positive for Alizarin red, Oil Red O and Alcian Blue staining, when the cells were induced with osteogenic, adipogenic and chondrogenic media, respectively (Fig. S3b†). Taken together, these results indicated that the cells derived from rat bone marrow expressed specific markers of MSCs and had multidirectional differentiation potential.3.4. Cytotoxicity of the GO coating
Fluorescence staining of live and dead cells was used to evaluate the cellular compatibility of the GO modification. Cells stained with red fluorescent dye were dead, and green fluorescent cells were live (Fig. 4a). There was no significant difference in the percentage of live cells between these two groups (SLA and SLA/GO) at 48 h after inoculation according to Fig. 4b. This finding suggests that the GO modification has no toxic effect on cells. It was previously hypothesized that the rough edges of moving graphene would cut or puncture cell membranes, damaging cell activity.40 However, the GO coating, unlike GO in solution, has limited mobility on the material surface, thus greatly reducing the damage to cells.413.5. Cell viability
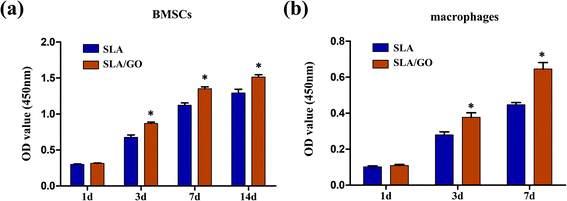
Cells' metabolic function during proliferation was assessed by measuring mitochondrial activity and expressed as cell viability (Fig. 5). For BMSCs, at day 1, there was no significant difference between these two groups. However, the subsequent timepoints at 3, 7 and 14 days revealed a noticeable increase on the SLA/GO surface compared with the SLA surface, indicating higher proliferation of BMSCs on the GO-modified surface than on the SLA surface. Similarly, for macrophages, there was no significant difference between these two groups on day 1, but on days 3 and 7, the GO-modified surface showed beneficial effects on cell viability. According to the viability data, the GO-coated material surface was more favorable than the SLA surface.3.6. Cell morphology
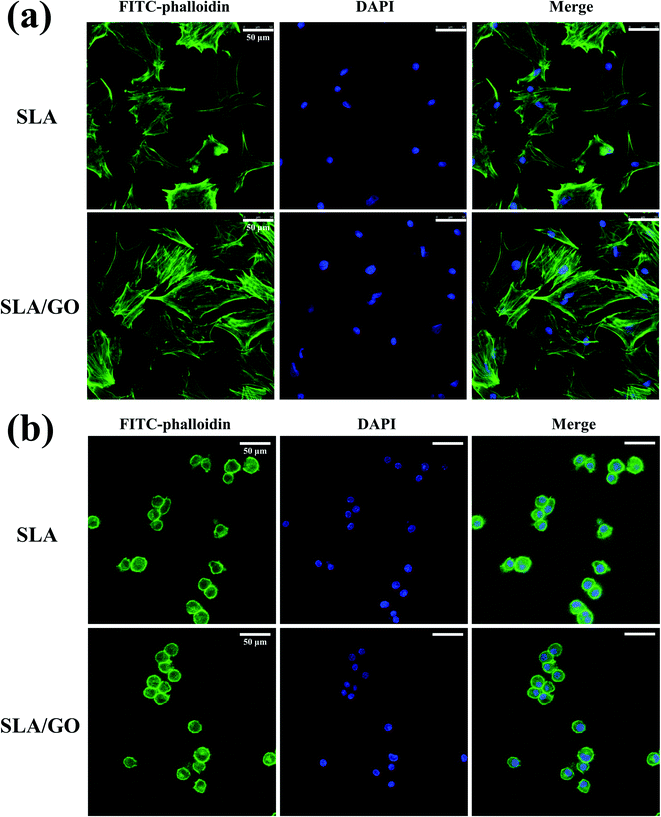
Cell morphology on the different material surfaces was observed by CLSM. For the BMSCs, the cells stretched well and had a polygonal appearance on both SLA and SLA/GO surfaces after 1 day of culture, but on the GO-modified surface, a large amount of F-actin expression could be observed, and the cells displayed a more spread-out appearance than the cells on the SLA surface (Fig. 6a). For macrophages, the cytoskeleton was not obvious. After 1 day of culture on these two surfaces, the macrophages exhibited a roundish morphology, with no obvious difference in cell morphology between the SLA and SLA/GO surfaces (Fig. 6b). The results indicate that GO modification could promote the extension of BMSCs but had little effect on the morphology of macrophages after 1 day of culture.3.7. Osteogenic differentiation of BMSCs
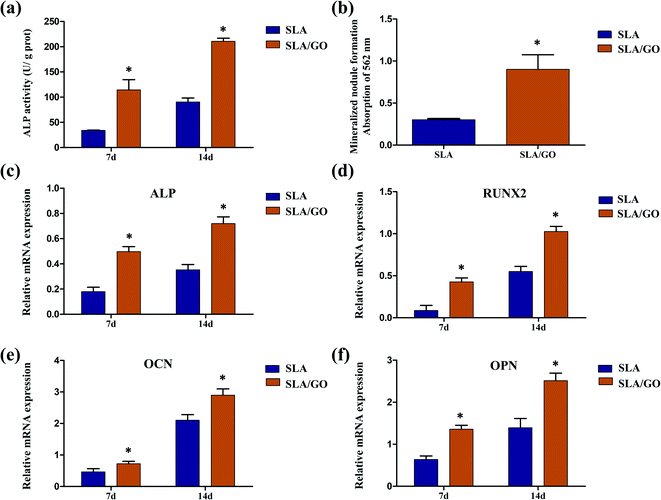
ALP activity was detected to estimate the early osteogenic differentiation of BMSCs. Fig. 7a displays the ALP activity of BMSCs after 7 and 14 days. The GO-modified samples presented greater ALP activity than the SLA samples after culturing for 7 days (p < 0.05). At 14 days, this trend was more pronounced, suggesting that GO modification on the material surface stimulates the expression of ALP in cells. BMSCs, which were cultured on various sample surfaces for 21 days, were stained with Alizarin red to evaluate the mineralization of ECM, as shown in Fig. 7b. According to the results of the quantitative analysis, the mineralization of the ECM was significantly increased in the SLA/GO group compared to the SLA control group (p < 0.05). To better understand the osteogenic capacity of BMSCs cultured on the GO coatings, the expression of osteogenesis-related genes was detected using RT-PCR (Fig. 7c–f). On day 7, the expression of the osteogenic markers RUNX2, ALP, OPN and OCN was upregulated in the SLA/GO group compared with the SLA group (p < 0.05). After 14 days, the trend remained the same. These results indicate that GO modification is beneficial for promoting the expression of genes related to the osteogenic differentiation of BMSCs.Due to the large number of oxygen-containing functional groups, such as carboxyl and hydroxyl groups, on the surface of GO, it is easy to perform surface functionalization, so GO has broad application prospects in the field of biomedicine.42,43 When GO was coated onto the material surface, many properties of the material surface changed. In turn, the biological behaviors of cells inoculated on the surface were affected. In the present experiment, after being coated with GO, the material surface changed from an irregular rough surface morphology (originating from large particle sandblasting and acid etching) to a micro-nanoscale hierarchical morphology (nanostructured GO coated on the SLA surface). GO also provided a large number of wrinkles on the material surface, as shown in Fig. 1, changing the surface morphology, which can directly affect the spreading of cells and thus affect the responses of cells, especially the differentiation of cells.44,45 A difference in the BMSCs shape on SLA and SLA/GO surfaces was observed after 24 h of culture in our experiment (Fig. 6a); therefore, we supposed that the change in surface morphology may have acted as a physical stimulus for the BMSCs and promoted osteogenesis. Moreover, the GO coating reduced the roughness of the material surface, making the roughness of the SLA surface closer to that of bone tissue, which may be involved in promoting the osteogenic differentiation of BMSCs observed on the SLA/GO surface. According to the literature, the roughness of bone tissue is approximately 32 nm.46 Furthermore, the material surface changed from hydrophobic to hydrophilic after GO coating, and surface hydrophilicity is conducive to stem cell osteogenic differentiation, according to a previous report.47 Moreover, the hydrophilic surface has a higher affinity for proteins than the hydrophobic surface, as demonstrated by the protein adsorption experiment in this study from Fig. 3c. The initiation of protein adsorption after cell/implant interaction could enhance the proliferation, adhesion, spreading and differentiation of BMSCs during the process of osteogenesis. Besides, hydrophilic surfaces maintain the conformation and function of proteins, whereas hydrophobic surfaces are believed to cause the denaturation of proteins by changing their conformation.48 Therefore, in this experiment, the surface modified by GO showed better activity than the control surface in promoting the osteogenic differentiation of BMSCs (Fig. 7). In addition, the molecular mechanism by which GO modification could promote the osteogenic differentiation of BMSCs remains uncertain. Wu et al.49 found that GO could enhance osteogenic differentiation by activating the Wnt-related signaling pathway. However, Zhang et al.50 revealed that GO promoted the osteogenic ability of BMSCs by activating the Hif-1α pathway and further enhanced the expression of BMP-2 via the Erk1/2 signaling pathway. Hence, more research is needed to understand the underlying mechanisms of enhanced osteogenic differentiation induced by GO modification.
3.8. Macrophages polarization
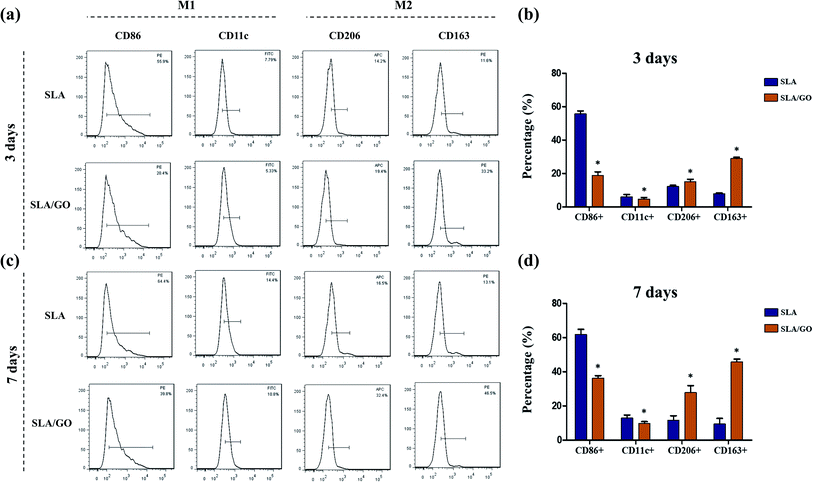
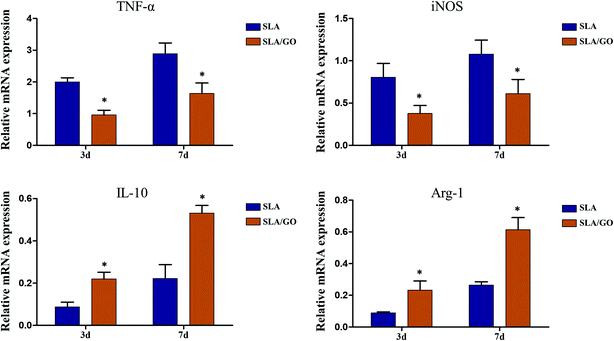
Macrophages, which are highly plastic, can be polarized to M1 and M2 phenotypes and express different surface markers; CD86 and CD11c are highly expressed on M1 macrophages, and CD206 and CD163 are highly expressed on M2 macrophages. Therefore, flow cytometry was applied to detect the expression of markers on the membranes of macrophage to determine the phenotype of macrophages and thereby infer the effect of material surface modification on the polarization of macrophages. In this experiment, macrophages on different material surfaces were cultured for 3 days, and the GO-modified material surface upregulated the fraction of CD163+ and CD206+ macrophages compared with that of macrophages cultured on the control SLA surface, as shown in Fig. 8a and b. At the same time, the SLA surface showed a higher fraction of CD86+ and CD11c+ macrophages than the SLA/GO surface (Fig. 8a and b). These results indicate that the GO-modified surface drives more macrophages towards M2-phenotype polarization than the SLA surface. In addition, the proportion of CD86+ macrophages was significantly higher than that of CD163+ and CD206+ macrophages on the SLA surface, while the proportion of CD86+ macrophages on the SLA/GO surface were similar to the proportion of CD163+ and CD206+ macrophages, which indicates that M1-phenotype macrophages are notably more abundant than M2-phenotype macrophages on the SLA surface and that the number of M1-phenotype macrophages is equivalent to that of M2-phenotype macrophages on the GO-modified surface. By comparing the proportion of M1/M2-phenotype macrophages on the material surfaces, it was concluded that the SLA surface induces an excessive number of M1-phenotype macrophages, which may lead to severe inflammatory responses, while the SLA/GO surface induces fewer M1-phenotype macrophages, which is more conducive to the alleviation of inflammation. After 7 days of culture, the proportion of M1-phenotype and M2-phenotype macrophages increased on both surfaces compared with that at 3 days, and the expression trends of M1 phenotype-related markers (CD86 and CD11c) and M2 phenotype-related markers (CD206 and CD163), as shown in Fig. 8c and d, were in line with the results observed at 3 days of culture. However, the M2-polarization of macrophages cultured on the surface modified by GO increased significantly with time, while the M2-polarization of macrophages cultured on the SLA surface did not increase significantly. These results suggest that GO modification promotes macrophage polarization to CD206-and CD163-positive macrophages, namely, M2-phenotype macrophages.In addition to the detection of cell surface molecular expression, macrophage polarization-related gene expression was detected by RT-PCR. As shown in Fig. 9, compared with macrophages on the SLA/GO surface, macrophages on the SLA surface expressed higher levels of TNF-α and iNOS (associated with M1-phenotype macrophages) at 3 and 7 days (p < 0.05). Similarly, the expression levels of IL-10 and Arg-1 (related to M2-phenotype macrophages) in the SLA/GO group were significantly higher than those in the SLA groups (p < 0.05). The gene expression results were consistent with the flow cytometry results; in other words, the GO modification promoted the M2 phenotype polarization of macrophages. The protein expression of the M1 marker iNOS and the M2 marker Arg-1 was measured by western blotting. Fig. 10a shows that compared with the SLA surface, GO modification promoted the generation of the M2 marker Arg-1 and downregulated the expression of the M1 marker iNOS. The quantitative analysis of the gray values for western blotting bands (Fig. 10b) confirmed this conclusion. Both RNA and protein levels indicate that GO modification is beneficial for promoting the polarization of macrophages to the M2 phenotype.
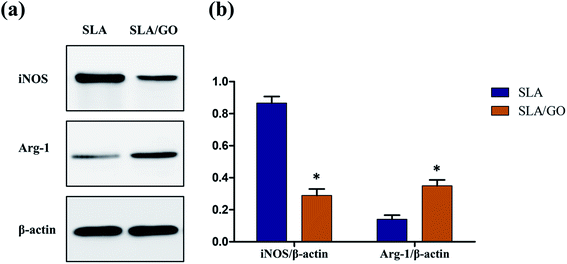 | ||
| Fig. 10 (a) Western blotting was used to assess the protein expression of iNOS (M1 marker) and Arg-1 (M2 marker) and (b) quantitative analysis of the gray value for western blotting bands. *p < 0.05. | ||
In a previous study, Han et al.51 demonstrated the role of dispersed GO in regulating macrophage polarization and its application in the repair of myocardial infarction. The authors suggested that the uptake of GO by macrophages significantly inhibits the production of intracellular reactive oxygen species (ROS) and downregulates the polarization of M1 macrophages and the secretion of inflammatory cytokines, thus diminishing the inflammatory response. In the current study, we found that the GO coating, similar to dispersed GO, could also regulate the phenotype polarization of macrophages (Fig. 8); the GO coating downregulated the expression of TNF-α and iNOS and upregulated the expression of IL-10 and Arg-1 (Fig. 9 and 10), thus creating a favorable microenvironment for implant–bone integration. In other words, both the uptake of GO by macrophages, which can regulate their polarization, and GO modification of the biomaterial surface provide important cues to regulate the M2 polarization of macrophages for potential implant application.
The surface characterization of the SLA and GO-modified titanium substrates showed that the GO coating on the SLA surface changed the initial surface morphology, forming a surface with nanoscale wrinkles and decreased roughness, which may affect the polarization of macrophages. Luu et al.52 found that the surface topographies of titanium substrates have a great influence on the polarization of macrophages, and nanoscale grooves on substrates drive macrophages towards an anti-inflammatory, pro-healing phenotype. Other studies have also suggested that compared to smooth surfaces, surfaces that contain microscale features appear to enhance the adhesion of macrophages and their secretion of inflammatory cytokines, including IL-1β, IL-6, and nitric oxide.53–56 Besides, studies have confirmed that compared with a microscale morphology, a nanoscale morphology inhibits the secretion of inflammatory cytokines and the synthesis of NO in macrophages.13,57 Therefore, we speculated that the nanoscale wrinkles and decreased roughness of the surface formed by GO were involved in the higher expression of M2 phenotype-related markers in macrophages cultured on this surface than in macrophages cultured on the SLA surface. Additionally, the wettability of the material surface is also an important factor affecting the function of macrophages, and a hydrophilic surface inhibits monocyte adhesion, macrophage fusion and the secretion of inflammatory factors.36 Furthermore, a hydrophilic titanium surface tends to cause a less severe inflammatory response than a hydrophobic titanium surface.58 Compared to hydrophobic surfaces, hydrophilic surfaces exhibit enhanced RAW macrophage polarization towards an anti-inflammatory and pro-healing (M2) phenotype through the interactions of integrin β1 with adsorbed FN.59 Here, macrophages cultured on highly hydrophilic surfaces produced by the GO coating were polarized to an anti-inflammatory phenotype, which is beneficial for improving healing around biomaterials.60 Moreover, anti-inflammatory M2 phenotype macrophage-associated cytokines (IL-10 and TGF-β) support the growth of MSCs, whereas pro-inflammatory M1 phenotype macrophage-associated cytokines (IL-1β, IL-6, TNF-α and IFN-γ) inhibit the growth of MSCs in vitro.61 Thus, GO modification could promote osteogenesis by regulating macrophage M2-polarization and provide a favorable immune microenvironment for bone–implant integration, which is also conducive to implant healing and long-term stability. Although the exact mechanism by which GO modification induces the polarization of macrophages remains unclear, our findings may at least partly suggest that the material surface properties, including microstructure, roughness and wettability, may contribute to the effects of GO coating on macrophage polarization. Moreover, further studies will be necessary to unveil the intrinsic cues for GO-mediated macrophage polarization and wound healing.
Osseointegration is the “golden standard” to evaluate the success of implants, so considerable effort has been made to optimize the surface properties to improve the osseointegration of biomaterials. However, different types of implantable biomaterials still exhibit various biological responses inside and outside of the host. For example, hydroxyapatite particles exhibit good bone regeneration effects in vitro but do not induce sufficient bone formation in vivo.62 Biomedical stainless steel shows good biocompatibility with osteoblasts in vitro but easily induces the formation of inflammatory fiber capsules in vivo.63 These findings serve as a reminder that there may be differences in the results obtained with biomaterials in vivo and in vitro and suggest that the reasons for these differences may be related to the response of the host to the implant material. The surface characteristics of implants can directly affect bone-forming cells, such as osteoblasts and osteoclasts, regulating bone metabolism, and also affect bone immune cells, such as macrophages, secreting corresponding cytokines for participation in tissue repair and regeneration. Immune regulation, as well as bone metabolism regulation, are both highly important factors that should be considered in biomaterial design.
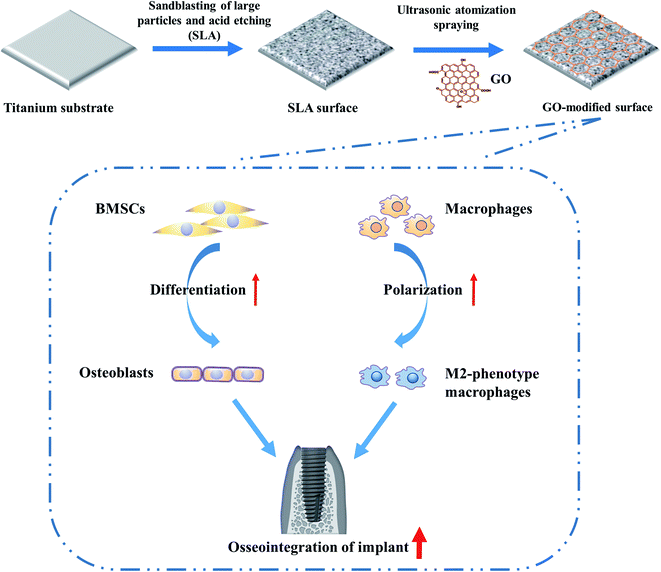
In this study, we investigated the dual effects of GO modification by constructing a GO coating on the titanium surface and found that GO modification promoted the osteogenic differentiation of BMSCs and the M2-polarization of macrophages (Fig. 11). These results indicate that the implants modified by GO are not only beneficial for enhancing bone–implant integration, shortening healing time but also beneficial for resolving the poor osseointegration and surrounding bone absorption associated with macrophage-related inflammation. Therefore, such GO modification with dual-regulatory effects could provide a promising strategy for enhancing osseointegration via implantable biomaterial surface modification. Nevertheless, our study is preliminary, and we plan to construct GO coatings with different thicknesses to simultaneously evaluate tissue integration and the immune response in the next step. After that, further experiments will be needed to investigate in vivo results.
4. Conclusions
In this work, GO was deposited on titanium surfaces by ultrasonic atomization spraying, which is a simple and efficient method for preparing GO coatings. The effects of GO modification on BMSCs and macrophages were investigated here, and GO significantly improved the osteogenic differentiation of BMSCs and promoted the M2 phenotype polarization of macrophages. Such dual-regulatory roles are helpful for realizing rapid osseointegration and resolving the poor osseointegration caused by aseptic inflammation in clinical applications. Furthermore, endowing bone biomaterials with favorable osteoimmunomodulatory properties may be a valuable strategy for the development of advanced bone biomaterials.Conflicts of interest
The authors declare that no competing interests exist.Acknowledgements
This work was financially supported by grants from the National Natural Science Foundation of China (No. 81271110 and 81670962), the Fundamental Research Funds for the Central Universities of China (No. 20152957) and the National Key Research and Development Program of China (No. 2018YFE0202200).References
- Y. Shibata and Y. Tanimoto, J. Prosthodont. Res., 2015, 59, 20–33 CrossRef.
- A. Lugovskoy and S. Lugovskoy, Mater. Sci. Eng., C, 2014, 43, 527–532 CrossRef CAS.
- A. Lin, C. J. Wang, J. Kelly, P. Gubbi and I. Nishimura, Int. J. Oral Maxillofac. Implants, 2009, 24, 808–816 Search PubMed.
- Y. Li, Y. Jiao, X. Li and Z. Guo, Biochem. Biophys. Res. Commun., 2015, 460, 151–156 CrossRef CAS.
- M. Ting, S. R. Jefferies, W. Xia, H. Engqvist and J. B. Suzuki, J. Oral Implantol., 2016, 43, 58–83 CrossRef.
- G. Thalji and L. F. Cooper, Int. J. Oral Maxillofac. Implants, 2014, 29, e171–e199 CrossRef.
- R. Sridharan, A. R. Cameron, D. J. Kelly, C. J. Kearney and F. J. O'Brien, Mater. Today, 2015, 18, 313–325 CrossRef CAS.
- A. Civantos, E. Martínez-Campos, V. Ramos, C. Elvira, A. Gallardo and A. Abarrategi, ACS Biomater. Sci. Eng., 2017, 3, 1245–1261 CrossRef CAS.
- B. N. Brown, B. D. Ratner, S. B. Goodman, S. Amar and S. F. Badylak, Biomaterials, 2012, 33, 3792–3802 CrossRef CAS.
- A. Mantovani, S. K. Biswas, M. R. Galdiero, A. Sica and M. Locati, J. Pathol., 2013, 229, 176–185 CrossRef CAS.
- A. J. Rao, E. Gibon, T. Ma, Z. Yao, R. L. Smith and S. B. Goodman, Acta Biomater., 2012, 8, 2815–2823 CrossRef CAS.
- E. K. F. Yim and K. W. Leong, Nanomedicine, 2005, 1, 10–21 CrossRef CAS.
- K. S. Tan, L. Qian, R. Rosado, P. M. Flood and L. F. Cooper, Biomaterials, 2006, 27, 5170–5177 CrossRef CAS.
- K. M. Ainslie, S. L. Tao, K. C. Popat, H. Daniels, V. Hardev, C. A. Grimes and T. A. Desai, J. Biomed. Mater. Res., Part A, 2009, 91A, 647–655 CrossRef CAS.
- G. Thalji, C. Gretzer and L. F. Cooper, Bone, 2013, 52, 444–453 CrossRef CAS.
- D. Bitounis, H. Ali-Boucetta, B. H. Hong, D.-H. Min and K. Kostarelos, Adv. Mater., 2013, 25, 2258–2268 CrossRef CAS.
- S. Gurunathan and J. H. Kim, Int. J. Nanomed., 2016, 11, 1927–1945 CrossRef CAS.
- S. R. Shin, Y.-C. Li, H. L. Jang, P. Khoshakhlagh, M. Akbari, A. Nasajpour, Y. S. Zhang, A. Tamayol and A. Khademhosseini, Adv. Drug Delivery Rev., 2016, 105, 255–274 CrossRef CAS.
- H. Liu, J. Cheng, F. Chen, F. Hou, D. Bai, P. Xi and Z. Zeng, ACS Appl. Mater. Interfaces, 2014, 6, 3132–3140 CrossRef CAS.
- R. Tatavarty, H. Ding, G. Lu, R. J. Taylor and X. Bi, Chem. Commun., 2014, 50, 8484–8487 RSC.
- S. Goenka, V. Sant and S. Sant, J. Controlled Release, 2014, 173, 75–88 CrossRef CAS.
- M. Cheng, Y. Qiao, Q. Wang, G. Jin, H. Qin, Y. Zhao, X. Peng, X. Zhang and X. Liu, ACS Appl. Mater. Interfaces, 2015, 7, 13053–13061 CrossRef CAS.
- H. S. Jung, T. Lee, I. K. Kwon, H. S. Kim, S. K. Hahn and C. S. Lee, ACS Appl. Mater. Interfaces, 2015, 7, 9598–9607 CrossRef CAS.
- G. Yue, W. Song, S. Xu, Y. Sun and Z. Wang, Biomater. Sci., 2019, 7, 975–984 RSC.
- Z. Tian, L. Huang, X. Pei, J. Chen, T. Wang, T. Yang, H. Qin, L. Sui and J. Wang, Colloids Surf., B, 2017, 155, 150–158 CrossRef CAS.
- Z. Jia, Y. Shi, P. Xiong, W. Zhou, Y. Cheng, Y. Zheng, T. Xi and S. Wei, ACS Appl. Mater. Interfaces, 2016, 8, 17151–17165 CrossRef CAS.
- J.-J. Shao, W. Lv and Q.-H. Yang, Adv. Mater., 2014, 26, 5586–5612 CrossRef CAS.
- C. Cheng, S. Li, J. Zhao, L. Xiaoxiao, Z. Liu, L. Ma, X. Zhang, S. Sun and C. Zhao, Chem. Eng. J., 2013, 228, 468–481 CrossRef CAS.
- L. B. Modesto-López, M. Miettinen, J. Riikonen, T. Torvela, C. Pfüller, V.-P. Lehto, A. Lähde and J. Jokiniemi, Aerosol Sci. Technol., 2014, 49, 45–56 CrossRef.
- M. Bastwros and G.-Y. Kim, Powder Technol., 2016, 288, 279–285 CrossRef CAS.
- R. C. Tenent, T. M. Barnes, J. D. Bergeson, A. J. Ferguson, B. To, L. M. Gedvilas, M. J. Heben and J. L. Blackburn, Adv. Mater., 2009, 21, 3210–3216 CrossRef CAS.
- Y. Zhu, S. Murali, W. Cai, X. Li, J. W. Suk, J. R. Potts and R. S. Ruoff, Adv. Mater., 2010, 22, 3906–3924 CrossRef CAS.
- W. Att, N. Hori, M. Takeuchi, J. Ouyang, Y. Yang, M. Anpo and T. Ogawa, Biomaterials, 2009, 30, 5352–5363 CrossRef CAS.
- R. Smeets, B. Stadlinger, F. Schwarz, B. Beck-Broichsitter, O. Jung, C. Precht, F. Kloss, A. Gröbe, M. Heiland and T. Ebker, BioMed Res. Int., 2016, 2016, 1–16 CrossRef.
- S.-M. Bang, H.-J. Moon, Y.-D. Kwon, J.-Y. Yoo, A. Pae and I. K. Kwon, Clin. Oral Implants Res., 2014, 25, 831–837 CrossRef.
- W. G. Brodbeck, J. Patel, G. Voskerician, E. Christenson, M. S. Shive, Y. Nakayama, T. Matsuda, N. P. Ziats and J. M. Anderson, Proc. Natl. Acad. Sci. U. S. A., 2002, 99, 10287–10292 CrossRef CAS.
- J. M. Anderson and J. A. Jones, Biomaterials, 2007, 28, 5114–5120 CrossRef CAS.
- A. Khandwekar and C. K. Rho, J. Biomed. Mater. Res., Part A, 2012, 100, 2211–2222 Search PubMed.
- J. Park, B. Kim, J. Han, J. Oh, S. Park, S. Ryu, S. Jung, J.-Y. Shin, B. S. Lee, B. H. Hong, D. Choi and B.-S. Kim, ACS Nano, 2015, 9, 4987–4999 CrossRef CAS.
- V. C. Sanchez, A. Jachak, R. H. Hurt and A. B. Kane, Chem. Res. Toxicol., 2012, 25, 15–34 Search PubMed.
- C. Bussy, D. Jasim, N. Lozano, D. Terry and K. Kostarelos, Nanoscale, 2015, 7, 6432–6435 RSC.
- W. Zhang, Z. Guo, D. Huang, Z. Liu, X. Guo and H. Zhong, Biomaterials, 2011, 32, 8555–8561 CrossRef CAS.
- C. Chung, Y.-K. Kim, D. Shin, S.-R. Ryoo, B. H. Hong and D.-H. Min, Acc. Chem. Res., 2013, 46, 2211–2224 CrossRef CAS.
- R. Peng, X. Yao and J. Ding, Biomaterials, 2011, 32, 8048–8057 CrossRef CAS.
- X. Yao, R. Peng and J. Ding, Adv. Mater., 2013, 25, 5257–5286 CrossRef CAS.
- G. Mendonça, D. B. S. Mendonça, F. J. L. Aragão and L. F. Cooper, Biomaterials, 2008, 29, 3822–3835 CrossRef.
- Q. L. Ma, L. Z. Zhao, R. R. Liu, B. Q. Jin, W. Song and Y. Wang, Biomaterials, 2014, 35, 9853–9867 CrossRef CAS.
- H. Terheyden, N. P. Lang, S. Bierbaum and B. Stadlinger, Clin. Oral Implants Res., 2011, 23, 1127–1135 CrossRef.
- C. Wu, L. Xia, P. Han, M. Xu, B. Fang, J. C. Wang, J. Chang and Y. Xiao, Carbon, 2015, 93, 116–129 CrossRef CAS.
- W. Zhang, Q. Chang, L. Xu, G. Li, G. Yang, X. Ding, X. Wang, D. Cui and X. Jiang, Adv. Healthcare Mater., 2016, 5, 1299–1309 CrossRef CAS.
- J. Han, Y. S. Kim, M.-Y. Lim, H. Y. Kim, S. Kong, M. Kang, Y. W. Choo, J. H. Jun, S. Ryu, H.-Y. Jeong, J. Park, G.-J. Jeong, J.-C. Lee, G. H. Eom, Y. Ahn and B.-S. Kim, ACS Nano, 2018, 12, 1959–1977 CrossRef CAS.
- T. U. Luu, S. C. Gott, B. W. K. Woo, M. P. Rao and W. F. Liu, ACS Appl. Mater. Interfaces, 2015, 7, 28665–28672 CrossRef CAS.
- K. S. Tan, L. Qian, R. Rosado, P. M. Flood and L. F. Cooper, Biomaterials, 2006, 27, 5170–5177 CrossRef CAS.
- A. K. Refai, M. Textor, D. M. Brunette and J. D. Waterfield, J. Biomed. Mater. Res., 2004, 70, 194–205 CrossRef.
- C. C. G. Moura, D. Zanetta-Barbosa, P. Dechichi, V. F. Carvalho and P. B. F. Soares, Braz. Dent. J., 2014, 25, 96–103 CrossRef.
- P. C. Bota, A. M. Collie, P. Puolakkainen, R. B. Vernon, E. H. Sage, B. D. Ratner and P. S. Stayton, J. Biomed. Mater. Res., Part A, 2010, 95, 649–957 CrossRef.
- S. Lee, J. Choi, S. Shin, Y.-M. Im, J. Song, S. S. Kang, T.-H. Nam, T. J. Webster, S.-H. Kim and D. Khang, Acta Biomater., 2011, 7, 2337–2344 CrossRef CAS.
- Y. W. Chun, W. Wang, J. Choi, T.-H. Nam, Y.-H. Lee, K.-K. Cho, Y.-M. Im, M. Kim, Y.-H. Gwon, S. S. Kang, J. D. Lee, K. Lee, D. Khang and T. J. Webster, Carbon, 2011, 49, 2092–2103 CrossRef CAS.
- L. Lv, Y. Xie, K. Li, T. Hu, X. Lu, Y. Cao and X. Zheng, Adv. Healthcare Mater., 2018, 7, 1800675 CrossRef.
- K. M. Hotchkiss, G. B. Reddy, S. L. Hyzy, Z. Schwartz, B. D. Boyan and R. Olivares-Navarrete, Acta Biomater., 2016, 31, 425–434 CrossRef CAS.
- D. O. Freytes, J. W. Kang, I. Marcos-Campos and G. Vunjak-Novakovic, J. Cell. Biochem., 2013, 114, 220–229 CrossRef CAS.
- Y. Liu, L. Wang, T. Kikuiri, K. Akiyama, C. Chen, X. Xu, R. Yang, W. Chen, S. Wang and S. Shi, Nat. Med., 2011, 17, 1594–1601 CrossRef CAS.
- L. Bailey, S. Lippiatt, F. Biancanello, S. Ridder and N. Washburn, Biomaterials, 2005, 26, 5296–5302 CrossRef CAS.
Footnote |
| † Electronic supplementary information (ESI) available. See DOI: 10.1039/c9ra10563h |
| This journal is © The Royal Society of Chemistry 2020 |

