 Open Access Article
Semisolid Al–Ga composites fabricated at room temperature for hydrogen generation†
Yang Yu‡
ab,
Shunqi Wang‡c,
Xuelin Wangb,
Qian Wang *a and
Jing Liuab
aBeijing Key Lab of CryoBiomedical Engineering and Key Lab of Cryogenics, Technical Institute of Physics and Chemistry, Chinese Academy of Sciences, Beijing 100190, China. E-mail: wangqian@mail.ipc.ac.cn
bDepartment of Biomedical Engineering, School of Medicine, Tsinghua University, Beijing 100084, China
cShenyuan Honors College, Beihang University, China
First published on 9th March 2020
Abstract
Usually, Al–Ga alloys are prepared by heating materials to hundreds of degrees for a long time, and the alloys obtained are in the solid state. Although some Ga-rich liquid Al–Ga composites have been developed lately, the mass percentage of Al is small, due to which the hydrogen generation rate and efficiency are limited. Besides, an alkaline solution is indispensable in these studies, which is also a limitation. In this paper, a semisolid Al–Ga composite has been fabricated by mixing liquid gallium and fragmented aluminium foils at room temperature, which is an effective means to generate hydrogen from pure water. With the increase in the Al proportion, the mixture changes from a liquid to a cement-like semisolid material morphologically. Furthermore, an application of the fuel cell taking advantage of the hydrogen released from the composites is given. This method does not require a high-temperature device and only requires water to produce hydrogen once the semisolid Al–Ga composite material is fabricated. Therefore, this is a new approach for making more portable and safer devices for hydrogen production.
1. Introduction
Hydrogen production has aroused widespread interest in the world owing to its broad developing prospect as a kind of clean energy source. Compared with other new energies, such as solar energy and wind energy, hydrogen energy can be easily stored and transported. Among a large number of studies on hydrogen production,1,2 hydrolyses using metals or alloys are real-time hydrogen supply solutions on demand, facilitating the storage and transportation of hydrogen.Some active metals can be used to produce hydrogen by their chemical reactions with an aqueous solution; among these, aluminium is preferred because of its low cost, abundant reserves and environment-friendliness.3,4 However, since aluminium is easily oxidized, it is difficult for pure aluminium to react with water continually. Therefore, the key for hydrogen generation from aluminium is to remove the thin layer of oxides from aluminium.
One approach to solve this issue involves reacting aluminium directly in an acid solution, such as an HCl solution. Besides, an alkaline solution can destroy the oxide film.5–7 Under this condition, the oxide layer is destroyed by hydroxide ions, making the metal free to react with water to produce hydrogen at a higher speed. However, since both acid and alkaline solutions are highly corrosive, they are not safe for practical applications. Therefore, neutral solutions including pure water are the most promising candidates for hydrogen generation. In this case, the way to enhance the chemical reaction of aluminium with water has become a hot issue in the field of hydrogen generation.
It has been proved that a feasible method for the continuous generation of hydrogen involves reduction in the aluminium size down to the nanoscale through mechanical milling.8–10 This method not only reduces the aluminium particle size but also forms some cracks on the metal surface. Consequently, the specific surface area increases and the chemical activity is improved. Another effective way is to ameliorate aluminium through alloying treatment.11 Some researchers have tried to activate aluminium by adding Hg, Li, Bi, Ga, In, Sn, Cu, and Ge, which are able to etch aluminium constantly and destroy its oxide layer.12–18 It is believed that alloys with a low melting point can be responsible for accelerating the coarsening effect, which increases the variability in the reaction yield of older samples.19 However, in previous works, these alloys have been usually prepared by heating materials to hundreds of degrees for a long time. As a result, the requirements for the equipment and process are relatively high.
Here, an alternative approach for hydrogen generation has been proposed, where fragmented aluminium foils and excess liquid gallium are mixed to obtain a semisolid-phase Al–Ga composite for hydrogen generation. After stirring, excess gallium serves as a liquid container, wrapping the broken aluminium to prevent its oxidation. There are two differences compared with the traditional methods mentioned above. One is that the obtained Al–Ga composite is not solid but a semisolid since the amount of gallium is higher. The other is that the preparation process can be easily carried out at room temperature without using any heating device. The motivation for the work stems from the studies on a liquid metal motor moving spontaneously by adding aluminium, where Ga-rich liquid alloys generate lots of gas during the moving course.20–22 Since the mass percentage of Al is only 1% or even less, the volume of the hydrogen generated is not enough.22 Lu et al.23 adopted GaIn alloys to erode Al plates, thereby realizing a continuous reaction to generate hydrogen. Nevertheless, the hydrogen production rate was very low. Besides, it should be noted that these studies still used an alkaline solution as the reaction medium. In this paper, the characteristics including micromorphology, elemental compositions and melting points of the semisolid-phase Al–Ga composite with different percentages were investigated. It was found that at least 40% Al could be dissolved into liquid gallium, and the prepared Al–Ga composite was stable to maintain the semisolid state. Besides, the hydrogen generation performances of the semisolid Al–Ga composite materials were evaluated. Once the mixture was put into pure water, hydrogen gas was quickly released. Then, a fuel cell was implemented to demonstrate the portability and on-demand utility of the technique in applications.
2. Experimental method
2.1 Fabrication of the semisolid-phase Al–Ga composite
In previous studies, the Al–Ga alloys were made by heating materials in a furnace at hundreds of degrees for several hours. Here, the preparation of the Al–Ga composite material was carried out only by stirring de-oxidized liquid gallium (purchased from Shanghai Minor Metals Co., Ltd. with 99.999% purity) and pieces of aluminium (about 100 μm thickness) in a closed plastic container. After stirring with a glass rod for only a few minutes, all the aluminium pieces dissolved in gallium. The whole process was operated at room temperature without heating or extra work.2.2 Characterizations of the Al–Ga composite
In order to determine the structure and composition of the composite material prepared at room temperature, a scanning electron microscope (Hitachi S-4300) was used to obtain the surface features and element distribution of the fresh samples, and SEM images and EDS data were obtained.Besides, the XRD data of the Al–Ga composite material with different ratios were measured with an X-ray diffractometer (D8 focus). The XPS data were obtained using an ESCALab220i-XL electron spectrometer (VG Scientific) and 300 W Al Kα radiation. The binding energies were referenced to the C 1s line at 284.6 eV from adventitious carbon.
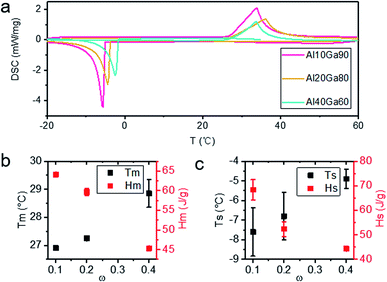
In addition, DSC (DSC 200 F3 Maia, Netzsch Scientific Instrument Trading Co. Ltd, Germany) was used as a tool to measure the melting temperature of the composite materials, and 35.25 mg of the Al10Ga90 composite, 71.48 mg of the Al20Ga80 composite and 24.74 mg of the Al40Ga60 composite were analysed. The test temperature ranged from −20 °C to 60 °C, and the heating and cooling rates were both selected as 5 °C min−1. Each sample went through three temperature cycles. The DSC curves were analysed to calculate the melting point (Tm), freezing point (Ts), unit heat quantity absorbed during melting (Hm) and that released during solidification (Hs) using the NETZSCH Proteus thermal analysis software.
2.3 Measurement of hydrogen gas
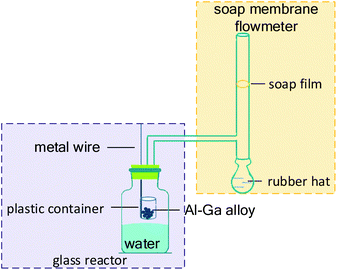
The experimental device to measure the evolving hydrogen, as shown in Fig. 1, consisted of a glass reactor and a soap membrane flowmeter. Initially, 100 mL deionized water at 25 °C was poured into the glass reactor. A plastic container connected with a metal wire was put through the rubber plug and placed above water before the reaction. The prepared Al–Ga composite was in the plastic container. As the wire moved down and the container went underwater, hydrogen was released violently and rapidly once the composite contacted with water. The whole process of collecting hydrogen was recorded by a camera. In each experiment, the deionized water reacted with the composites in excess to ensure that Al was completely consumed.3. Results and discussion
3.1 Appearance of the semisolid Al–Ga composite
The composites with the aluminium contents of 10%, 20%, 40%, 50%, 70% and 80% (mass ratio) were prepared successively at room temperature. During the fabrication process of the Al–Ga composite, the thinner the aluminium sheets and the larger the contact area between aluminium and gallium, the faster the preparation of the composite. It is worth mentioning that the container containing the Al–Ga composite became hot during the mixing process, which meant that some heat was released during the mixing process.The top pictures in Fig. 2 show the macro appearances of the mixtures, and the bottom pictures are the corresponding SEM images. These indicate that as the content of aluminium increases, the mixture surface becomes less smooth and has more wrinkles. Besides, the difficulty in dissolving aluminium in gallium becomes much higher with the increase in the aluminium content. When the mass ratio of Al stirred in the mixture was within 50%, the obtained Al–Ga mixture was semisolid similar to cement, and it was soft and viscous. However, Al70Ga30 and Al80Ga20 turned grey and solidified gradually, and some small Al fragments remained on the composite's surface, indicating that aluminium could not be dissolved in this mixture any more. Therefore, in the follow-up experiments, only semisolid Al–Ga composites with the ratios of 10%, 20% and 40% were focused on to study the performance for hydrogen generation.
 | ||
| Fig. 2 The appearance images (top) and the SEM images (bottom) of the Al–Ga composites with different proportions prepared at room temperature. | ||
3.2 Characterization of the semisolid Al–Ga composite
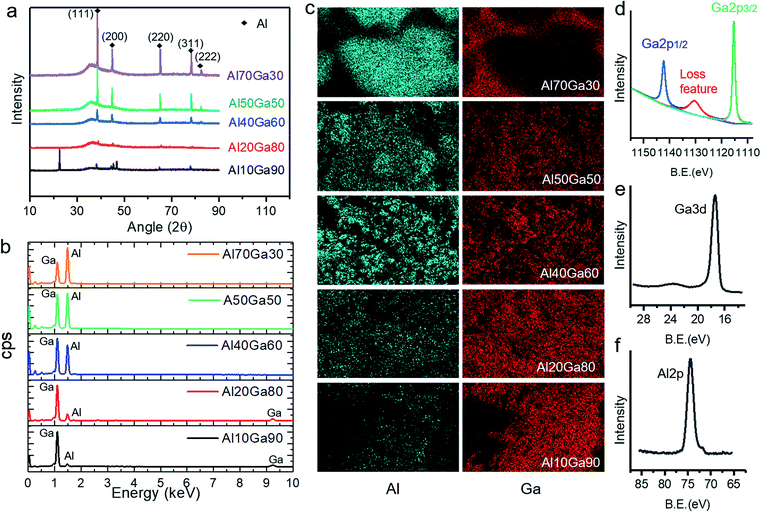
Fig. 3a shows the XRD patterns of the semisolid Al–Ga composites with different proportions. It can be clearly seen that all the composites show the characteristic peaks of pure aluminium, and the intensity of the peaks is proportional to the content of aluminium. It is worth noting that all the XRD patterns show a diffraction “hill” between 30° and 43°, which comes from the liquid gallium (amorphous) in the semisolid Al–Ga composite. When the sample is frozen by liquid nitrogen and then rapidly measured, the XRD pattern not only eliminates the diffraction “hill”, but also reveals more diffraction peaks of solid gallium, as shown in Fig. S1.† The EDS results shown in Fig. 3b reflect the distribution of aluminium and gallium elements, which is also consistent with the XRD results.Besides, in order to assess the elemental distribution, the Al–Ga composites with different mass ratios were scanned to obtain SEM/EDS mapping images. As shown in Fig. 3c, basically, aluminium is evenly distributed in gallium in the Al10Ga90, Al20Ga80, Al40Ga60 and Al50Ga50 samples. However, for Al70Ga30, the elements of gallium and aluminium are not evenly distributed, which indicates that the two metals were not mixed well. Al80Ga20 has a similar result with Al70Ga30. In addition, XPS was carried out after the preparation of the Al–Ga alloys. Fig. 3d and e show the XPS spectra of Ga 2p and Ga 3d, respectively, and the latter has a deeper sampling depth compared to the former. Two peaks of Ga 2p are observed at 1142.27 eV and 1115.35 eV, and the loss feature can also be seen obviously (1130 eV). Ga 3d has only one peak (17.29 eV) and it does not split significantly. As shown in Fig. 3f, the peak value of Al 2p is 74.21 eV, which indicates that Al on the surface of the composite has been oxidized. This is the factor that affects the efficiency of hydrogen production. The peaks measured for other Al–Ga alloys with different ratios do not reveal substantial differences except for the relative strength of Al 2p and Ga 3d.
3.3 DSC measurements
The DSC curves of Al10Ga90, Al20Ga80 and Al40Ga60 are shown in Fig. 4a. During one single heating and cooling cycle, the sample melted first when heated to near Tm and then started to solidify when the temperature dropped to Ts. Because of the supercooling nature of the gallium-based liquid metal, the values of Tm and Ts are usually not equal. It is found from Fig. 4b that the Tm of the Al–Ga composite materials with different ratios is lower than that of pure gallium (29.8 °C) and infinitely close to it with the increase in the Al content (as shown in Fig. 4b). Similarly, Ts was linearly proportional to the content of Al, as shown in Fig. 4c. However, Ts had more significant fluctuation than Tm. This might be due to the influence of supercooling. Besides, both Hm and Hs were measured and compared, and they showed a decreasing trend with the increase in Al content.3.4 Hydrogen production analysis
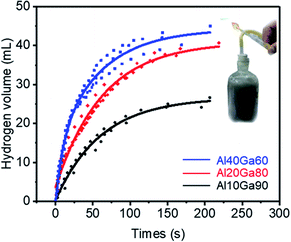
According to the mass ratio of aluminium in the composite, the experiments were divided into three groups and each group was tested 3 times. In each trial, about 0.4 g of the Al10Ga90 composite, about 0.2 g of the Al20Ga80 composite, and about 0.1 g of the Al40Ga60 composite were used; thus, the Al content in each group was theoretically the same (0.04 g). For each experiment, the chemical reaction was very intense and hydrogen was collected rapidly at the initial stage. After the reaction, the water was much warmer. In order to ensure that all weighed composites participated in the reaction, not just the Al–Ga composite, but also the plastic container containing the composite was fully immersed under water.Fig. 5 presents the scatter plot and fitting curves (shown in the ESI†) for the hydrogen evolution volume over time during the reactions of the Al–Ga mixture with deionized water. The final volume of hydrogen produced for the Al10Ga90 composite was 26.9 mL, while for the Al20Ga80 and Al40Ga60 composites, the values were 41.04 mL and 44.26 mL, respectively. With respect to the hydrogen production rate, it was obvious that the Al40Ga60 composite showed the fastest rate. The results indicated that the higher the proportion of aluminium, the greater the hydrogen production efficiency and rate. This is because a certain amount aluminium is consumed by oxidation during the preparation of the Al–Ga composite. Besides, the mass loss of gallium comes from the oxidation reaction during the mixing process, and the remaining gallium can be reused to dissolve more aluminium as the reaction catalyst (the details can be seen in the ESI†).
3.5 Application of Al–Ga composite for hydrogen production
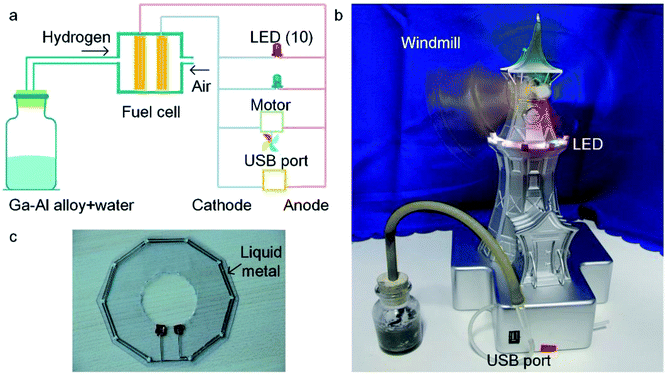
One typical application of the Al–Ga composites for hydrogen production is in the hydrogen fuel cell, which converts hydrogen and oxygen into electric power by a chemical reaction (as shown in ESI Movie 1†). Fig. 6a shows the structure of the demonstrative hydrogen fuel cell device. Oxygen is provided by air, and hydrogen comes from the reaction of the Al–Ga composites with water. The device is able to drive ten LEDs and a motor and outputs voltage through a USB port at the same time. As shown in Fig. 6b, the LEDs have been lit up and the windmill is spinning fast. It is worth mentioning that the LED circuit was printed using the liquid metal conductive ink (shown in Fig. 6c).3.6 Comparison of various hydrogen production methods from aluminium
The key problem in the hydrogen production from aluminium is to destroy the oxide film on its surface. There have been various methods, including dissolving the oxide film in acid/alkaline solutions, ball-milling aluminium nanoparticles and adding a small amount of low-melting metals (such as Ga, In, Ca or Mg) into aluminium at high temperatures to form solid aluminium-based alloys. The comparison of the performance of the method proposed in this paper with that of other existing methods is shown in Table 1. The method using acid/alkaline solutions can rapidly generate a yield close to the theoretical value for hydrogen generation. Unfortunately, the biggest problem with this method is that acid/alkaline solutions are highly corrosive. Under common circumstances, a neutral solution such as water is a better choice as the reaction medium. It has been found that when aluminium is just being processed into nanoparticles, it can react violently with water. However, this method is limited because of the high cost of fabricating aluminium nanoparticles. Both the solid Ga/In/Mg-doped aluminium alloys and the semisolid Al–Ga composite in the paper are to activate the aluminum by adding other metals. The difference in the preparation process is that the semisolid Al–Ga composite can be prepared at room temperature by dissolving aluminium in liquid gallium with a higher mass ratio. Therefore, although the hydrogen production efficiency is not higher than that of other methods, the preparation of the semisolid Al–Ga composite is simple and it can be used safely to generate hydrogen.| Hydrogen production efficiency | Safety | Material preparation | Reaction device | |
|---|---|---|---|---|
| Aluminium + acid/alkaline solution | Near 100% | Low | Simple | Complex |
| Nano aluminium + water | Middle | High | Complex | Simple |
| Solid Ga/In/Mg-doped aluminium alloy + water | Higher | High | Complex | Simple |
| Semisolid Al–Ga composite + water | Middle | High | Simple | Simple |
4. Conclusions
A novel method of hydrogen generation based on semisolid Al–Ga composites was proposed in the paper. The semisolid Al–Ga composites can be prepared by mixing liquid gallium and pieces of aluminium at room temperature. Compared with other existing hydrogen production methods with the Al–Ga composites, the method presented in this study is much simpler and safer. The prepared semisolid Al–Ga composite only requires pure water to produce hydrogen rapidly. Therefore, it is a new approach for making more portable and safer devices for hydrogen generation.Conflicts of interest
There are no conflicts to declare.Acknowledgements
The authors would like to thank the National Natural Science Foundation of China (No. 51605472), Beijing Science and Technology Planning Project (No. Z191100007619021).References
- H. Argun and G. Onaran, Int. J. Hydrogen Energy, 2016, 41, 8057–8066 CrossRef CAS.
- J. Chen, C. Wang, Y. Wu, H. Fu, J. Zheng and X. Li, RSC Adv., 2016, 6, 36863–36869 RSC.
- S. Xu, X. Zhao and J. Liu, Renewable Sustainable Energy Rev., 2018, 92, 17–37 CrossRef CAS.
- G.-H. Liang, W.-Z. Gai, Z.-Y. Deng, P. Xu and Z. Cheng, RSC Adv., 2016, 6, 35305–35314 RSC.
- A. O. Dudoladov, O. A. Buryakovskaya, M. S. Vlaskin, A. Z. Zhuk and E. I. Shkolnikov, Int. J. Hydrogen Energy, 2016, 41, 2230–2237 CrossRef CAS.
- H. B. Zou, S. Z. Chen, Z. H. Zhao and W. M. Lin, J. Alloys Compd., 2013, 578, 380–384 CrossRef CAS.
- C. B. Porciuncula, N. R. Marcilio, I. C. Tessaro and M. Gerchmann, Braz. J. Chem. Eng., 2012, 29, 337–348 CrossRef CAS.
- B. Alinejad and K. Mahmoodi, Int. J. Hydrogen Energy, 2009, 34, 7934–7938 CrossRef CAS.
- Y. Liu, X. Wang, H. Liu, Z. Dong, S. Li, H. Ge and M. Yan, RSC Adv., 2015, 5, 60460–60466 RSC.
- R. Sun, P. Liu, H. Qi, J. Liu and T. Ding, J. Nanopart. Res., 2019, 21, 72 CrossRef.
- W. J. Yang, T. Y. Zhang, J. Z. Liu, Z. H. Wang, J. H. Zhou and K. F. Cen, Energy, 2015, 93, 451–457 CrossRef CAS.
- W. Wang, X. M. Zhao, D. M. Chen and K. Yang, Int. J. Hydrogen Energy, 2012, 37, 2187–2194 CrossRef CAS.
- V. Shmelev, V. Nilzolaev, J. H. Lee and C. Yim, Int. J. Hydrogen Energy, 2016, 41, 16664–16673 CrossRef CAS.
- D. F. Wu, L. Z. Ouyang, C. Wu, H. Wang, J. W. Liu, L. X. Sun and M. Zhu, J. Alloys Compd., 2015, 642, 180–184 CrossRef CAS.
- H. Luo, J. Liu, X. X. Pu, J. Liang, Z. J. Wang, F. J. Wang, K. Zhang, Y. J. Peng, B. Xu, J. H. Li and X. B. Yu, J. Am. Ceram. Soc., 2011, 94, 3976–3982 CrossRef CAS.
- H. Liu, F. Xu, L. X. Sun, Z. Cao and H. Y. Zhou, Chem. Res. Chin. Univ., 2013, 34, 1953–1958 CAS.
- M. J. Baniamerian and S. E. Moradi, J. Alloys Compd., 2011, 509, 6307–6310 CrossRef CAS.
- B. D. Du, W. Wang, W. Chen, D. M. Chen and K. Yang, Int. J. Hydrogen Energy, 2017, 42, 21586–21596 CrossRef CAS.
- J. T. Ziebarth, J. M. Woodall, R. A. Kramer and G. Choi, Int. J. Hydrogen Energy, 2011, 36, 5271–5279 CrossRef CAS.
- J. Zhang, Y. Yao, L. Sheng and J. Liu, Adv. Mater., 2015, 27, 2648–2655 CrossRef CAS PubMed.
- B. Yuan, S. C. Tan, Y. X. Zhou and J. Liu, Sci. Bull., 2015, 60, 1203–1210 CrossRef.
- S. C. Tan, H. Gui, X. H. Yang, B. Yuan, S. H. Zhan and J. Liu, Int. J. Hydrogen Energy, 2016, 41, 22663–22667 CrossRef CAS.
- J. Lu, W. Yu, S. Tan, L. Wang, X. Yang and J. Liu, RSC Adv., 2017, 7, 30839–30844 RSC.
Footnotes |
| † Electronic supplementary information (ESI) available: Details of sample preparation, additional structural and dehydrogenation characterization. See DOI: 10.1039/c9ra10906d |
| ‡ These authors contributed equally. |
| This journal is © The Royal Society of Chemistry 2020 |

